")
Back to Journals » Journal of Pain Research » Volume 13
Examining Configural, Metric, and Scalar Invariance of the Pain Catastrophizing Scale in Native American and Non-Hispanic White Adults in the Oklahoma Study of Native American Pain Risk (OK-SNAP)
Authors Rhudy JL , Arnau RC, Huber FA, Lannon EW , Kuhn BL, Palit S, Payne MF, Sturycz CA , Hellman N , Guereca YM, Toledo TA, Shadlow JO
Received 13 December 2019
Accepted for publication 7 March 2020
Published 6 May 2020 Volume 2020:13 Pages 961—969
DOI https://doi.org/10.2147/JPR.S242126
Checked for plagiarism Yes
Review by Single anonymous peer review
Peer reviewer comments 2
Editor who approved publication: Professor E Alfonso Romero-Sandoval
Jamie L Rhudy,1 Randolph C Arnau,2 Felicitas A Huber,1 Edward W Lannon,1 Bethany L Kuhn,1 Shreela Palit,1 Michael F Payne,1,3 Cassandra A Sturycz,1 Natalie Hellman,1 Yvette M Guereca,1 Tyler A Toledo,1 Joanna O Shadlow1
1The University of Tulsa, Department of Psychology, Tulsa, OK, USA; 2University of Southern Mississippi, Department of Psychology, Hattiesburg, MS, USA; 3Department of Pediatrics, Division of Behavioral Medicine and Clinical Psychology, Cincinnati Children’s Hospital Medical Center, Cincinnati, OH, USA
Correspondence: Jamie L Rhudy
The University of Tulsa, Department of Psychology, Tulsa, OK, USA
Tel +1918 631-2839
Fax +1918 631-2833
Email [email protected]
Introduction: Native Americans (NAs) have a higher prevalence of chronic pain than other US racial/ethnic groups, but the mechanisms contributing to this pain disparity are under-researched. Pain catastrophizing is one of the most important psychosocial predictors of negative pain outcomes, and the Pain Catastrophizing Scale (PCS) has been established as a reliable and valid measure of the pain catastrophizing construct. However, before the PCS can be used to study pain risk in NAs, it is prudent to first determine whether the established 3-factor structure of the PCS also holds true for NAs.
Methods: The current study examined the measurement (configural, metric, and scalar) invariance of the PCS in a healthy, pain-free sample of 138 NA and 144 non-Hispanic white (NHW) participants.
Results: Results suggest that the previously established 3-factor solution fits for both groups (configural invariance) and that the factor loadings were equivalent across groups (metric invariance). Scalar invariance was also established, except for 1 minor scalar difference in a single threshold for item 3 (suggesting NHWs were more likely to respond with a 4 on that item than NAs).
Discussion: Results provide additional evidence for the psychometric properties of the PCS and suggest it can be used to study pain catastrophizing in healthy, pain-free NA samples.
Keywords: confirmatory factor analysis, pain catastrophizing, Native Americans, pain, ethnic differences, pain coping
Introduction
Research over the last two decades has drawn attention to the importance of racial and ethnic differences in the experience of pain that may contribute to pain disparities.1,2 For example, several studies have documented that otherwise healthy, pain-free racial/ethnic minorities (eg, African-Americans, Hispanics, Asians) have higher pain sensitivity (eg, lower tolerances, higher pain ratings to experimental stimuli) than non-Hispanic whites (NHW). Ostensibly, this hyperalgesia could place them at risk for future chronic pain development.
One understudied racial/ethnic group is Native Americans (NAs) and accumulating evidence suggests that NAs have a higher prevalence of several chronic pain conditions than any other US racial/ethnic group.3–5 A number of factors may contribute to NA pain disparities, including biology (eg, genetics), environment (eg, access to health care), provider characteristics (eg, implicit biases), and health behaviors (eg, diet, exercise). Further, psychological factors may also contribute.
One of the most robust psychological predictors of pain and pain-related outcomes is pain catastrophizing.6–11 Pain catastrophizing was originally conceptualized as a tendency to believe that there is nothing that can be done to alleviate pain (ie, helplessness) and was measured by a 6-item subscale of the Coping Strategies Questionnaire.12 However, Sullivan and colleagues developed a more comprehensive 13-item instrument called the Pain Catastrophizing Scale [PCS;13] that expanded the construct to include two additional components: magnification (the tendency to believe that pain is worse than it is) and rumination (the tendency to ruminate about how bad pain is). Confirmatory factor analytic (CFA) studies have verified a 3-factor solution that corresponds to the three components noted above and whose structure is invariant across pain-free and chronic pain populations, as well as men and women.14–16
To date, pain catastrophizing has not been examined as an explanatory variable in the pain disparities noted in NAs. For example, pain could promote pain catastrophizing that in turn promotes further pain in a vicious cycle. However, before this research can be conducted, a conservative first step would be to establish the invariance of the PCS within a NA sample given potential socio-cultural differences in the conceptualization of pain and pain-related constructs,5 Indeed, a semi-structured interview asking about the meaning of pain was administered as part of the parent study from which the current data were drawn. Qualitative analyses of the interview found that NAs were less likely to use the word “pain” to describe experiences that hurt, and less likely to consider pain a warning sign or indication of a physical abnormality.17 Similarly, there could be sociocultural differences in pain catastrophizing that promote a different factor structure.
Given that the construct validity of the PCS has been primarily studied in samples from the majority (ie, NHW) culture, the factor structure was compared between NAs and NHWs. Data were collected from 282 men and women (138 NAs, 144 NHW) who participated in the Oklahoma Study of Native American Pain Risk (OK-SNAP; ie, the parent study). OK-SNAP was designed to examine potential biological (eg, pain sensitivity, central sensitization, pain inhibition) and psychosocial (eg, pain catastrophizing) mechanisms that contribute to the higher prevalence of chronic pain in NAs. Only healthy, pain-free individuals were recruited in order to rule out that any observed differences were due to disease severity and/or treatment disparities. Thus, the current sample were all healthy and pain-free. Although it is plausible that the factor structure of the PCS may differ between groups, we had no specific hypotheses regarding those differences.
Methods
Participants
Native American participants represent tribal nations predominately from Southern Plains and eastern Oklahoma tribes. NA status was verified from the Certificate of Degree of Indian Blood (CDIB) or tribal membership cards. Participants were recruited from city (eg, Urban Tulsa) and tribal (eg, Cherokee Phoenix, Native Times) newspapers, radio ads, fliers, personal communications with NA groups (eg, American Indians into Psychology, Oklahoma State University Native American Student Association), email announcements, and online posts (Facebook, Craigslist). Efforts were made to reach both urban and rural dwelling participants by posting ads in multiple newspapers and hanging fliers in the Tulsa area, as well as most small surrounding towns/cities. Persons were excluded if they: (a) were <18 years old, (b) had a history of cardiovascular, neuroendocrine, musculoskeletal, neurological disorders, (c) experienced current acute pain or a history of chronic pain, (d) had a BMI≥35 (due to difficulties administering some physiological pain tests), (e) currently used anti-depressants, anxiolytic, analgesic, stimulant, or anti-hypertensive medication, (f) had current psychotic symptoms (assessed by Psychosis Screening Questionnaire18) or substance use problems, and/or (g) had an inability to read/speak English. The study was approved by Institutional Review Boards of University of Tulsa, Cherokee Nation, and the Indian Health Service Oklahoma City Area Office. Participants were given an overview of all procedures and told they could withdraw at any time. All participants provided verbal and written informed consent prior to enrollment and received a $100 honorarium for the completion of each testing day (or $10/hour of non-completed days). Data collection occurred between March 2014 and February 2018. Participants in the OK-SNAP study were not excluded based on racial or ethnic status; however, the 20 persons who enrolled in the study but identified as a non-NA minority were excluded from the current analyses. Characteristics of the 138 NA and 144 NHW participants recruited are reported in Table 1. This sample size should be adequate for CFA of the PCS,19 as this yields a participant-to-item ratio of at least 10 to 1 for each group.
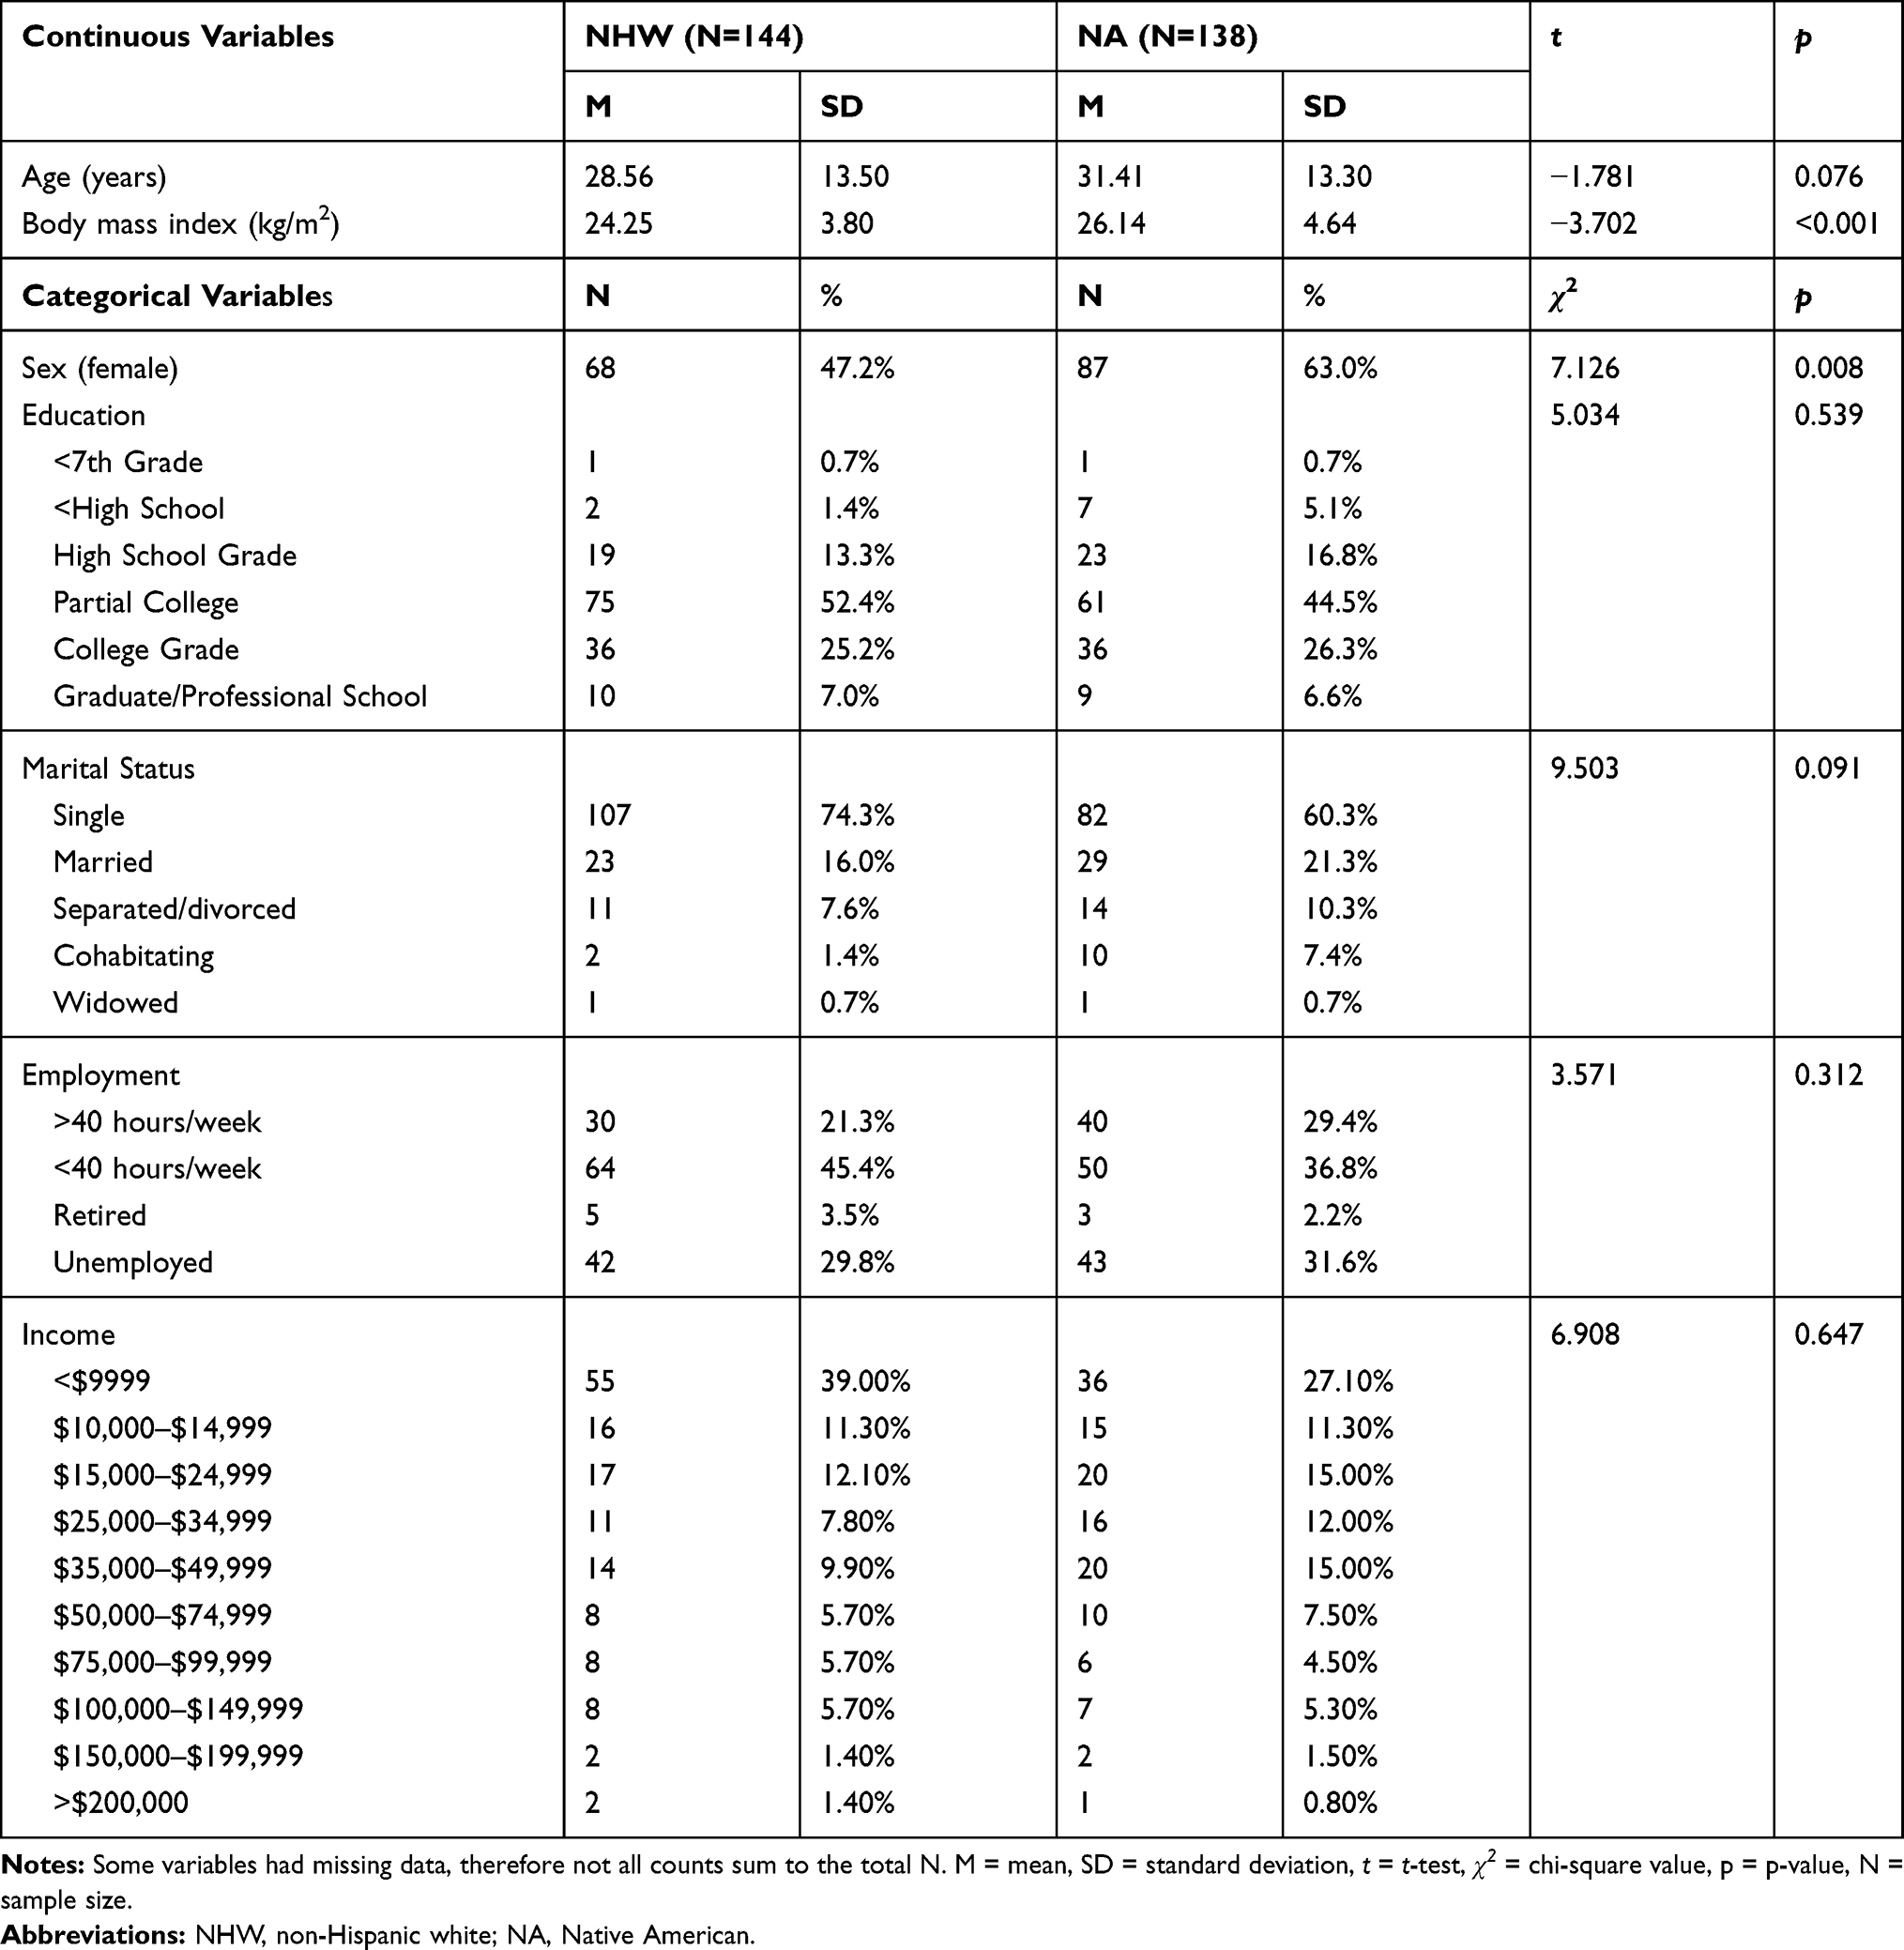 |
Table 1 Group Characteristics |
Pain Catastrophizing Scale
The Pain Catastrophizing Scale (PCS) is a 13-item scale that assesses catastrophic thinking associated with pain.13 Participants make responses on a 5-point scale that ranges from 0 (not at all) to 4 (all of the time). The PCS was administered via computer on the first day of testing, after the health screen, but prior to any pain testing. The traditional instructions were used to assess trait, or dispositional, catastrophizing (“Using the following scale, please indicate the degree to which you have these thoughts and feelings when you are experiencing pain.”). Table 2 presents the means, standard deviations, and internal consistencies for each subscale and the total score by racial/ethnic group. There were no missing data.
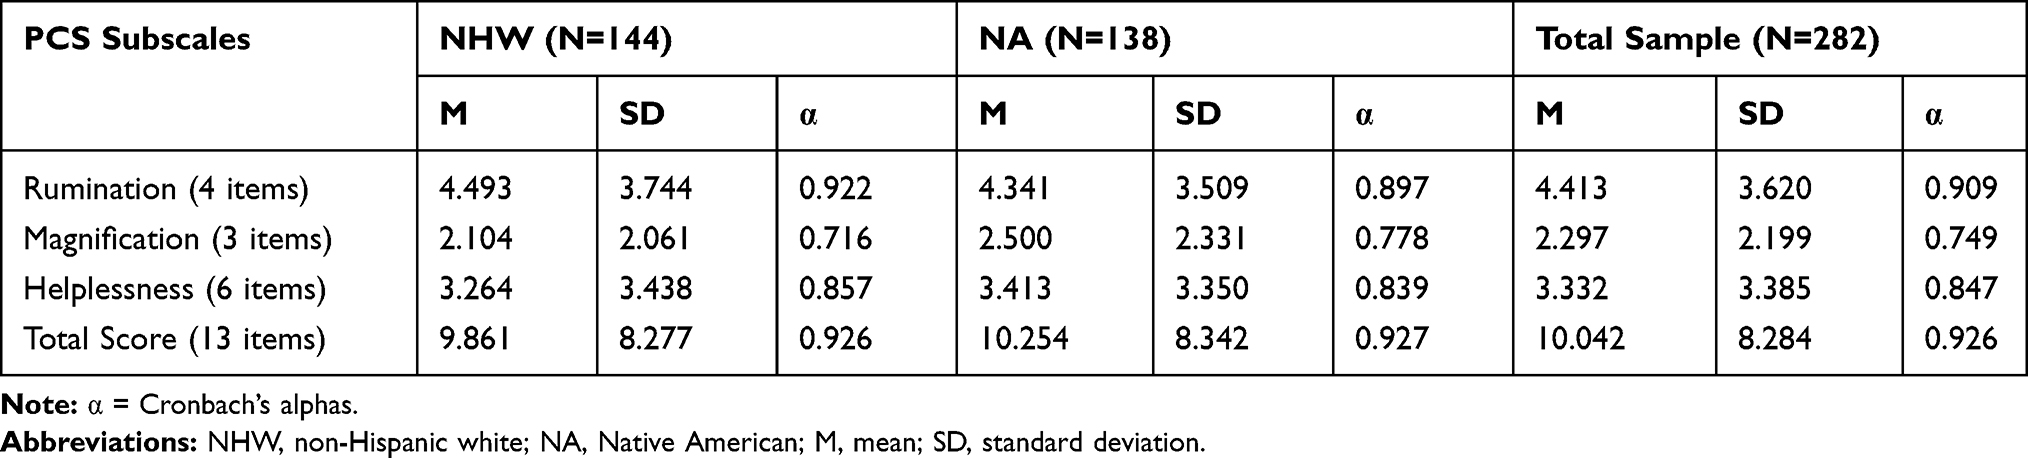 |
Table 2 Means, Standard Deviations, and Cronbach’s Alphas for the Pain Catastrophizing Scale (PCS) by Non-Hispanic White and Native American Participants |
Data Analysis
To test the measurement invariance of scores from the PCS across NHW and NA participants, multiple group confirmatory factor analyses (MGCFA) were conducted using Mplus 6.11.20 Given the data were skewed and the fact that the 5-point Likert scale yields ordinal data, we designated the item responses as ordered categorical in the model, and thus the models were run using the weighted least square mean and variance adjusted (WLSMV) estimation. For purposes of model identification, loadings for the first item for each factor were fixed to 1.0, and item residuals were fixed to 1.0.
Following the recommendations of Brown,21 the first step was to test baseline models of the previously established 3-factor structure separately for the NHW and NA samples. Baseline model fit was tested using the comparative fit index (CFI) and the root-mean-square error of approximation (RMSEA), with values of CFI ≥ 0.95 and RMSEA ≤ 0.08 as an indication of good fit.22 Next, a series of nested MGCFA models were fitted to the data in order to test for configural invariance (same factor pattern/structure), metric invariance (same factor loadings), and scalar invariance (same item thresholds). In order to test each level of invariance, the difference in fit of the more constrained model is compared with that of the next less constrained model.
Configural invariance, also referred to as pattern invariance, means that the number of factors and pattern of loadings is the same for both groups. In other words, the specific items that load on each of the respective factors are the same for both groups. Figure 1 depicts the configural invariance model for the PCS. As is traditional for CFA models, factor loadings are depicted with λ, and latent factor correlations are depicted with ϕ. Given our item responses are ordinal rather than continuous, the model includes item thresholds (as opposed to item means or intercepts). For a dichotomous item (yes/no, true/false) an item threshold would refer to the level of the latent variable required for a positive endorsement of the item to be more likely than not. With ordered categorical (ordinal) item responses, there are n – 1 thresholds, where n = number of response options. Thus, for the PCS, with a 5-point Likert response format, there are 4 possible thresholds per item. In this case, the first threshold refers to the level of the latent factor required to endorse a “1” on the Likert scale over a “0”, the second threshold refers to endorsing a “2” over a “1”, and so on. For the sake of clarity, the figures are only depicting a path for one threshold per item.
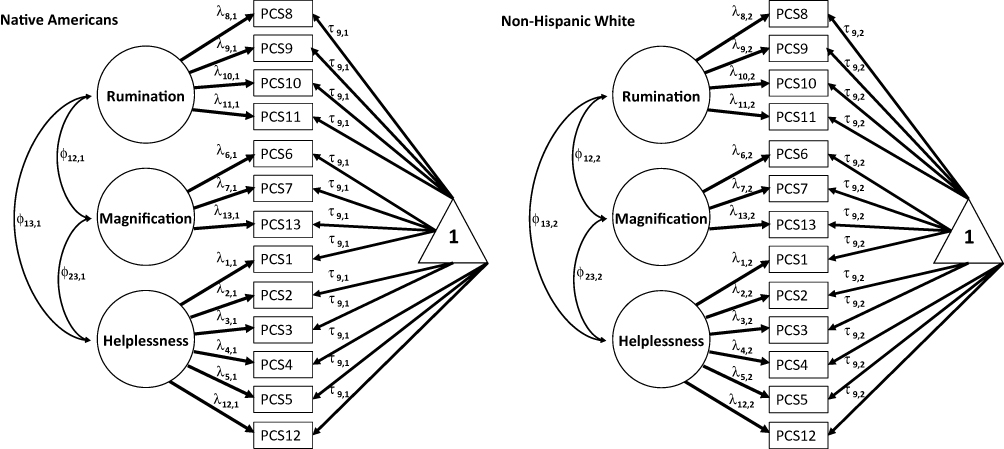 |
Figure 1 Configural, metric, and scalar invariance of the Pain Catastrophizing Scale (PCS) in Native American and non-Hispanic white adults. Manifest variables (item responses) are boxes, latent variables (factors) are circles, and item thresholds are indicated by triangles with a “1”. For the sake of clarify, the figure only depicts a path for one threshold per item even though each item has up to 4 thresholds (given the 5-point Likert response scale). Further, item residuals (error terms) are not depicted. As is traditional for CFA models, factor loadings are depicted with λ, and latent factor correlations are depicted with ϕ. Configural invariance posits the same number of factors and same factor patterns across groups, but factor loadings and items thresholds are allowed to vary across groups. Metric invariance posits the same constraints as the configural invariance model, with the additional constraint that the factor loadings (λ) are equal across groups, but the thresholds and factor correlations are free to vary across groups. Scalar invariance imposes the same constraints as configural and metric invariance, but with the added constraint that the item thresholds (τ) are equated across groups. |
Metric invariance (also referred to as weak invariance), means that not only are the same items loading on the same factors for both groups, but the actual magnitude of the loadings are the same across groups for each respective item. For example, the loading of PCS8 on the Rumination factor was constrained to be the same for both NAs and NHWs. In Figure 1, to establish metric invariance, the λs for the NA group were constrained to be the same as the NHW group, while the other parameters (thresholds and factor correlations) were free to vary across groups.
Scalar invariance (also referred to as strong invariance) imposes the same constraints as configural and metric invariance, but with the added constraint that the thresholds (τ) are equated across groups. It should be noted that traditionally CFA models include item residual (error) terms. In order for a MGCFA with thresholds to be mathematically identified, all item residuals are fixed to 1.0.
For assessment of model fit, we report the chi-square (χ2), comparative fit index (CFI), and the root-mean-square error of approximation (RMSEA). Invariance has traditionally been evaluated using the χ2 difference test (Δχ2), with a statistically significance decrease in χ2 for the more constrained model indicative of non-invariance. However, more recently, researchers have advocated for an alternative, given the sensitivity of the Δχ2 to sample size, which can lead to conclusions of non-invariance when the decrease in fit is statistically significant but trivial for practical measurement purposes.23–25 Thus for the current study, following the recommendations of Chen,24 for sample sizes equal to or less than 300, a decrease in CFI greater than or equal to 0.005, combined with an increase in RMSEA of 0.01 or greater, was used as evidence for non-invariance.
Results
Fit statistics for the baseline and MGCFAs are presented in Table 3. Both of the baseline models, estimated separately for the NHW and NA samples, demonstrated good fit. Thus, we proceeded with the MGCFAs to test configural, metric, and scalar invariance across groups.
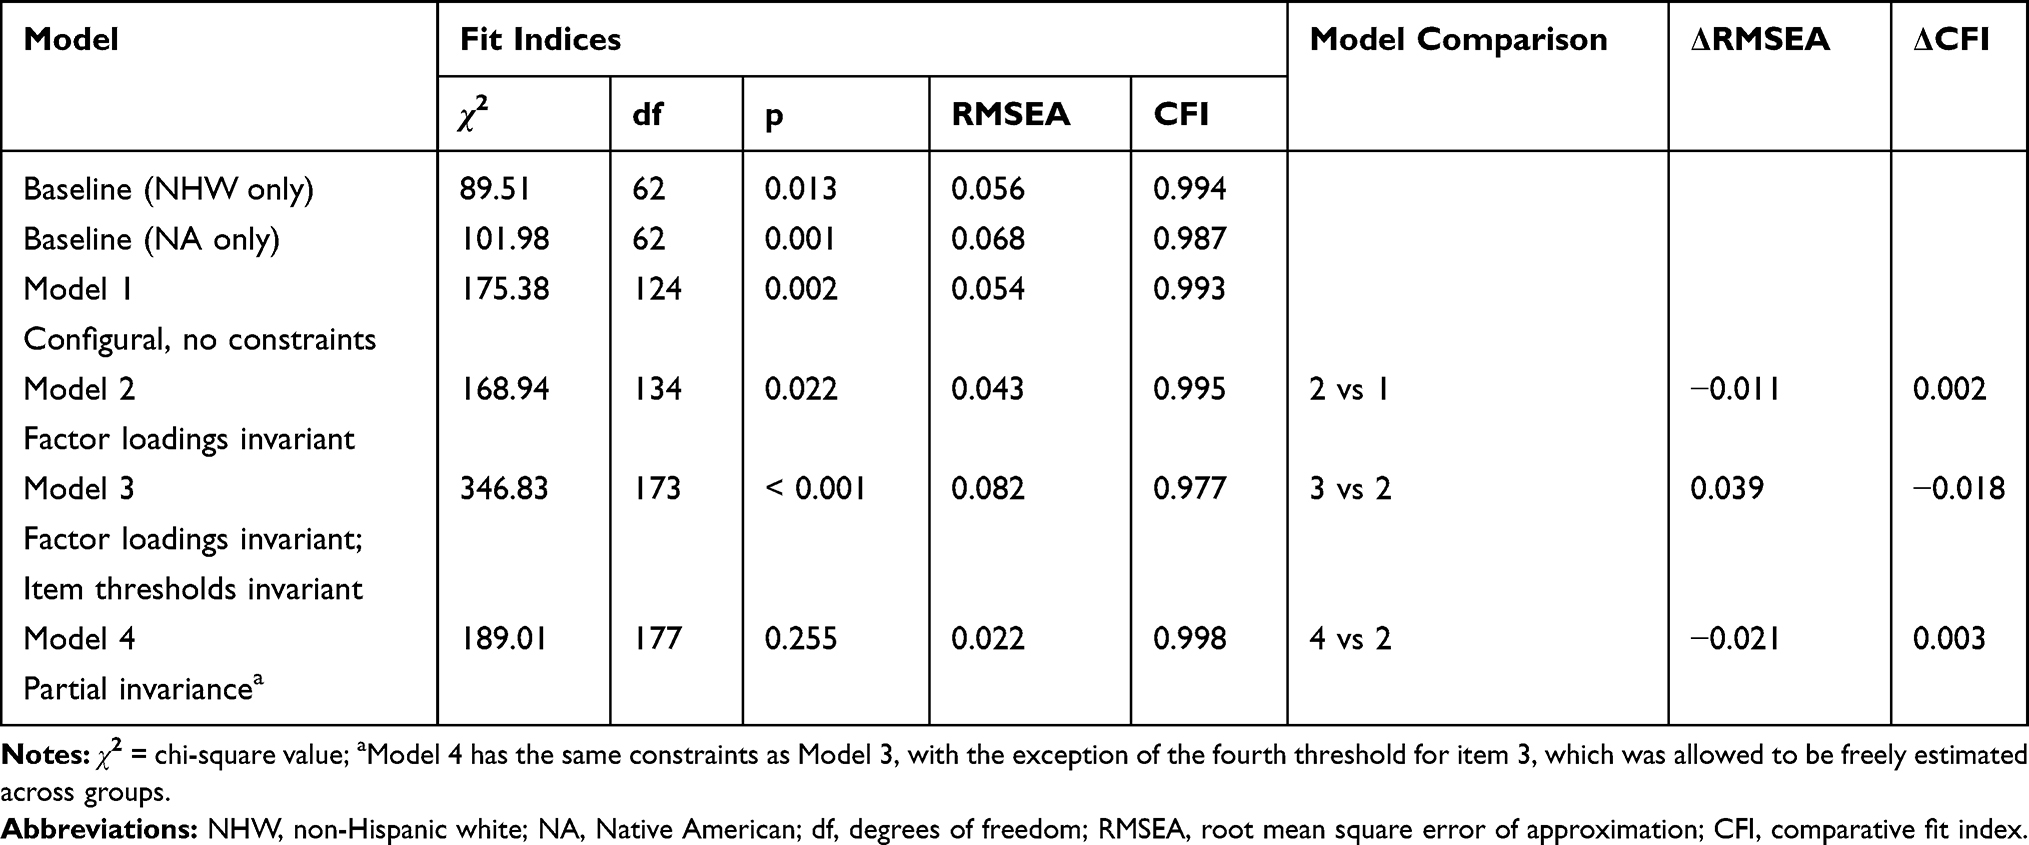 |
Table 3 Invariance Fit Statistics for the Pain Catastrophizing Scale in Native Americans and Non-Hispanic White Participants |
The multiple group configural model, with no constraints except the same factor pattern/structure across groups, also showed a good fit to the data. For model 2, with factor loadings constrained to be equal across group, the fit was excellent. When compared with model 1, the fit of model 2 was actually slightly better than that of model 1, as evidenced by improvements in both the RMSEA and CFI. Thus, metric invariance across the NHW and NA groups was demonstrated.
Model 3, where both factor loadings and item thresholds were constrained to be equal across groups, the fit of the model was satisfactory, with the CFI in the excellent range and the RMSEA in the acceptable range. However, Model 3 showed a notable decrease in fit compared to model 2, as evidenced by an increase in RMSEA greater than 0.015 combined with a decrease in CFI greater than 0.01. Thus, scalar invariance across the groups was not confirmed.
Given the lack of scalar invariance, we proceeded to evaluate the possibility of partial invariance, as recommended by Byrne, Shavelson, and Muthén.26 As such, we evaluated the modification indices (MI) for the inter-group threshold constraints from model 3, to determine if any particular threshold constraints were notably contributing to the lack of fit. The MI for the fourth threshold for PCS3 (“It’s terrible and I think it’s never going to end”) was found to be of a magnitude that was noteworthy and statistically significant. Thus, a partial invariance model (Model 4) was estimated, that was a revision of model 3 where the invariance constraint for that threshold was relaxed. As seen in Table 3, relaxing the threshold constraint for PCS3 led to a model with excellent fit. Further, the fit of this model did not show a notable decrease in fit compared to the metric invariance model (Model 2), and in fact showed a slight improvement in fit as per a decrease in RMSEA and an increase in CFI. Thus, partial scalar invariance for the PCS was confirmed, with all thresholds showing invariance except for those associated with PCS3. The model indicated that threshold 4 for PCS3 was 8.21 for the NHW sample and 2.45 for the NA sample. Figure 2 presents the factor loadings and factor correlations for the final partial scalar invariance model.
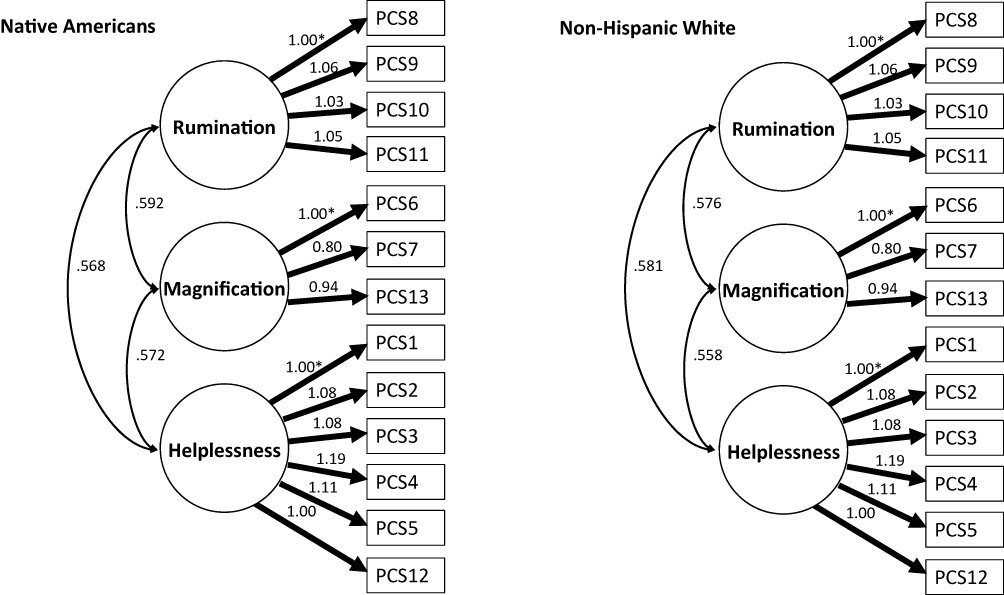 |
Figure 2 Unstandardized parameter estimates for final model of the Pain Catastrophizing Scale (PCS) in Native American and non-Hispanic white adults. *Loading was fixed to 1.0 for model identification. All loadings are statistically significant. For model identification purposes, all item residuals were fixed to 1, and thus are not depicted. |
Discussion
The present study used multiple group CFA to investigate measurement invariance of the Pain Catastrophizing Scale (PCS) in healthy, pain-free, Native American (NA) and non-Hispanic white (NHW) adults in the Oklahoma Study of Native American Pain Risk (OK-SNAP). The previously established 3-factor structure of the PCS was replicated and showed good fit in both samples. This is consistent with evidence from previous studies that demonstrated pain catastrophizing is a latent construct consisting of three interrelated factors, ie, magnification, rumination, and helplessness.14–16
Configural and metric invariance were demonstrated for the PCS across the NA and NHW groups. Thus, the same factor pattern structure (ie, equivalent number of factors) and equivalence of factor loadings was established. Even though complete scalar invariance across groups was not confirmed, a partial invariance model showed excellent fit, with the only non-invariant parameter being threshold 4 of item PCS3 (“It is terrible and I think it’s never going to get any better”). Given there are four thresholds per item (ie, 52 total thresholds), non-invariance for 1 threshold out of 52 can likely be deemed trivial from a measurement perspective.
The fourth threshold refers to the level of latent construct required to make it more likely than not for an individual to endorse a “4” on the Likert scale, as opposed to less than 3. Thus, the higher threshold for NHW compared to that for NA indicates a higher difficulty (or severity) level for this item. In other words, it takes a higher level of the latent variable for a NHW to endorse 4 on this item than it does for a NA. This may reflect a cultural difference in the tendency to engage in this specific helplessness-related cognition. Alternatively, the threshold difference might reflect a statistical artifact due to low levels of endorsement of a 4 on this item for either group.
Since partial invariance is sufficient to compare groups on a latent variable26,27 and the majority of items on the helplessness factor are invariant across groups (ie, all items except for PCS3), our results show that the PCS is an appropriate measure to investigate differences in pain catastrophizing between NAs and NHWs. Thus, differences in latent pain catastrophizing scores between NAs and NHWs can be interpreted as meaningful and quantitative, and not due to measurement error or differences in the measurement structure across the groups. This is an important first step considering research indicating that NAs may conceptualize pain differently;5,17 therefore, it was plausible that NAs might have different conceptualizations about pain catastrophizing. This study suggests that is not the case, at least in the present sample of NAs from the Southern Plains region.
Another result worth discussing is the fact that for a couple of the steps in the invariance testing, the more constrained model showed a slightly better fit to the data than the less constrained model. Although somewhat counterintuitive at first glance, this can occur in cases where there is a strong degree of invariance in the parameters that were constrained to be equal and the more constrained model has more degrees of freedom than the less constrained model. Thus, if the parameters that were constrained to be equal were, indeed, nearly equal across groups in the unconstrained model, the additional degrees of freedom can actually yield a better fit for the more constrained model.
It is also worth noting that, in both groups, reliability analyses showed good internal consistency for the rumination and helplessness factors and sufficient internal consistency for the magnification factor. The somewhat lower estimate for magnification is most likely due to its small number of items (three) because Cronbach’s alpha is dependent on both number of items and item relatedness. Moreover, there was excellent internal consistency for the total PCS score, which is consistent with the fact that the factors were correlated (Figure 2). All of these results are in line with previous findings from other samples.16
Implications
Pain catastrophizing is an important psychological construct used to predict pain experience and pain outcomes.6–11 Indeed, persons who catastrophize more report more pain, show more pain behaviors, use more analgesics, have longer hospital stays, take longer to rehabilitate, have more pain-related disability, and show greater brain activation in response to painful stimulation.8–11 Unfortunately, the mechanisms by which pain catastrophizing increases pain are currently poorly understood; however, accumulating evidence suggests they involve supraspinal processes (eg, attention deployment, salience detection, amplification of activity in pain-related brain regions), rather than activation of descending facilitatory pain controls.28,29
Because NAs have a higher prevalence of pain symptoms and pain conditions than other US ethnic/racial groups,5 investigating the contribution of psychological variables, especially pain catastrophizing, is highly relevant. In fact, given that the current study established the measurement invariance of the PCS across NAs and NHWs, the PCS was used in subsequent analyses to examine racial/ethnic differences in catastrophic thoughts in response to painful stimuli.30 Those analyses found that NAs were more likely than NHWs to report catastrophizing in reaction to painful laboratory tasks involving heat, cold, and ischemic stimuli. Given that pain catastrophizing is associated with pain amplification and greater pain-related suffering, greater pain catastrophizing in NAs could represent a health disparity in and of itself, and could partly explain the higher prevalence of chronic pain in the NA population. Specifically, a greater tendency to engage in catastrophic thinking could prompt a vicious cycle that promotes and maintains pain (ie, pain→catastrophizing→pain), much like what has been described by the fear-avoidance model.31 So, by demonstrating that group differences on the PCS can be attributed to differences in pain catastrophizing (rather than measurement variability), the current study is an important foundation for reducing the pain disparity in NAs. The next step forward could involve employing interventions to reduce catastrophic thinking [eg,32–33] in otherwise healthy, pain-free NAs, with the hopes of reducing the number of people that transition to chronic pain. The present results indicate that the PCS could also be used to monitor the effectiveness of such an intervention in NAs.
Limitations
Although this study had a number of strengths, a few limitations should be noted. The sample was comprised of healthy, pain-free participants. This likely resulted in lower variability and mean levels of some of the PCS items than would have been found in a chronic pain population. However, we do not believe this negatively impacted our results given they replicate prior studies of the factor structure of the PCS in both healthy, pain-free and clinical populations. Nonetheless, our results should be replicated in future studies. Moreover, recruitment was limited geographically to the northeastern part of Oklahoma; thus, most NAs in the sample did not live on reservations. Additionally, there were more females in the NA sample than the NHW sample. Thus, future studies are needed to determine if findings generalize to NA men and women from other regions who experience chronic pain.
Conclusions
In sum, this study demonstrates that the PCS is a valid instrument for investigating differences in pain catastrophizing and its relationship to pain outcomes in NAs and NHWs. Given that the PCS has also been shown to be invariant across chronic pain and pain-free samples that were non-NA,15 the PCS may also be suitable for investigating pain catastrophizing in NAs suffering from pain conditions. However, this needs to be empirically verified.
Ethical Approval
All procedures performed in studies involving human participants were in accordance with the ethical standards of the institutional and/or national research committee and with the 1964 Helsinki declaration and its later amendments or comparable ethical standards.
Informed Consent
Informed consent was obtained from all individual participants included in the study.
Acknowledgments
The authors would like to thank Heather B. Coleman, Kathryn A. Thompson, Jessica M. Fisher, Samuel P. Herbig, Ky’Lee B. Barnoski, Garrett Newsom, and Lucinda Chee for their help with data collection. This research was supported by the National Institute on Minority Health and Health Disparities of the National Institute of Health under Award Number R01MD007807. Edward Lannon, Shreela Palit, and Yvette Güereca were supported by a National Science Foundation Graduate Research Fellowship Program. The content is solely the responsibility of the authors and does not necessarily reflect the views of the National Institutes of Health, National Science Foundation, Indian Health Service, or the Cherokee Nation.
Disclosure
Jamie L Rhudy, Felicitas A Huber, Edward W Lannon, Bethany L Kuhn, Shreela Palit, Michael F Payne, Cassandra A Sturycz, Natalie Hellman, Tyler A Toledo and Joanna O Shadlow report support from a grant from NIH/NIMHD during the conduct of the study. The authors report no other conflicts of interest in this work.
Funding
This research was supported by the National Institute on Minority Health and Health Disparities of the National Institute of Health under Award Number R01MD007807. Edward Lannon, Shreela Palit, and Yvette Güereca were supported by a National Science Foundation Graduate Research Fellowship Program.
References
1. Kim HJ, Yang GS, Greenspan JD, et al. Racial and ethnic differences in experimental pain sensitivity: systematic review and meta-analysis. Pain. 2017;158(2):194–211. doi:10.1097/j.pain.0000000000000731
2. Rahim-Williams B, Riley JL
3. USDHHS. Summary of Health Statistics for U.S. Adults: National Health Interview Survey, 2009. Services HaH, editor. Hyattsville, Maryland: DHHS;2010.
4. Barnes PM, Adams PF, Powell-Griner E. 2010. Health Characteristics of the American Indian or Alaska Native Adult Population: United States, 2004–2008. USDHHS, editor. Hyattesville, MD: National Center for Health Statistics.
5. Jimenez N, Garroutte E, Kundu A, Morales L, Buchwald D. A review of the experience, epidemiology, and management of pain among American Indian, Alaska Native, and Aboriginal Canadian Peoples. J Pain. 2011;12(5):511–522. doi:10.1016/j.jpain.2010.12.002
6. Quartana PJ, Campbell CM, Edwards RR. Pain catastrophizing: a critical review. Expert Rev Neurother. 2009;9(5):745–758. doi:10.1586/ern.09.34
7. Keefe FJ, Brown GK, Wallston KA, Caldwell DS. Coping with rheumatoid arthritis pain: catastrophizing as a maladaptive strategy. Pain. 1989;37(1):51–56. doi:10.1016/0304-3959(89)90152-8
8. Sullivan MJ, Thorn B, Haythornthwaite JA, et al. Theoretical perspectives on the relation between catastrophizing and pain. Clin J Pain. 2001;17(1):52–64. doi:10.1097/00002508-200103000-00008
9. Keefe FJ, Rumble ME, Scipio CD, Giordano LA, Perri LM. Psychological aspects of persistent pain: current state of the science. J Pain. 2004;5(4):195–211. doi:10.1016/j.jpain.2004.02.576
10. Seminowicz DA, Davis KD. Cortical responses to pain in healthy individuals depends on pain catastrophizing. Pain. 2006;120(3):297–306. doi:10.1016/j.pain.2005.11.008
11. Gracely RH, Geisser ME, Giesecke T, et al. Pain catastrophizing and neural responses to pain among persons with fibromyalgia. Brain. 2004;127(4):835–843.
12. Rosenstiel AK, Keefe FJ. The use of coping strategies in chronic low back pain patients: relationship to patient characteristics and current adjustment. Pain. 1983;17(1):33–44. doi:10.1016/0304-3959(83)90125-2
13. Sullivan MJL, Bishop SR, Pivik J. The pain catastrophizing scale: development and validation. Psychol Assess. 1995;7(4):524–532. doi:10.1037/1040-3590.7.4.524
14. Osman A, Barrios FX, Kopper BA, Hauptmann W, Jones J, O’Neill E. Factor structure, reliability, and validity of the pain catastrophizing scale. J Behav Med. 1997;20(6):589–605. doi:10.1023/A:1025570508954
15. Van Damme S, Crombez G, Bijttebier P, Goubert L, Van Houdenhove B. A confirmatory factor analysis of the pain catastrophizing scale: invariant factor structure across clinical and non-clinical populations. Pain. 2002;96(3):319–324. doi:10.1016/S0304-3959(01)00463-8
16. D’Eon JL, Harris CA, Ellis JA. Testing factorial validity and gender invariance of the pain catastrophizing scale. J Behav Med. 2004;27(4):361–372. doi:10.1023/B:JOBM.0000042410.34535.64
17. Ehrhardt MD, Gray KN, Kuhn BL, et al. A qualitative analysis of pain meaning: results from the Oklahoma Study of Native American Pain Risk (OK-SNAP). J Pain. 2019;20(4):S22. doi:10.1016/j.jpain.2019.01.105
18. Bebbington PE, Nayani T. The psychosis screening questionnaire. Int J Methods Psychiatr Res. 1995;5:11–19.
19. Kline RB. Structural Equation Modeling. New York, NY: The Guilford Press; 1998.
20. Muthén LK, Muthén BO. Mplus User’s Guide: Eighth Edition. Los Angeles, CA: Muthén & Muthén; 2017.
21. Brown TA. Confirmatory Factor Analysis for Applied Research. Guilford Publications; 2014.
22. Browne MW, Cudeck R. Alternative ways of assessing model fit. In: Bollen KA, Long JS, editors. Testing Structural Equation Models. Newbury Park, CA: Sage; 1993:136–162.
23. Byrne BM, Stewart SM, Kennard BD, Lee PW. The beck depression inventory-II: testing for measurement equivalence and factor mean differences across Hong Kong and American adolescents. Int J Test. 2007;7(3):293–309. doi:10.1080/15305050701438058
24. Chen FF. Sensitivity of goodness of fit indexes to lack of measurement invariance. Struct Equ Modeling. 2007;14(3):464–504. doi:10.1080/10705510701301834
25. Cheung GW, Rensvold RB. Evaluating goodness-of-fit indexes for testing measurement invariance. Struct Equ Modeling. 2002;9(2):233–255. doi:10.1207/S15328007SEM0902_5
26. Byrne BM, Shavelson RJ, Muthén B. Testing for the equivalence of factor covariance and mean structures: the issue of partial measurement invariance. Psychol Bull. 1989;105(3):456. doi:10.1037/0033-2909.105.3.456
27. Reise SP, Widaman KF, Pugh RH. Confirmatory factor analysis and item response theory: two approaches for exploring measurement invariance. Psychol Bull. 1993;114(3):552. doi:10.1037/0033-2909.114.3.552
28. Galambos A, Szabó E, Nagy Z, et al. A systematic review of structural and functional MRI studies on pain catastrophizing. J Pain Res. 2019;12:1155. doi:10.2147/JPR.S192246
29. Terry EL, Thompson KA, Rhudy JL. Experimental reduction of pain catastrophizing modulates pain report but not spinal nociception as verified by mediation analyses. Pain. 2015;156:1477–1488. doi:10.1097/j.pain.0000000000000192
30. Rhudy JL, Lannon EW, Kuhn BL, et al. Sensory, affective, and catastrophizing reactions to multiple stimulus modalities: results from the Oklahoma Study of Native American Pain Risk. J Pain. 2019;20(8):965–979. doi:10.1016/j.jpain.2019.02.009
31. Vlaeyen JWS, Linton SJ. Fear-avoidance and its consequences in chronic musculoskeletal pain: a state of the art. Pain. 2000;85(3):317–332. doi:10.1016/S0304-3959(99)00242-0
32. Keefe FJ, Caldwell DS, Williams DA, et al. Pain coping skills training in the management of osteoarthritic knee pain: a comparative study. Behav Ther. 1990;21(1):49–62. doi:10.1016/S0005-7894(05)80188-1
33. Jensen MP, Turner JA, Romano JM. Changes in beliefs, catastrophizing, and coping are associated with improvement in multidisciplinary pain treatment. J Consult Clin Psychol. 2001;69(4):655–662. doi:10.1037/0022-006X.69.4.655
 © 2020 The Author(s). This work is published and licensed by Dove Medical Press Limited. The full terms of this license are available at https://www.dovepress.com/terms.php and incorporate the Creative Commons Attribution - Non Commercial (unported, v3.0) License.
By accessing the work you hereby accept the Terms. Non-commercial uses of the work are permitted without any further permission from Dove Medical Press Limited, provided the work is properly attributed. For permission for commercial use of this work, please see paragraphs 4.2 and 5 of our Terms.
© 2020 The Author(s). This work is published and licensed by Dove Medical Press Limited. The full terms of this license are available at https://www.dovepress.com/terms.php and incorporate the Creative Commons Attribution - Non Commercial (unported, v3.0) License.
By accessing the work you hereby accept the Terms. Non-commercial uses of the work are permitted without any further permission from Dove Medical Press Limited, provided the work is properly attributed. For permission for commercial use of this work, please see paragraphs 4.2 and 5 of our Terms.