Back to Journals » Eye and Brain » Volume 13
Evaluation of Retinal Layer Thickness Parameters as Biomarkers in a Real-World Multiple Sclerosis Cohort
Authors Schurz N, Sariaslani L, Altmann P, Leutmezer F, Mitsch C, Pemp B ![]() , Rommer P, Zrzavy T, Berger T
, Rommer P, Zrzavy T, Berger T ![]() , Bsteh G
, Bsteh G ![]()
Received 9 December 2020
Accepted for publication 17 February 2021
Published 12 March 2021 Volume 2021:13 Pages 59—69
DOI https://doi.org/10.2147/EB.S295610
Checked for plagiarism Yes
Review by Single anonymous peer review
Peer reviewer comments 5
Editor who approved publication: Professor Margaret Wong-Riley
Natascha Schurz,1,* Lydia Sariaslani,1,* Patrick Altmann,1 Fritz Leutmezer,1 Christoph Mitsch,2 Berthold Pemp,2 Paulus Rommer,1 Tobias Zrzavy,1 Thomas Berger,1 Gabriel Bsteh1
1Department of Neurology, Medical University of Vienna, Vienna, Austria; 2Department of Ophthalmology, Medical University of Vienna, Vienna, Austria
*These authors contributed equally to this work
Correspondence: Gabriel Bsteh
Medical University of Vienna, Waehringer Guertel 18-20, Vienna, 1090, Austria
Tel +43 1 40400 31450
Email [email protected]
Purpose: Retinal layer thickness parameters measured by optical coherence tomography (OCT) are emerging biomarkers of neuroaxonal degeneration and inflammation in multiple sclerosis (MS). We aimed to evaluate the value of retinal layer thickness for prediction of disability worsening and relapse in a real-world MS cohort.
Patients and Methods: For this longitudinal observational study, we included MS patients with spectral-domain OCT scans available and ≥ 1 year of clinical follow-up. The value of peripapillary retinal nerve fiber layer (pRNFL), macular ganglion-cell-and-inner-plexiform-layer (GCIPL) and inner nuclear layer (INL) thickness for prediction of disability worsening and relapse during the observation period was tested by multivariate models.
Results: We analyzed 60 MS patients during a mean observation period of 2.9 years (SD 1.8). Lower baseline thickness of GCIPL (cut-off < 77μm; HR 4.1, p=0.001) and pRNFL (cut-off ≤ 88μm; HR 3.1, p=0.019) were associated with an increased risk of disability worsening. Longitudinally, mean thinning rates were − 0.8μm/year (SD 1.6) for GCIPL, − 0.6μm/year (SD 3.5) for pRNFL. GCIPL thinning ≥ 1.0μm/year and pRNFL > 1.5μm/year is associated with higher likelihood of disability worsening (HR 5.7, p=0.009 and HR 6.8, p=0.003, respectively). INL thickened in patients with relapse by a mean 0.9μm while thinning by 0.3μm in patients without relapse (p=0.04). In multivariate analyses, INL thickening was associated with an increased probability of relapse (OR 17.8, p=0.023).
Conclusion: Cross-sectional and longitudinal measurement of GCIPL and pRNFL thinning is reliable as a biomarker of disability worsening in a real-world setting. Change of INL thickness is a promising marker of relapse, i.e. inflammatory activity.
Keywords: multiple sclerosis, biomarker, optical coherence tomography, retinal thinning, progression, relapse
Plain Language Summary
Thicknesses of different layers within the retina can be easily measured by optical coherence tomography (OCT). These layer thicknesses have emerged as biomarkers of neuroaxonal degeneration and inflammation in multiple sclerosis (MS). In this study, we wanted to test whether retinal layer thickness is helpful for predicting clinical events (disability worsening and relapse) in a real-world cohort of MS patients. In a longitudinal observational study, we measured thicknesses of peripapillary retinal nerve fiber layer (pRNFL), macular ganglion-cell-and-inner-plexiform-layer (GCIPL) and inner nuclear layer (INL). In multivariate models, we tested whether these parameters were associated with disability worsening and relapse during the observation period. In a cohort of 60 MS patients followed for about three years, we found that patients with a GCIPL thickness below 77µm or a pRNFL below 88µm at the beginning of the study had a 3–4fold increased risk of disability worsening. When patients had GCIPL thinning exceeding 1µm per year or pRNFL thinning above 1.5µm per year, the risk for disability worsening increased 6fold. An INL thickening indicated an increased probability of relapse. Our study shows that both crossectional and longitudinal measurement of GCIPL and pRNFL thinning is reliable as a biomarker of disability worsening in a real-world setting. Conversely, INL thickening is a promising marker of relapse.
Introduction
Multiple sclerosis (MS) is characterized by a highly heterogeneous disease course on an individual level.1 The current pathophysiological concept of MS encompasses a disease process that involves both inflammatory and neurodegenerative components. While the inflammatory component is deemed predominant in the early phase of disease, neurodegenerative processes prevail in the later progressive phase.2 However, this should not be viewed as a strict dichotomy but rather a largely overlapping continuum: neuroaxonal damage is already occurring in very early stages, and, while clinically often silent, its extent determines long-term prognosis.2
With an ever-growing arsenal of disease-modifying treatment (DMT) options with different levels of efficacy available, reliable biomarkers reflecting subclinical processes are paramount for both determining the necessary level of efficacy and enabling early adaption of treatment.3
Optical coherence tomography (OCT) enables non-invasive, inexpensive, well-tolerated high-resolution in-vivo imaging of distinct layers of the retina with excellent reproducibility.4 Peripapillary retinal nerve fiber layer (pRNFL) and macular ganglion-cell-and-inner-plexiform-layer (GCIPL) thinning have been established as markers of neuroaxonal degeneration in MS.4 Cross-sectionally determined pRNFL thickness ≤88μm and GCIPL thickness <70–77µm are associated with an increased risk of disability worsening within subsequent years.5–9 Measured longitudinally, pRNFL and GCIPL were shown to thin in absence of acute optic neuritis (ON) correlating strongly with global brain atrophy.10,11 Loss of GCIPL and pRNFL exceeding −1.0µm and −1.5μm per year, respectively, were reported to be associated with physical and cognitive disability worsening.9–12
Changes in another retinal layer, the inner nuclear layer (INL), have been repeatedly suggested as a marker of inflammatory activity in MS. Thickening of the INL is associated with occurrence of relapses and new T2 hyperintense lesions on brain magnetic resonance imaging (MRI).13–17 Conversely, INL volume is decreasing in patients successfully treated with DMT.14–17 Thus, it was hypothesized that INL thickening might reflect a proinflammatory state within the brain.17
However, these studies have been conducted in observational cohorts with strict protocols and multiple OCT scans per patient used for determination of thinning rates not necessarily resembling resource availability in real-world circumstances. Therefore, in this study, we aimed to evaluate the value of retinal layer thickness for prediction of disability worsening and relapse in a real-world MS cohort.
Patients and Methods
Patients and Definitions
The dataset was drawn from the Vienna MS database (VMSD), which is established at the MS Clinic of the Department of Neurology, Medical University of Vienna, serving as both primary and reference centre mainly for Vienna and its geographical catchment area. By July 2020, a cohort of 1331 MS patients diagnosed according to respective McDonald criteria had been included.18–20 VMSD case reports include demographic data, details of MS course (disease onset, time to diagnosis, relapses, Expanded Disability Status Scale [EDSS] and onset of secondary progression), diagnostic investigations (MRI, OCT, cerebrospinal fluid findings) and DMT history (including initiation, interruption, changes and adverse effects). Data are collected retrospectively at first visit and prospectively whenever the patient returns for scheduled (every 3–6 months) follow-up or unscheduled visits.
This study was designed as a retrospective analysis of this cohort with disability worsening (ie, EDSS progression) as the a-priori primary outcome measure. We included MS patients aged >18 years at onset with OCT scans available and ≥1 year of clinical follow-up. Patients with a history of unilateral optic neuritis (ON) <6 months before baseline were excluded from the study. The detailed inclusion process is depicted in Figure 1.
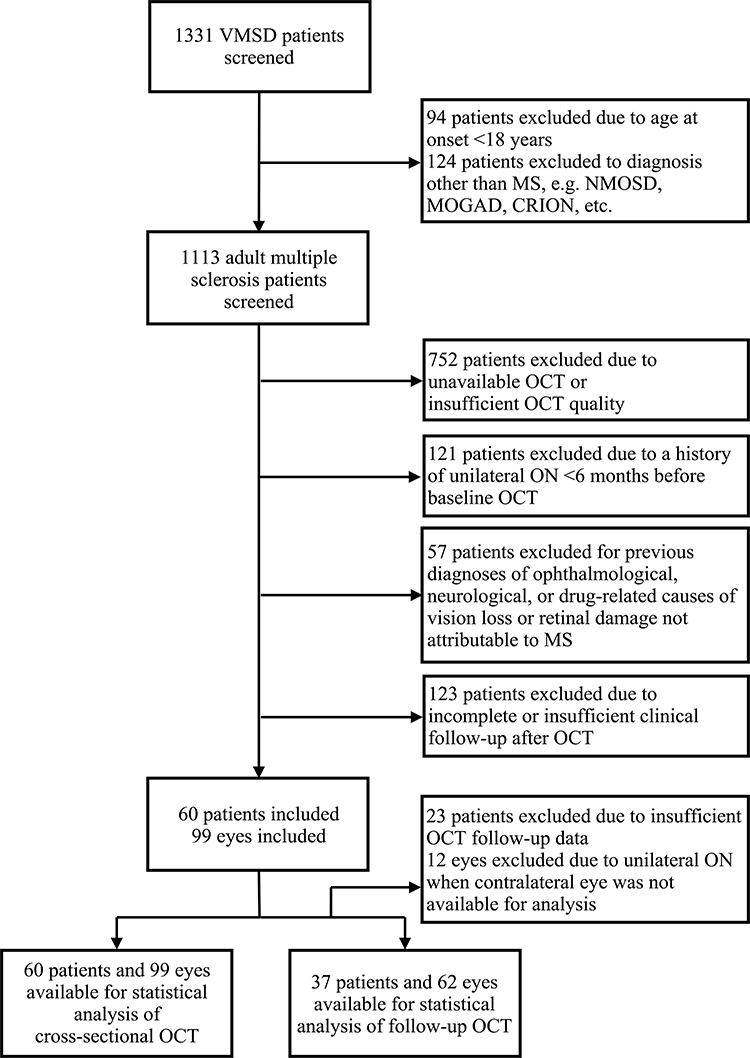 |
Figure 1 Patient inclusion flow chart. Abbreviations: CRION, chronic relapsing idiopathic optic neuritis; MS, multiple sclerosis; MOGAD, myelin oligodendrocyte glycoprotein antibody disorder; NMOSD, neuromyelitis optica spectrum disorder; OCT, optical coherence tomography; ON, optic neuritis; VMSD, Vienna MS Database. |
Disability worsening was defined as a confirmed EDSS increase of ≥1.5 point when the baseline score was 0, ≥1.0 point when the baseline score was 1–5.5, or ≥0.5 points when the baseline score was >5.5, sustained for at least 3 months as compared to baseline.2 A relapse was defined as patient-reported symptoms or objectively observed signs typical of an acute CNS inflammatory demyelinating event, current or prior to the visit, with a duration of at least 24 hours in the absence of fever or infection, separated from the last relapse by at least 30 days.20 DMT status during the observation period was classified as: 1) “no DMT” (N-DMT) defined as patients receiving no DMT at least 6 months prior to baseline visit and during the whole observation period, 2) “moderately effective DMT” (M-DMT) defined as patients receiving one or more DMT of either interferon-beta preparations, glatiramer acetate, dimethyl fumarate, and teriflunomide during the whole observation period, 3) “highly effective DMT” (H-DMT) defined as patients receiving one or more DMT of either natalizumab, fingolimod, alemtuzumab, antiCD-20 monoclonal antibodies and cladribine during the whole observation period, and 4) “ESC-DMT” defined as patients in whom DMT was escalated either from no DMT to moderately effective DMT or from moderately effective DMT to highly effective DMT during the observation period.
OCT
Spectral-domain OCT imaging (Spectralis OCT, Heidelberg Engineering, Heidelberg, Germany; software version 6.9a) was performed by experienced examiners without pupil dilatation on both eyes of each patient. For pRNFL measurement, a 12° (3.4 mm) ring scan centered on the optic nerve head was used (1536 A-scans, automatic real-time tracking [ART]: 100 averaged frames). For GCIPL and INL measurement, a 20°×20° macular volume scan (High-resolution [HS] mode; 512 A-scans, 25 B-scans, vertical alignment, ART: 16 averaged frames) centered on the fovea was performed. GCIPL and INL thicknesses were defined as the mean layer thickness of the four inner and four outer quadrants of the circular grid centered around the foveola corresponding to the 3mm and 6mm rings as defined by the Early Treatment Diabetic Retinopathy Study.21 Semiautomated image processing was conducted using the built-in proprietary software for automated layer segmentation with manual correction of obvious errors. All examinations were checked for sufficient quality using OSCAR-IB criteria.22,23 Thicknesses of pRNFL, GCIPL and INL were calculated as the mean of the values for both eyes. If a follow-up OCT was available at least 12 months after the first scan, annualized thinning rates of pRNFL (annualized loss of pRNFL = aLpRNFL) and GCIPL (aLGCIPL) were determined as the difference between baseline scan and the follow-up scan divided by the time between baseline scan and follow-up scan. Change of INL (CINL) was defined as the difference between baseline scan and follow-up scan.
Eyes with a history of ON more timely distant (>6 months) were excluded from the analysis regarding predictive value of cross-sectional measurement but not from the analyses of longitudinal layer thinning as further retinal thinning does not differ between eyes with and without a history of ON.24 Eyes suffering ON during the observation period were excluded from the study and only the values of eyes without ON during the observation period were used for calculation of retinal thinning in the analyses.5,6,9,12 To identify subclinical ON at baseline, we used interocular asymmetry with cut-off values of ≥5µm for pRNFL and ≥4µm for GCIPL.25,26 To identify subclinical ON during the course of the study, we used interocular asymmetry in retinal thinning (ie, inter-eye difference in pRNFL or GCIPL thickness reduction compared to the prior OCT) with cut-off values of ≥5µm for pRNFL and ≥4µm for GCIPL. In these cases, we used only the eye with the higher value. Other exclusion criteria were previous diagnoses of ophthalmological (ie, myopia greater than −4 diopters, optic disc drusen), neurological, or drug-related causes of vision loss or retinal damage not attributable to MS criteria.22,23 The investigators performing the OCT were blinded to clinical parameters and vice versa.
Ethics
The study was conducted in accordance with the Declaration of Helsinki and approved by the ethics committee of the Medical University Vienna (ethical approval number: 2356+2360/2019). As this was a retrospective study of anonymized data obtained in clinical routine, the requirement for informed consent was waived by decision of the ethics committee of the Medical University Vienna.
Statistics
Statistical analysis was performed using SPSS 26.0 (SPSS Inc, Chicago, IL, USA) and R-Statistical Software (Version 4.0.0). Univariate group comparisons were done by Chi-square-test, Mann–Whitney U-test or independent t-test (with Welch’s correction in case of unequal standard deviations between the groups) as appropriate. Univariate correlations were analyzed by Pearson or Spearman test as appropriate.
For evaluating the predictive value of cross-sectional retinal layer thicknesses regarding disability worsening, we performed proportional hazards models including only retinal layer thicknesses to calculate unadjusted hazard ratios (HRs) and generated Kaplan-Meier plots of cumulative incidence of disability worsening during follow-up according to previously reported cut-off values for pRNFL (≤88µm) and GCIPL (<77µm). As there are no established cut-offs for INL and the relation between OCT-parameters and clinical outcomes is non-linear, we used percentile-based categories comparing the risk for disability worsening in the lowest tertile of INL thickness versus above the lowest tertile.5,6,9 Then, we performed multivariate cox regression models with time to disability worsening as the dependent variable and retinal layer thickness tertiles as the independent variable, adjusting for sex, age, disease course, disease duration, EDSS at baseline and DMT status during the observation period. The same set-up was used regarding occurrence of relapse as an outcome variable.
For analyzing the association of longitudinal retinal layer thinning with disability worsening, we conducted proportional hazards models, Kaplan-Meier plots and multivariate cox regression models using previously reported cut-offs of aLpRNFL (≤1.5µm) and aLGCIPL (<1.0µm). Regarding CINL, we compared INL thickening (ie, positive CINL) and INL thinning (ie, negative CINL) by a multivariate logistic regression model with relapse activity as the dependent variable adjusting for sex, age, disease course, disease duration, relapse before baseline and DMT status.
We tested all variables for normal distribution by Lilliefors-test and for collinearity by variance inflation factor (VIF) and excluded all variables from the regression analysis if the VIF was >2.0 corresponding to an R2 of 0.60. Missing values were handled by multiple (20 times) imputation using the missing not at random (MNAR) approach with pooling of estimates according to Rubin’s rules.27 A two-sided p-value <0.05 was considered statistically significant.
Results
Characteristics of the study cohort at baseline are given in Table 1. During a mean observation period of 2.9 years (SD 1.8), an EDSS progression occurred in 24 patients (40.0%) after a mean of 3.8 years (SD 2.3) and 41 patients (68.3%) had at least one relapse (range: 0–5). Median EDSS at the end of the observation period was 1.5 (range: 0–7.0).
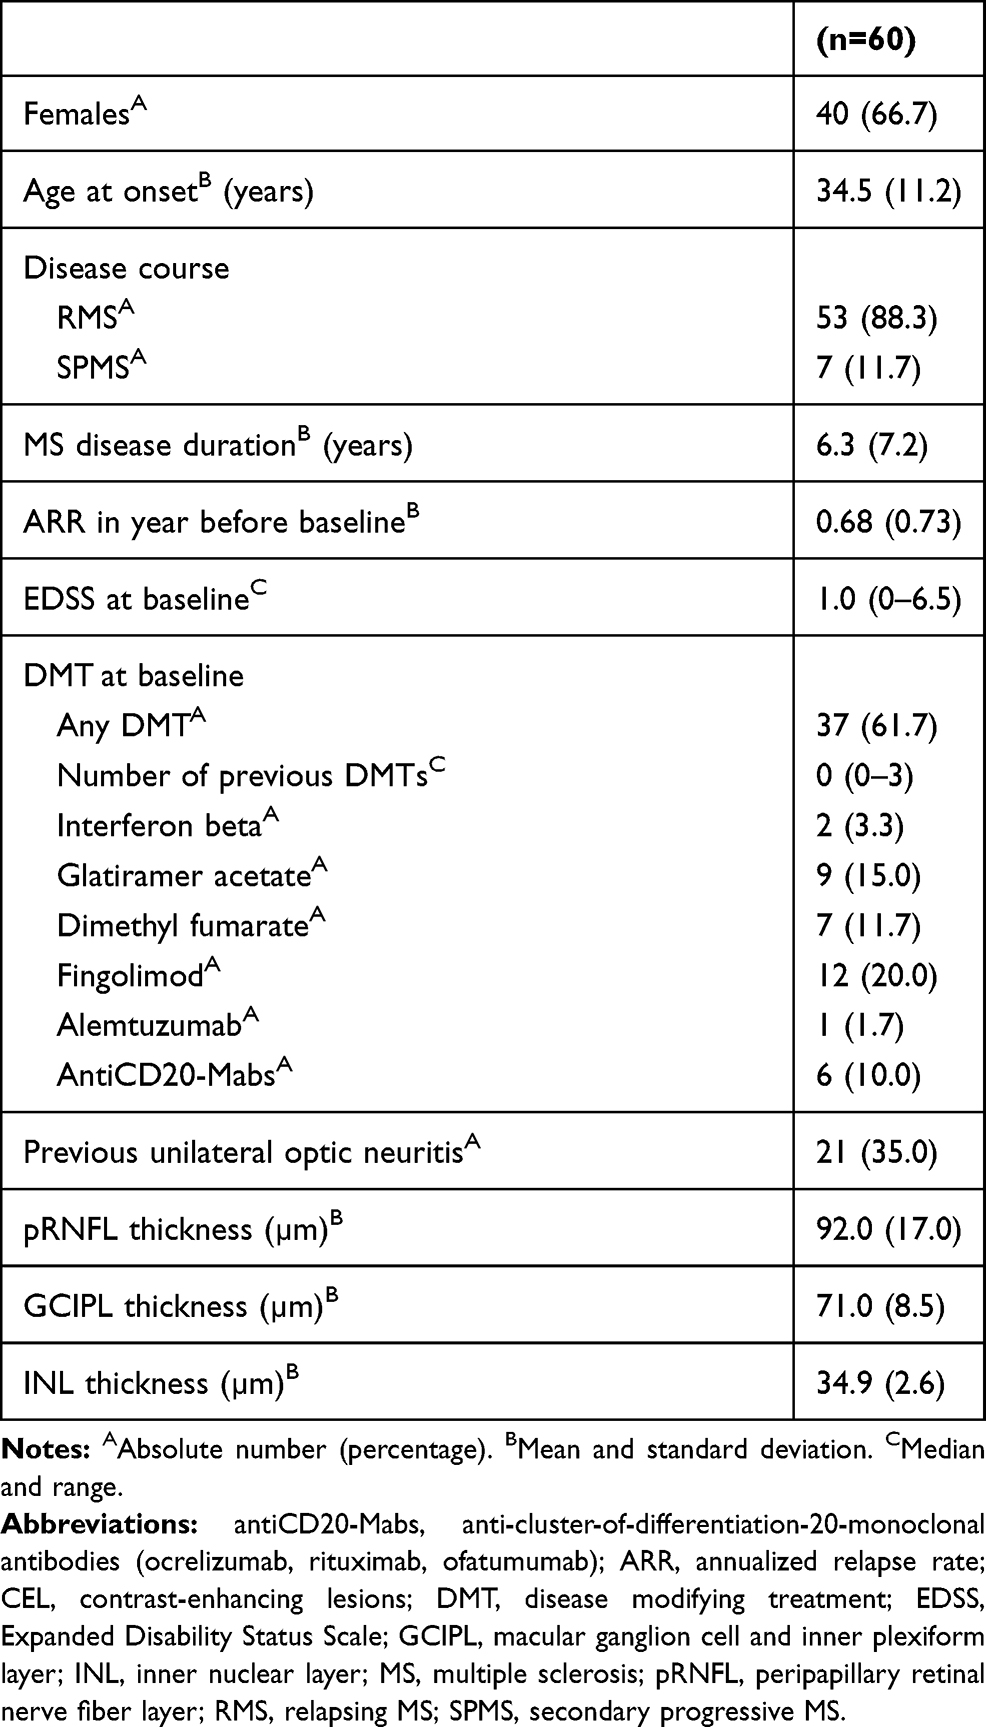 |
Table 1 Cohort Characteristics |
In the overall cohort, mean pRNFL thickness was 92.0µm (SD 17.0), mean GCIPL thickness was 74.8µm (SD 8.7) and mean INL thickness was 34.9 µm (SD 2.6). There was no significant difference in pRNFL, GCIPL or INL between patients in whom both eyes were used for measuring retinal layer thickness compared to patients where only one eye was used because the fellow eye had previous ON. The lowest tertile for INL thickness was set at 34µm.
Low RNFL and GCIPL Thickness at Baseline Predict Disability Worsening, INL Does Not
In patients with disability worsening, we found significantly reduced thickness of pRNFL (83.4µm vs 97.7µm, p=0.001) and GCIPL (69.3µm vs 78.2µm, p<0.001), but not INL (34.7 vs 35.0, p=0.672), compared to the stable group. There were no significant differences in retinal layer thickness between patients with and without relapse activity (Supplemental Table 1).
Disability worsening was observed more frequently in patients below the pRNFL (65.2% vs 24.3%, p=0.003) and GCIPL cut-offs (58.6% vs 20.0%, p=0.003). INL thickness in the lowest tertile was not associated with disability worsening. Neither of the retinal thickness cut-off values was associated with occurrence of relapse during follow-up.
In the multivariate cox proportional hazard model, GCIPL thickness <77μm at baseline was associated with a 4-fold increased risk (adjusted HR 4.1; 95% CI 1.7–10.0; p=0.001) of disability worsening during the observation period (Figure 2A). Thickness of pRNFL ≤88μm displayed a slightly weaker but still significant association with risk of disability worsening (HR 3.1; 95% CI 1.4–7.0; p=0.019, Figure 2B). INL thickness did not predict disability worsening.
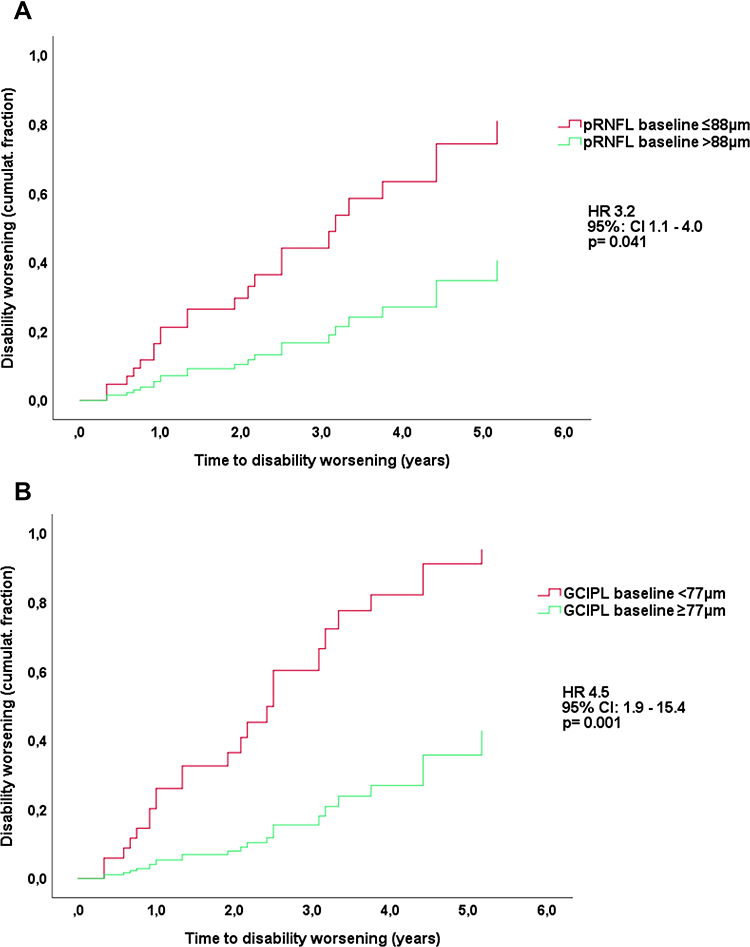 |
Figure 2 Risk of disability worsening according to pRNFL (Panel (A)) and GCIPL (B) at baseline. Abbreviations: DMT, disease-modifying treatment; EDSS, expanded disability status scale; GCIPL, ganglion cell and inner plexiform layer; pRNFL, peripapillary retinal nerve fiber layer; HR, hazard ratio. Notes: HR and 95% confidence intervals calculated by multivariate Cox regression models adjusting for sex, age, disease course, disease duration, EDSS at baseline and DMT status. Number of patients at risk: baseline: 60; year 1: 52; year 2: 33; year 3: 19; year 4: 13; year 5: 7. |
RNFL and GCIPL Thinning is Associated with Disability Worsening
In the 37 patients available for longitudinal analysis with a mean 34 months (SD 21) between OCT scans, mean aLpRNFL was −0.6µm/year (SD 3.5) and mean aLGCIPL was −0.8µm/year (SD 1.6). Patients with disability worsening (n=18) displayed significantly higher mean aLGCIPL (−1.7μm/year, SD 1.7) and aLpRNFL as compared to stable patients (−0.2μm [SD 0.7] and 0.9μm [SD 2.3], p<0.001 and p=0.012, respectively, see Figure 3A). Rates of pRNFL and GCIPL thinning did not significantly differ according to relapse activity (Figure 3B).
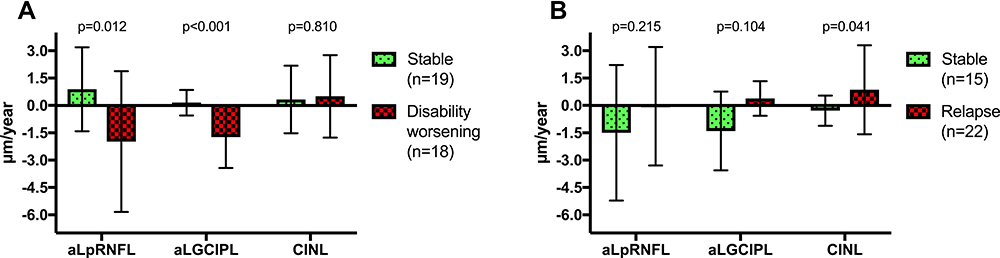 |
Figure 3 Differences in annualized thinning of pRNFL (aLpRNFL), GCIPL (aLGCIPL) and change in INL according to disability worsening (Panel (A)) and relapse activity (B). Abbreviations: DMT, disease modifying treatment; GCIPL, ganglion cell and inner plexiform layer; INL, inner nuclear layer; pRNFL, peripapillary retinal nerve fiber layer; aLGCIPL, annualized loss of ganglion cell and inner plexiform layer; aLpRNFL, annualized loss of peripapillary retinal nerve fibre layer; CINL, change of inner nuclear layer. Note: p-values calculated by multiple-comparison-ANOVA. |
We found disability worsening significantly more often in patients exceeding the aLpRNFL (90% vs 36%, p<0.001) and aLGCIPL cut-offs (92.3% vs 26.1%, p<0.001).
In the multivariate Cox model, both aLGCIPL ≥1.0µm (adj. HR 6.8; 95% CI 1.9–23.7; p=0.003) and aLpRNFL >1.5µm/year (adj. HR 5.7; 95% CI 1.6–21.0; p=0.009) were associated with an increased risk for disability worsening (see Figure 4A and B).
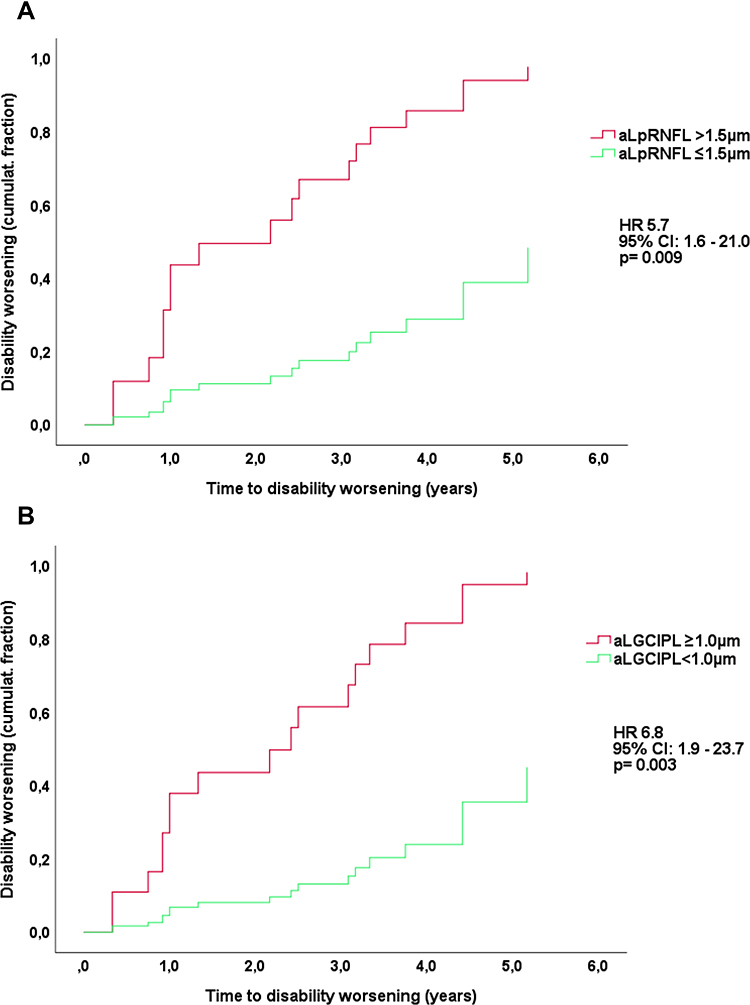 |
Figure 4 Risk of disability worsening according to aLpRNFL (Panel (A)) and aLGCIPL (B). Abbreviations: aLGCIPL, annualized loss of ganglion cell and inner plexiform layer thickness; aLpRNFL, annualized loss of peripapillary retinal nerve fiber layer thickness; DMT, disease-modifying treatment; EDSS, expanded disability status scale; HR, hazard ratio. Notes: HR and 95% confidence interval calculated by multivariate Cox regression models adjusting for sex, age, disease course, disease duration, EDSS at baseline and DMT status. Number of patients at risk: baseline: 37; year 1: 30; year 2: 24; year 3: 16; year 4: 12; year 5: 6. |
There were no divergencies regarding the influence of sex, age at baseline or disease duration on aLpRNFL and aLGCIPL, nor between patients with and without ON prior to baseline.
Change of INL is Associated with Relapse Activity
Overall, mean change of INL (CINL) was 0.4µm (SD 2.0). CINL positively correlated with the number of relapses during follow-up (r=0.417, p<0.001). INL thickness increased in patients with at least one relapse during follow-up (n=22) by a mean 0.9µm (SD 2.4), whereas it decreased by a mean 0.3µm (SD 0.8µm, p=0.04) in patients without relapse (Figure 3B). Sixteen of 21 (76.2%) patients displaying an INL thickening (ie, positive CINL) had a relapse compared to 6/15 (40%, p=0.041) patients with an INL thinning (ie, negative CINL). CINL was not significantly different according to disability worsening (Figure 3A).
The multivariate logistic model (Nagelkerke R2 0.570, p=0.012) indicated a significant increase in the probability of relapse associated with INL thickening (odds ratio 17.8; 95% CI 1.5–211; p=0.023).
Discussion
In this study, we aimed to evaluate the value of retinal layer thickness for prediction of disability worsening in a real-world MS cohort.
There are three key results from our study: in MS patients i) cross-sectionally determined pRNFL (cut-off ≤88µm) and GCIPL thickness (cut-off <77µm) at baseline are predictive of a 3-4-fold increased risk (HR 3.1 and 4.1, respectively) of disability worsening within subsequent years, ii) longitudinally measured thinning of aLpRNFL (cut-off >1.5µm/year) and aLGCIPL (cut-off ≥1.0µm/year) is associated with higher likelihood of disability worsening (HR 5.7 and 6.8, respectively), and iii) INL thickness significantly increased in patients with relapse (by a mean 0.9µm), whereas it decreased (by a mean 0.3µm) in patients without relapse. INL thickening is associated with an increased probability of relapse (OR 17.8, p=0.023).
Pathophysiologically, thinning of GCIPL and pRNFL in MS is hypothesized to be caused by retrograde transsynaptic axonal degeneration mirroring MS-associated neuroaxonal loss (Dinkin 2017). This is emphasized by robust and repeatedly shown associations with physical and cognitive disability worsening as well as brain atrophy.4–11,28–30 Our findings are generally in line with results from previous studies in MS regarding the prognostic value of cross-sectional pRNFL and GCIPL measurement.4–9,29,30 Of note, the cross-sectional pRNFL cut-off point is widely accepted at ≤88µm, whereas reported optimal cut-offs for GCIPL thickness range from <70µm to <77µm.7–9 While our study was neither designed nor powered to compare different cut-off values, we found that the 77µm cut-off showed a slightly better association with disability worsening than 70µm (HR 4.1 vs 3.3, see Supplemental Figure 1).
This study provides an important new piece to the available body of evidence, as it used a real-life cohort where OCT scans were obtained within clinical routine and longitudinal retinal thinning was determined as the mere difference between two scans of each patient rather than by a regression line fitted to mean change of multiple scans used in earlier studies.6,9,12 Since this method is inherently more prone to confounding by OCT imaging inaccuracy, which is likely the reason for the weaker association of aLpRNFL and aLGCIPL with disability progression compared to previous studies, it is encouraging that even under these suboptimal circumstances, there is still a robust prognostic information to be gained from measuring GCIPL and pRNFL thinning in a real-world setting.9–12
Going forward, retinal layer thinning measured by OCT seems as one of the most promising biomarkers of MS-associated neurodegeneration in MS. Currently, neuroaxonal damage is predominantly measured clinically by the EDSS which is strongly limited as it reflects neurodegenerative damage only incompletely, has low sensitivity and mostly disregards neuropsychological disability.2 Neuropsychological and cognitive testing is more sensitive, but often hardly accessible, and lacks standardized testing approach even in clinical studies.31 Among the plethora of MRI measures, quantification of brain atrophy by brain volume loss (BVL) is the most studied but is also limited in terms of accessibility and standardization as well as various confounding factors.32,33
OCT has considerable advantages in this context as it is non-invasive, inexpensive, easy to perform and accessible, fast, and produces standardized, reliable quantitative measures.34 Contrary to MRI, GCIPL (and in absence of acute ON also pRNFL) thickness is not directly affected by inflammation.4 Therefore, OCT might offer an opportunity to measure subclinical MS-associated neurodegeneration, potentially providing a more complete reflection of MS pathology particularly relevant for long-term prognosis.
On the other hand, INL thickening is hypothesized to be a marker of MS-associated inflammation, although the underlying pathophysiology is controversially discussed. While initially microcystic macular edema (MME) and focal optic neuritis were believed to be the main mechanisms, more recent studies found INL thickening in MS even after adjusting or completely excluding eyes with MME or recent acute ON.13,15–17,35 Alternative proposed explanations include direct retinal inflammation or inflammation-related dynamic fluid shifts, possibly related to the existence of a retinal glymphatic system with a prominent role for the INL.35,36 In our study, we found INL thickness to increase in patients with relapse but decrease in patients without relapse, a priori ruling out all eyes with acute ON. This is confirming earlier observations where INL thickness was associated with relapses other than ON and new T2 hyperintense lesions, while thinning in phases of clinical stability and in patients successfully treated with DMT.13–17 However, it has to be acknowledged that the effect size is relatively small (absolute difference: 1.2µm). Thus, INL thickness might be a valuable parameter for capturing inflammatory disease activity and may be considered as an outcome measure for treatment trials, although its potential applicability as a biomarker in individual patients seems limited.
There are several limitations to this study. The sample size is still comparably low limiting power and potentially reproducibility. The retrospective analyses of data collected in clinical routine creates a variety of possible biases: We have to acknowledge a selection bias since OCT is routinely performed in patients with ON or when initiation of DMT with a sphingosine-1-receptor modulator is considered to check for macular edema. Thus, baseline disease activity in our cohort might be higher than in the general MS population. Due to the sample size and the mean observation period of 2.9 years, the number of studied individuals at years 4–5 is small and the derived information is limited.
This study was neither designed nor powered to compare effects of different DMTs on retinal layer thinning. Also, we did not have MRI parameters (new T2 and contrast-enhancing lesions) of disease activity available sufficiently standardized for inclusion in analysis.
Varying disease durations at baseline OCT may cause an immortal time bias, which was mitigated by adjusting for disease duration in the multivariate models. Although acquired in a real-world cohort, OCT scans were meticulously controlled for quality and confounding factors were ruled out rigorously, eg, severe myopia, optic disc drusen, and most importantly, accounting for history and timing of ON. Biological variability and measurement errors are also minimized by a homogeneous single-center data set. These sources of errors might be increased when OCT protocols and devices vary, and multicenter data sets are used.
Conclusion
In conclusion, both cross-sectional and longitudinal measurement of GCIPL and pRNFL thinning is reliable as a biomarker of disability worsening, ie, MS-associated neuroaxonal damage, in a real-world setting. Change of INL thickness is a promising marker of relapse, ie, inflammatory activity, although with limited effect size and only on a group level.
Author Contributions
All authors made substantial contributions to conception and design, acquisition of data, or analysis and interpretation of data; took part in drafting the article or revising it critically for important intellectual content; agreed to submit to the current journal; gave final approval of the version to be published; and agree to be accountable for all aspects of the work.
Funding
There was no funding to this study.
Disclosure
Natascha Schürz and Lydia Sariaslani are co-first authors for this study. Fritz Leutmezer has participated in meetings sponsored by, received speaker honoraria or travel funding from Actelion, Almirall, Biogen, Celgene, MedDay, Merck, Novartis, Roche, Sanofi-Genzyme and Teva, and received honoraria for consulting Biogen, Celgene, Merck, Novartis, Roche, Sanofi-Genzyme and Teva. Christoph Mitsch has received honoraria for consultancy/speaking (incl. funds for e-learning modules) from Bayer, Novartis and Takeda. Berthold Pemp has received honoraria for consulting from Novartis. Paulus Rommer has received honoraria for consultancy/speaking from AbbVie, Almirall, Alexion, Biogen, Merck, Novartis, Roche, Sandoz, Sanofi Genzyme, has received research grants from Amicus, Biogen, Merck, Roche. Thomas Berger has participated in meetings sponsored by and received honoraria (lectures, advisory boards, consultations) from pharmaceutical companies marketing treatments for MS: Allergan, Bayer, Biogen, Bionorica, Celgene, MedDay, Merck, Novartis, Octapharma, Roche, Sanofi-Genzyme, Teva. His institution has received financial support in the past 12 months by unrestricted research grants (Biogen, Bayer, Merck, Novartis, Sanofi Aventis, Teva and for participation in clinical trials in multiple sclerosis sponsored by Alexion, Bayer, Biogen, Merck, Novartis, Octapharma, Roche, Sanofi-Genzyme, Teva. Gabriel Bsteh has participated in meetings sponsored by, received speaker honoraria or travel funding from Biogen, Celgene, Lilly, Merck, Novartis, Sanofi-Genzyme and Teva, and received honoraria for consulting Biogen, Celgene, Merck, Novartis, Roche and Teva. The authors report no other conflicts of interest in this work.
References
1. Compston A, Coles A. Multiple sclerosis. Lancet. 2002;359(9313):1221–1231. doi:10.1016/s0140-6736(02)08220-x
2. Hegen H, Bsteh G, Berger T. No evidence of disease activity’ - is it an appropriate surrogate in multiple sclerosis? Eur J Neurol. 2018;359(Suppl.3):1221. doi:10.1111/ene.13669
3. Pemp B, Kardon RH, Kircher K, Pernicka E, Schmidt-Erfurth U, Reitner A. Effectiveness of averaging strategies to reduce variance in retinal nerve fibre layer thickness measurements using spectral-domain optical coherence tomography. Graefes Arch Clin Exp Ophthalmol. 2013;251(7):1841–1848. doi:10.1007/s00417-013-2337-0
4. Petzold A, Balcer LJ, Calabresi PA, et al. Retinal layer segmentation in multiple sclerosis: a systematic review and meta-analysis. Lancet Neurol. 2017;16(10):797–812. doi:10.1016/s1474-4422(17)30278-8
5. Martínez-Lapiscina EH, Arnow S, Wilson JA, et al. Retinal thickness measured with optical coherence tomography and risk of disability worsening in multiple sclerosis: a cohort study. Lancet Neurol. 2016;15(6):574–584. doi:10.1016/s1474-4422(16)00068-5
6. Bsteh G, Hegen H, Teuchner B, et al. Peripapillary retinal nerve fibre layer as measured by optical coherence tomography is a prognostic biomarker not only for physical but also for cognitive disability progression in multiple sclerosis. Mult Scler J. 2017:1352458517740216. doi:10.1177/1352458517740216.
7. Knier B, Leppenetier G, Wetzlmair C, et al. Association of retinal architecture, intrathecal immunity, and clinical course in multiple sclerosis. JAMA Neurol. 2017;74(7):847. doi:10.1001/jamaneurol.2017.0377
8. Zimmermann HG, Knier B, Oberwahrenbrock T, et al. Association of retinal ganglion cell layer thickness with future disease activity in patients with clinically isolated syndrome. JAMA Neurol. 2018;75(9):1071–1079. doi:10.1001/jamaneurol.2018.1011
9. Bsteh G, Berek K, Hegen H, et al. Macular ganglion cell–inner plexiform layer thinning as a biomarker of disability progression in relapsing multiple sclerosis. Mult Scler J. 2020:1352458520935724. doi:10.1177/1352458520935724.
10. Saidha S, Al-Louzi O, Ratchford JN, et al. Optical coherence tomography reflects brain atrophy in multiple sclerosis: a four-year study. Ann Neurol. 2015;78(5):801–813. doi:10.1002/ana.24487
11. Graham EC, You Y, Yiannikas C, et al. Progressive loss of retinal ganglion cells and axons in nonoptic neuritis eyes in multiple sclerosis: a longitudinal optical coherence tomography study. Invest Ophth Vis Sci. 2016;57(4):2311–2317. doi:10.1167/iovs.15-19047
12. Bsteh G, Hegen H, Teuchner B, et al. Peripapillary retinal nerve fibre layer thinning rate as a biomarker discriminating stable and progressing relapsing–remitting multiple sclerosis. Eur J Neurol. 2019;26(6):865–871. doi:10.1111/ene.13897
13. Saidha S, Sotirchos ES, Ibrahim MA, et al. Microcystic macular oedema, thickness of the inner nuclear layer of the retina, and disease characteristics in multiple sclerosis: a retrospective study. Lancet Neurol. 2012;11(11):963–972. doi:10.1016/s1474-4422(12)70213-2
14. Balk LJ, Coric D, Knier B, et al. Retinal inner nuclear layer volume reflects inflammatory disease activity in multiple sclerosis; a longitudinal OCT study. Mult Scler J Exp Transl Clin. 2019;5(3):2055217319871582. doi:10.1177/2055217319871582
15. Cellerino M, Cordano C, Boffa G, et al. Relationship between retinal inner nuclear layer, age, and disease activity in progressive MS. Neurol Neuroimmunol Neuroinflamm. 2019;6(5):e596. doi:10.1212/nxi.0000000000000596
16. Knier B, Schmidt P, Aly L, et al. Retinal inner nuclear layer volume reflects response to immunotherapy in multiple sclerosis. Brain. 2016;139(11):2855–2863. doi:10.1093/brain/aww219
17. Bsteh G, Hegen H, Altmann P, et al. Inner nuclear layer and olfactory threshold are interlinked and reflect inflammatory activity in multiple sclerosis. Mult Scler J Exp Transl Clin. 2020;6(3):2055217320945738. doi:10.1177/2055217320945738
18. Polman CH, Reingold SC, Edan G, et al. Diagnostic criteria for multiple sclerosis: 2005 revisions to the “McDonald criteria”. Ann Neurol. 2005;58(6):840–846. doi:10.1002/ana.20703
19. Polman CH, Reingold SC, Banwell B, et al. Diagnostic criteria for multiple sclerosis: 2010 revisions to the McDonald criteria. Ann Neurol. 2011;69(2):292–302. doi:10.1002/ana.22366
20. Thompson AJ, Banwell BL, Barkhof F, et al. Diagnosis of multiple sclerosis: 2017 revisions of the McDonald criteria. Lancet Neurol. 2018;17(2):162–173. doi:10.1016/s1474-4422(17)30470-2
21. Group ETDRSR. Classification of diabetic retinopathy from fluorescein angiograms: ETDRS report number 11. Ophthalmol. 1991;98(5):807–822. doi:10.1016/S0161-6420(13)38013-0
22. Tewarie P, Balk L, Costello F, et al. The OSCAR-IB consensus criteria for retinal OCT quality assessment. Villoslada P ed. PLoS One. 2012;7(4):e34823. doi:10.1371/journal.pone.0034823
23. Schippling S, Balk L, Costello F, et al. Quality control for retinal OCT in multiple sclerosis: validation of the OSCAR-IB criteria. Mult Scler J. 2014;21(2):163–170. doi:10.1177/1352458514538110
24. Britze J, Pihl-Jensen G, Frederiksen JL. Retinal ganglion cell analysis in multiple sclerosis and optic neuritis: a systematic review and meta-analysis. J Neurol. 2017;264(9):1837–1853. doi:10.1007/s00415-017-8531-y
25. Nolan‐Kenney RC, Liu M, Akhand O, et al. Optimal intereye difference thresholds by optical coherence tomography in multiple sclerosis: an international study. Ann Neurol. 2019;85(5):618–629. doi:10.1002/ana.25462
26. Bsteh G, Hegen H, Altmann P, et al. Validation of inter-eye difference thresholds in optical coherence tomography for identification of optic neuritis in multiple sclerosis. Mult Scler Relat Dis. 2020;45:102403. doi:10.1016/j.msard.2020.102403
27. Council National Research. The Prevention and Treatment of Missing Data in Clinical Trials. National Academic Press; 2010. doi:10.17226/12955
28. Ratchford JN, Saidha S, Sotirchos ES, et al. Active MS is associated with accelerated retinal ganglion cell/inner plexiform layer thinning. Neurology. 2013;80(1):47–54. doi:10.1212/wnl.0b013e31827b1a1c
29. Coric D, Balk LJ, Verrijp M, et al. Cognitive impairment in patients with multiple sclerosis is associated with atrophy of the inner retinal layers. Mult Scler J. 2017:1352458517694090. doi:10.1177/1352458517694090.
30. Abalo-Lojo JM, Limeres CC, Gómez MA, et al. Retinal nerve fiber layer thickness, brain atrophy, and disability in multiple sclerosis patients. J Neuroophthalmol. 2014;34(1):23–28. doi:10.1097/wno.0000000000000057
31. Munster CEP, Uitdehaag BMJ. Outcome measures in clinical trials for multiple sclerosis. CNS Drugs. 2017;31(3):217–236. doi:10.1007/s40263-017-0412-5
32. Bermel RA, Bakshi R. The measurement and clinical relevance of brain atrophy in multiple sclerosis. Lancet Neurol. 2006;5(2):158–170. doi:10.1016/s1474-4422(06)70349-0
33. Giorgio A, Battaglini M, Smith SM, Stefano ND. Brain atrophy assessment in multiple sclerosis: importance and limitations. Neuroimaging Clin N Am. 2008;18(4):675–686. doi:10.1016/j.nic.2008.06.007
34. Ontaneda D, Fox RJ. Imaging as an outcome measure in multiple sclerosis. Neurotherapeutics. 2017;14(1):1–11. doi:10.1007/s13311-016-0479-6
35. Gelfand JM, Nolan R, Schwartz DM, Graves J, Green AJ. Microcystic macular oedema in multiple sclerosis is associated with disease severity. Brain. 2012;135(6):1786–1793. doi:10.1093/brain/aws098
36. Petzold A. Retinal glymphatic system: an explanation for transient retinal layer volume changes? Brain. 2016;139(11):2816–2819. doi:10.1093/brain/aww239
 © 2021 The Author(s). This work is published and licensed by Dove Medical Press Limited. The
full terms of this license are available at https://www.dovepress.com/terms
and incorporate the Creative Commons Attribution
- Non Commercial (unported, 3.0) License.
By accessing the work you hereby accept the Terms. Non-commercial uses of the work are permitted
without any further permission from Dove Medical Press Limited, provided the work is properly
attributed. For permission for commercial use of this work, please see paragraphs 4.2 and 5 of our Terms.
© 2021 The Author(s). This work is published and licensed by Dove Medical Press Limited. The
full terms of this license are available at https://www.dovepress.com/terms
and incorporate the Creative Commons Attribution
- Non Commercial (unported, 3.0) License.
By accessing the work you hereby accept the Terms. Non-commercial uses of the work are permitted
without any further permission from Dove Medical Press Limited, provided the work is properly
attributed. For permission for commercial use of this work, please see paragraphs 4.2 and 5 of our Terms.