Back to Journals » Integrated Pharmacy Research and Practice » Volume 10
Evaluation of Pharmaceuticals Inventory Management in Selected Health Facilities of West Arsi Zone, Oromia, Ethiopia
Authors Jobira T, Abuye H ![]() , Jemal A
, Jemal A ![]() , Gudeta T
, Gudeta T ![]()
Received 24 December 2020
Accepted for publication 20 January 2021
Published 9 February 2021 Volume 2021:10 Pages 1—11
DOI https://doi.org/10.2147/IPRP.S298660
Checked for plagiarism Yes
Review by Single anonymous peer review
Peer reviewer comments 3
Editor who approved publication: Professor Jonathan Ling
Tadesse Jobira,1 Habtamu Abuye,2 Awol Jemal,3 Tadesse Gudeta3
1Health Office Logistic Coordination, Shashemene City Administration, Shashemene, Ethiopia; 2Department of Pharmacy, College of Medicine and Health Sciences, Wachemo University, Hossaena, Ethiopia; 3Pharmaceutical Supply Chain Management Department, School of Pharmacy, Institute of Health, Jimma University, Jimma, Ethiopia
Correspondence: Habtamu Abuye
Wachemo University, P.o. Box: 667, Hossaena, Ethiopia
Tel +251 913571974
Fax +251-46-555-19-30
Email [email protected]
Background: Effective inventory management ensures an uninterrupted supply of safe, effective, and affordable pharmaceuticals which could be achieved through developing ABC-VEN (Always, Better, Control–Vital, Essential, Desirable) and FSN–XYZ (Fast, Slow, Non-moving–High, Medium, Low Value) matrix analysis. ABC–VEN matrix analysis is used to control inventory according to their annual consumption and on their functional importance whereas, FSN–XYZ matrix analysis is applied to control inventory by identifying the items to be discarded and the amount saved during the closing of annual accounts.
Objective: To evaluate inventory management in selected health facilities of West Arsi zone, Oromia regional state for the year 2016– 2018.
Methods: Facility-based cross-sectional descriptive study complemented with a qualitative study was conducted in fourteen health facilities. Data were collected from goods issuing vouchers for the year 2016– 2018 to perform ABC–VEN matrix analysis. The frequency of issue was collected to perform FSN analysis and the value of each closing stock was taken to get XYZ analysis.
Results: From the ABC–VEN matrix analysis, 26.6% of items were Category I of which the highest proportion were taken by class A and V items consuming 84.7% of annual drug expenditure (ADE). The remaining 49.2% and 24.2% of the drugs accounted for only 13.2% and 2.1% of the ADE being category II and III, respectively. Based on FSN–XYZ matrix analysis findings, category I with 41.% item share account for the highest budget (average 86.5% of values). Of this category, the XN group—non-moving and high-cost drugs had the high value (20%) which need managerial measure. In category III, the ZN group items, being 25% of drugs, only had 2.2% of value—that may increase wastage, inventory holding cost, and shortage of storage space.
Conclusion: The matrix analysis for inventory control is a strong tool that enables one to identify items requiring close monitoring. The coupled ABC–VEN matrix analysis, combining their individual advantages – inventory’s cost and its functional importance help in achieving a meaningful inventory management. However, to control the stock at an appropriate level with minimum shortage and oversupply, it has to be supported by XYZ–FSN matrix analysis. The XYZ–FSN matrix benefits the health facilities to determine the level of inventory with high value in dead-stock, and to take measures like transferring to others, discarding, or saving.
Keywords: ABC–VEN matrix analysis, FSN–XYZ matrix analysis, inventory management
Introduction
Global spending on health continues to grow. It was 7.8 trillion US dollars in 2017 and 1080 trillion US dollars per capita.1 In 2019, approximately 1.25 trillion US dollars had been spent on pharmaceuticals which represent a significant part of the healthcare budget, accounting for approximately 10% of annual healthcare expenditure.2 This figure is higher in developing countries since pharmaceuticals constitute as much as 40% of the healthcare budget.3
Pharmaceuticals provide great benefits, but their cost is substantial.3 Although huge money is being invested in them, in the healthcare facilities their shortage, loss, wastage due to expiration, damage/contamination/spoilage and overages, and inappropriate use become common.3–5 Spending on unnecessary or substandard pharmaceuticals increases the costs of inventory management and wastage disposal.6 In order to solve such problems and apply effective pharmaceutical supply, there has to be a proper inventory management system and well trained and skilled professionals.3,5
Pharmaceutical inventory management is a complex but critical process within the healthcare delivery system because it influences clinical and financial outcomes.5,7,8 It refers to all the activities involved in developing and managing the inventory levels of pharmaceuticals so that adequate pharmaceutical supplies are available and the costs of over or under stocks are low since inventory is defined as a stock or store of pharmaceuticals.9,10 It typically includes basic stock and safety stock. Basic stock is the amount of inventory carried on hand to meet an average demand level, while safety stock is the amount of inventory kept on shelves to account for fluctuations in demand.11
The objective of pharmaceutical inventory management is maintaining a steady supply of pharmaceuticals to operating units and patients while minimizing the costs of holding inventory and managing procurement.3,11 Or balancing the stock out and overstock of essential pharmaceuticals which are the cause for the decline in the quality of patient care, pharmaceuticals wastage, and financial loss is the ultimate goal of pharmaceutical inventory management.10,11 Besides, it protects from uncertainties in the demand and order cycle, and acts as a buffer between critical interfaces within the supply chain.10 If it is treated poorly, interruptions in pharmaceutical supplies are possible. To avoid that and enhance proper functioning of pharmaceutical inventory management system, there are tools and methods devised to measure its performance such as the ABC (Always Better Control) analysis, VEN (Vital, Essential, and Non-essential) analysis, ABC–VEN matrix analysis, XYZ (High, Medium, and Low Value) analysis, FSN (Fast, Slow, and Non-moving) analysis and FSN–XYZ matrix analysis.
In Ethiopia, although measures were taken to solve problems on the pharmaceutical supply in health facilities by establishing Pharmaceuticals Fund and Supply Agency (PFSA) under Proclamation No. 553/2007 based on the Pharmaceuticals Logistics Master Plan (PLMP), poor pharmaceutical inventory management culture hindered health facilities from achieving their goals.12 The pharmaceutical inventory control problem is frequently reported as a major gap in supply chain performance in several health facilities of the country.6,8 Its inefficiencies have been resulting in non-availability of essential drugs, wastage due to poor storage, poor stock management, irrational use, poor dispensing, and prescribing practices.12,13
Many researchers studied the pharmaceutical supplies and inventory management using traditional and most widely applied inventory control methods such as ABC analysis, VEN analysis, and FSN analysis, and/or matrix analysis in both hospitals and the pharmaceutical industry.14 However, very few studies had assessed inventory management problems in health centers and almost none had tried to show it using ABC–VEN and FSN–XYZ matrix analysis in Ethiopia.
An accurate and objective picture of budget expenditures on inventory is obtained by ABC analysis model. VEN analysis helps to prioritize between various pharmaceuticals in their selection for procurement and use within a drug supply system.15 So, the ABC–VEN matrix analysis is used to control inventory according to their annual consumption-budget expenditures-based on the Pareto principle and on their functional importance.16 FSN analysis is based on the pattern of issues from stores and is useful in controlling obsolescence of inventory.17 It helps in identifying active items which need to be reviewed regularly and overstocked items which have to be examined further. The XYZ analysis is based on the value of inventory actually held in stores at a given time and helps find items with heavy stock.17,18 The combined FSN–XYZ matrix analysis is, therefore, applied to identify the items to be discarded and the amount saved.7,17 Thus, the current study is designed to answer the following research questions in the public health facilities of West Arsi zone, Oromia region, Ethiopia.
- How are the medicines in the hospital and health center classified for the ABC, VEN, XYZ, and FSN classification?
- How are medicines expenditures controlled?
- What proportion of medicines and their categories require higher supervisory monitoring?
Methods
Study Area and Period
The study was conducted in selected health facilities of West Arsi zone, Oromia regional state from 19th April 2019 to 19th May 2019. West Arsi zone covered the South and Southeast parts of the region. Administratively, there are 13 districts with a total population of over 2 million people. There are 2 public hospitals, 82 health centers, and 410 health posts (dispensing units of HCs) in the zone. From these health facilities, one of the hospitals and seven health centers were established in the midyear of 2017 and the beginning of 2018 (West Arsi Zonal Health Department).
Study Design
A facility-based quantitative descriptive cross-sectional study was conducted using standard data collection tool.
Sample Size Determination and Sampling Procedure
The USAID delivery project logistics indicators assessment tool (LIAT) was employed to determine the sample size of health facilities. It recommends a minimum of 15% of the total health facilities inclusion.19 Out of 84 health facilities, by default 1 hospital was included in the study because the other one started service after the study period—8th July 2015. Thirteen HCs were selected by simple random sampling technique to get a representative sample for the zone from the available 13 districts in the study period—one from each. Therefore, 14 health facilities were taken for the study. Regarding documents, all Model 22 (56 issuing vouchers) utilized in the period of 8th July, 2015 to 7th July, 2018 were reviewed for ABC and FSN analysis and, all annual inventory records (42 annual inventory was conducted) at budget closure of each year (2016–2018) for XYZ analysis were considered. The study included all Revolving Drug Fund (RDF/budget pharmaceuticals).
Data Collection Tool
A structured data collection format adopted from MSH was used to collect the necessary data for ABC and VEN analysis.3 For the XYZ and FSN analysis, standard data collection checklist was adapted from Yogesh et al and Divya et al works.14,17 (Supplementary file).
Data Collection Procedures
For ABC analysis, the annual expenditure of each drug was collected from Model 22 (issuing vouchers) and an electronic database system, and entered into an excel spreadsheet. For the VEN category was obtained from the facilities’ drug lists and for health facilities that lack drug lists, information collected from medical staff using a pretested semi-structured questioner was used to classify medicines as VEN. In the case of XYZ, the first total inventory at end of each Ethiopian Fiscal Year (EFY) was obtained from the physical inventory record of the respective year (2016–2018). Then, the value of each closing stock was collected and analyzed using an excel spreadsheet. Data for FSN were obtained by reviewing the issuing voucher and calculating the frequency of issue by excel spreadsheet.
Data Management and Analysis
Analysis of the quantitative data was done by using Microsoft Excel® spreadsheets and SPSS version 20.
The ABC Analysis—Based on Cost
The ABC analysis was done following certain steps. First, all drugs issued in the last three years (from 8th July, 2015 to 7th July, 2018) were extracted from model 22 and then checked and edited for any inconsistency. The unit cost for each medicine and the total quantities issued were used to calculate the value of each item. The value of consumption was furthermore calculated; by multiplying the unit cost by the number of units of each drug issued to obtain the total value. Then, the percentage of the total value represented by each medicine was also calculated; by dividing the value of each medicine by the total value of all medicines. The list was then rearranged, ranked in descending order by the total value. A cumulative percentage of the total value for each medicine was calculated. Cut-off points or boundaries for Class A, B, and C medicines were determined. “A” class—10 to 20% of items that takes 70–80% of the overall total cost, “B” class—10 to 20% of items that takes 15–20% of the overall total cost, “C” class—60–80% of items that takes 5–10% of the overall total cost.20 Finally, the results were presented in tables showing proportions of items in different classes and the proportion of budget utilized.
VEN Analysis—Based on Criticality
Criticality analysis of all the purchased pharmaceuticals during a fiscal year in the medical store was conducted and then classified based on VEN classification criteria into three groups. Those drugs which were critically needed as the lifesaving drugs and those that must be available at all times were included in the V category. The items having lesser criticality needs as well as those that may be available in the hospital were included in the E group. The items with the lowest criticality or those whose shortage may not pose a threat to the health of the patients were included in the N group.
Coupling of ABC–VEN Analysis
ABC and VEN analyses were combined by cross-tabulation to get an ABC–VEN matrix and different categories of medicines. From the ABC–VEN matrix, a total of 9 sub-categories were obtained (Table 1) and from these, 3 main categories were formed as follows: Category I comprises all the expensive and vital medicine items: AV+AE+AN+BV+CV, Category II included the remainder of the items in B and E items: BE+BN+CE and Category III included the cheapest and non-essential medicine items: CN.21
 |
Table 1 Categories of Drugs Obtained by the Coupling of ABC and VEN Analysis, and XYZ and FSN Analysis or Making Matrix |
XYZ Analysis—Based on Stock Value
When annual stock-taking is over, the closing stock values of items were arranged in descending order, and the respective cumulative values against each item were entered; then the descending number of item was computed as a percentage of the total of all items in stores; the cut-off points were set depending on the distribution. Generally, the first 70% of the total inventory value was corresponding to X Class, the next 20% were of Y Class and the last 10% of the value was corresponding to the Z Class.18
FSN Analysis—Based on Frequency of Issue
Medicines were categorized into FSN according to their frequency of consumption. First, the frequency of each item issued was obtained and rearranged in descending order. Accordingly, those items which were issued more than 15 times within a year were classified as fast-moving items (F), those issued 5–15 times were considered as slow (S), and those items issued less than 5 times were classified as non-moving (N) items.18
Coupling of FSN–XYZ Analysis
Both FSN and XYZ analysis were combined by cross-tabulation to get an FSN–XYZ matrix and different categories of pharmaceuticals. From the FSN–XYZ matrix, a total of 9 sub-categories were obtained (Table 1) and from these, category I comprises FX+FY+FZ+SX+NX, category II includes SY+SZ+NY and category III has non-moving low value items, NZ. Here the focus of management is given to N class items. They were identified and selected to conduct XYZ analysis.21
Data Quality Assurance
The collected data were checked for completeness and cleaned every day during data collection. Incomplete data were discarded and data collectors were redirected. On the other hand, pharmacy professionals were recruited for data collection and they were supervised by the principal investigators.
Ethical Consideration
Ethical approval with Reference No ጤ/ኢ/ጥ/ዳ/ 787/2011 was obtained from Institutional Review Board (IRB) of Jimma University and submitted to Oromia regional health bureau along with one hard copy of the proposal. Then, authorization letter was received from Oromia regional health bureau, West Arsi zone health department, and each Wereda health office sequentially. Before data collection, permission was obtained from the hospital chief executive officer (CEO) and primary healthcare units (PHCUs) directors.
Result
Fourteen health facilities were surveyed to evaluate pharmaceutical inventory management/control—ABC Analysis, VEN analysis, ABC–VEN matrix analysis, FSN Analysis, XYZ analysis, and FSN–XYZ matrix analysis. In the study area, within the past three years (2016–2018), a total of 546 different types of items were issued and a total of 17,444,512.8 ETB were consumed (Table 2).
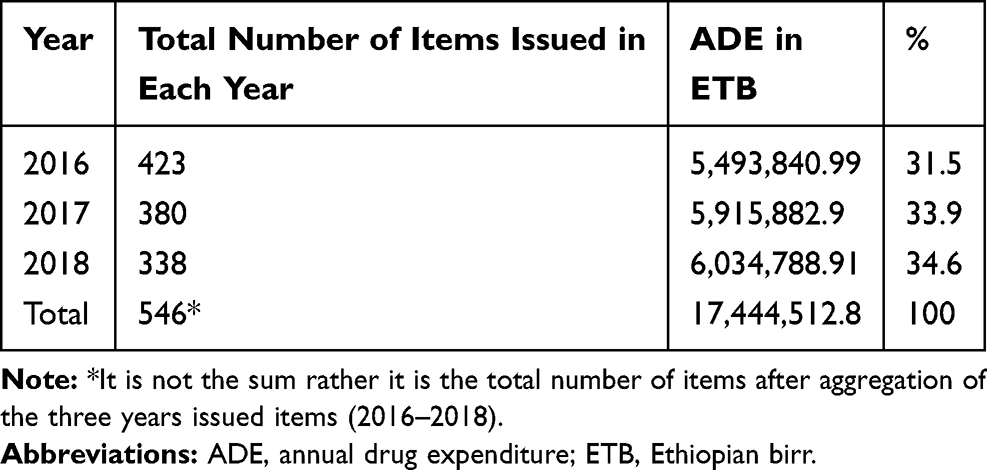 |
Table 2 Annual Expenditures on Drugs for 2016–2018 in the Study Area |
ABC Analysis
ABC analysis showed that 66 (12.1%) medicines were found to be class A while class B had 10.2 (10.8%), and class C constituted 424 (77.7%) of total items. These cost 80.1%, 10.8%, and 9.1% of total Annual Drug Expenditure (ADE) correspondingly (Table 3).
 |
Table 3 ABC Analysis, VEN Analysis and ABC–VEN Categorization of the Different Medicine Types in the Study Area Respectively |
As depicted in Figure 1, among class A items, only 10 (1.8%) of them accounted for 39.8% of annual consumption value. Of these, the three drugs—amoxicillin 500 mg capsules, cloxacillin 500 mg capsules, and ceftriaxone 1gm injections consumed the highest budget (23.6%) of total annual drug expenditure.
 |
Figure 1 The total value of top 10 items of class A, in the study area for 2016–2018 EFY. |
The VEN Analysis
The VEN categorization revealed that 77 items (16.9%) classified as V and consumed 2,130,208.25 ETB (35.1%), 309 items (67.9%) grouped as class E that used 3,720,294.11 ETB (61.3%), and 69 items (15.2%) grouped as N class which took 219,234.92 ETB (3.6%) of total ADE (Table 3).
ABC–VEN Matrix Analysis
The ABC–VEN matrix classification of the inventory showed that 121 items (26.6%) classified as category I, 224 items (49.2%) as category II, and 110 items (24.2%) as category III accounting for approximately 84.7%, 13.2%, and 2.1% of the total annual the total expenditure, respectively. Among category I, AE items consumed the highest budget of its class (Table 3).
FSN Analysis
In 2016 EFY, 35.3% of different types of issued items were classified as fast-moving, and accounted for 78.4%, of pharmaceutical expenditure. Twenty-nine percent of the issued items in 2017EFY were labeled as S and consumed 23% of total budget spent on pharmaceuticals. The non-moving issued items which comprised 39.9% were seen to take 1.7% annual money spent on drugs in 2018 EFY (Table 4).
 |
Table 4 FSN Analysis of Issued Drugs and XYZ Analysis of Closing Stock Value at Study Area the Year 2016–2018 EFY |
XYZ Analysis
As per the technique, 100 items (23.8%) were grouped under X class that constituted 80.2% of the total closing stock value in 2016. In the EFY 2017, 41 items (14.9%) were classified under Y class comprising 11.6% of the total closing stock budget of the year. Similarly, 123 items (48.3%) categorized within Z class accounted for 5% of total value for the 2018 EFY (Table 4).
FSN–XYZ Analysis
The results of the FSN–XYZ matrix analysis showed that 192 (45.8%) items in category I accounted for 88% of the total closing stock value in 2016. Under category II, in 2017 EFY, 97 (35.3%) were found and took 11.6% of the year’s closing stock expenditure. In 2018 EFY, 122 (34.7%) items in category III took 2.6% of closing stock value (Table 5).
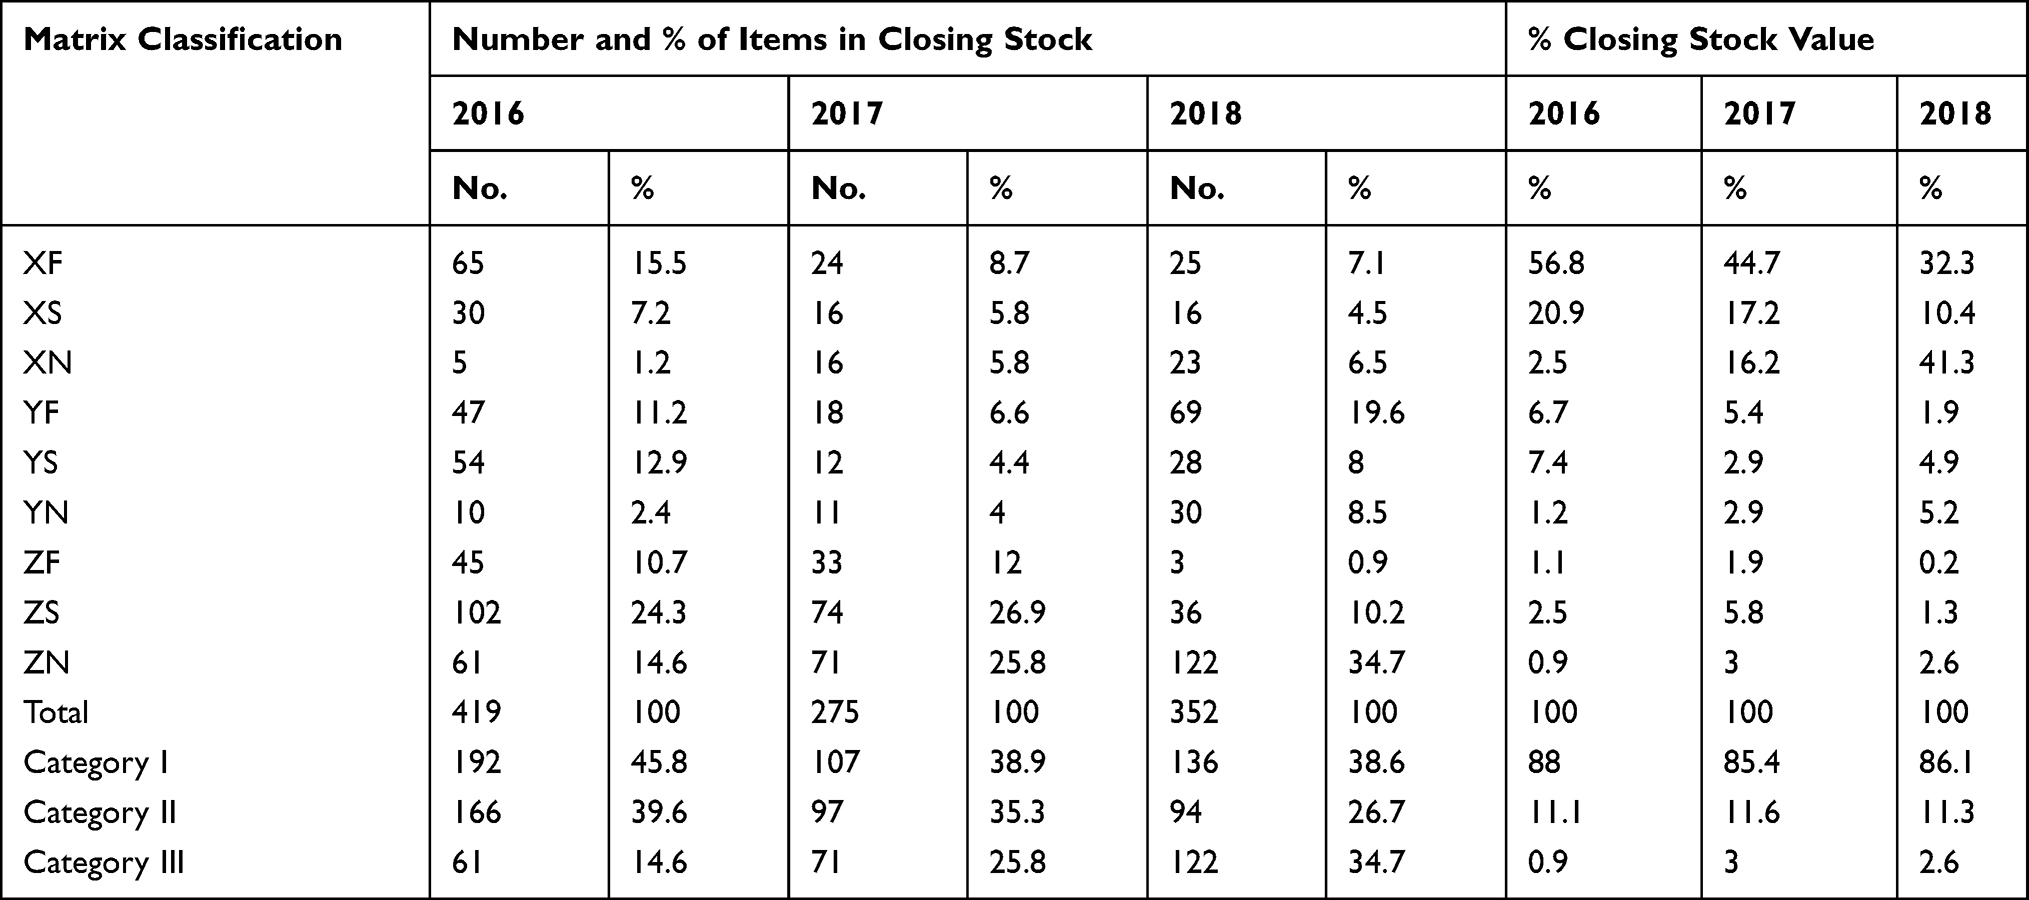 |
Table 5 Coupled XYZ–FSN Matrix Analysis of Drugs in at Study Area the Year 2016–2018 EFY |
As seen from Figure 2, this study showed that there was a similarity in the pattern of drug consumption from year to year even though slight variation was seen related to the movement of some stocks. For instance, Sulphamethoxazole+Trimethoprim suspension, surgical glove size 7.5, Gauze surgical 90 cm x 100 m exhibited a slight rise and fall in their pattern of consumption.
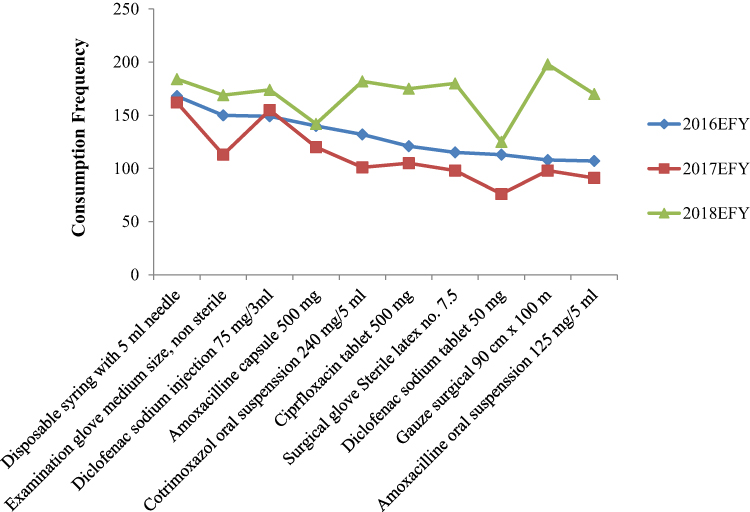 |
Figure 2 Trends of top 10 fast moving drugs in the study area for 2016–2018 EFY. |
Discussion
In the current study, the drug consumption trend indicated that there was a decrement in the number of items procured while there was an increment in the total value of the products. The reduction in the number of available pharmaceuticals might be due to the political instability during the past three years (2016–2018) and the price rise was as a result of economic inflation observed in the stated times. This result is similar to the previous study conducted by Sefinew et al in which the budget utilization showed increment from 2009 to 2013.22
ABC Analysis
In this study, class A medicines were consumed the highest percentage (80.1%) of total ADE over the three years. The result is consistent with the studies conducted in India, Kenya, and Ethiopia where class A items accounted for 70%, 79.9%, and 81.2% of the total annual ADE, respectively.5,22,23 In terms of items, class A comprised 12.1% of the total. This finding obtained a higher items percentage than the findings of Sefinew et al that is 6.8%, and Manhas et al which is 9.6%.22,24 Medicines belonging to class A require more stringent control, accurate data-driven forecasting of demand, close check on budgetary control, minimum safety stock, frequent stock-taking, issuing and inspection policy.18
Of the remaining pharmaceuticals, class B comprising 10.2% items and class C constituting 77.7% items consumed 10.8% and 9.1% of ADE. Research by Manhas et al found that 22.4% items forming group B and 62.17% items being grouped under C consumed 20% and 10% of ADE.24 And Sefinew et al obtained 20.40% items called class B and 70% items regarded as class C engulfed 13.3% and 5.5% of total drug budget, respectively.22 Both studies’ findings are in complete agreement with the findings of this study in principle. Class B requires moderate control whereas class C requires only minimum control measure for order and purchase and these activities can be accomplished by mid-level and lower-level managers, respectively.18
VEN Analysis
This study showed 16.9% items were Vital, 67.9% items were Essential and the remaining 15.2% items were Non-Essential. The finding is inline with the finding of Tumaini HL study conducted in Tanzania stated 17% items were vital, 68.5% items were essential, and 14.5% items were non-essential medicines of total procured medicines.25 But vital medicines were slightly less than the finding of the study conducted in Kenya, which is 24.8%.23 Moreover, studies conducted by different scholars support this result with slight variation due to the study setting.14,15,26 Research by Sefinew et al found that 67.2% items were considered vital, 22% items were essential, and 0.4% items were nonessential.22 The findings were inconsistent with the current work.
In this regard, a medicine belonging to the vital category requires continuous availability and reasonable safety stock, while reducing class E stock level, store managers need to closely monitor class N items amount to avoid overstocking.27 In general, the result of VEN analysis in this study indicated that the majority of medicines belonged to the vital and essential groups, pointing out that expenditure in the health facilities is targeting at serving the healthcare needs of the populations which is encouraging.
ABC–VEN Matrix Analysis
The ABC analysis is not enough to use when evaluating the inventory of medicines and should be used in conjunction with a tool that considers non-monetary factors. Combining the ABC and VEN analyses leads to categories of medicines that require different inventory control management. Accordingly, 26.6% items were grouped under category I and accounted for the highest (84.7%) value. However, 49.2% items classified as category II took a lower value (13.2%). These findings are comparable with the results of the study conducted in Kenya which showed that medicines belong to Category I, II, and III accounted for 85%, 14%, and 0.9% of ADE, respectively.23 But a study by Pund et al revealed that 47.9%, 43.7%, and 8.4% of the consumables constituted Category-I, II, and III items, respectively, accounting for 82.3%, 16.5%, and 1.2% of drug expenditure.15 This difference might be attributed to the difference in the study setting, the prevalence of the disease, and the pharmaceutical price difference.
Most of the drugs with a high consumption value and vital clinical importance (AV drug category) should be at minimal shortages as they are critical for life-saving; their availability must be ensured even though the holding costs are high. Inventory ordering should be conducted at fixed intervals. Safety stock and re-ordering period (ROP) should be calculated to ensure particular levels of stock. The drugs with high consumption value and essential clinical importance (AE drug category) constituted a high proportion of total `consumption value because it was prescribed steadily throughout the year.
In the ABC–VEN Matrix Analysis, as it goes down, when the grouped items become fewer, monitoring and control of these items become simple. The current work recorded 110 items under low consumption value and non-essential clinical importance (CN drug category). This prioritization is against the study done by Vat et al.21 It will be a great concern for health facilities’ drug and therapeutic committee (DTC) and store managers to make selective control, procurement, and inventory holding based on this categorization.
FSN Analysis
From the FSN analysis, the values of fast-moving F items are by far greater than S and N items. In 2016, only 35.3% of the total items accounted for 78% of the total value. This finding is consistent with the finding of Yogesh et al done in India in which F class items accounted for 81.52% of the total value.14 This indicates that the managers have to give due attention to fast-moving items. Moreover, the current result revealed that the pattern of consumption of medicines was varied from year to year across some specific drugs depicted in Figure 2. However, when we look at the trends in the proportion of items and their corresponding value, the finding showed that the percentage values were very close across each year (2016–2018). On the other hand, this result revealed the minimum frequency of issue for class F is 15 times per year of which most of them had a frequency of 48 times per year. This indicates, either the dispensaries were not completing the internal facility report or resupply form (IFRR) correctly or there was a problem of loss.
It is not clear why non-moving pharmaceuticals stocked in the proportion shown in the current work. Their consumption value and number of items held in the store are un-matchable. The highest percentage value (62.4%) seen in 2017 alarm pharmacists to follow their drug expiry date tracking chart closely and find possible solutions to minimize the risk of wastage due to overstocking. Their lowest budget share may not be allowed to deceive pharmacy professionals in charge of pharmaceutical inventory management.
Here, the attention of the management should focus on Fast moving items as it requires high stock, strict control, and high safety stock.14 Since N items required low stock and low control, they could be either transferred to other health facilities where it can be utilized or disposed of early.14 If disposing is the only option, it will be performed based on the value of each item of drugs by conducting an XYZ analysis on the N category items.27
XYZ Analysis
XYZ analysis helps to control the value of inventory leftover at each fiscal year. It tells how the values are distributed amongst pharmaceuticals in stores. This study revealed that very few numbers of total closing items (on average 23.0%) had the highest percentage (on average 79.8%) of total closing stock value and in contrast to this a huge number of drug types (on average 55.5% of total drug types) had very little amount (6.1%) of total closing stock value. This shows that the health facilities managers, DTC, and pharmacy professionals have to focus on the monitoring of the utilization of especially class X items to minimize the wastage due to expiry as the items pass from year to year. The remaining, class Z (on average 54.2%) items, account for only 6.2% of the total closing stock value. These findings are comparable to the findings of Krishna Reddy et al study conducted in India, which revealed 10%, 20%, and 70% of items contribute to 59%, 35%, and 6% of the total closing stock value for class X, class Y, and class Z categories, respectively.7
XYZ–FSN Matrix Analysis
When we look at the XYZ and FSN matrix analysis, the XF group which represents high closing stock value and fast-moving items utilized the highest budget (56.8%) in 2016 and (44.7%) in 2017. In this case, the health facilities can minimize the maximum stock level up to the reorder point to optimize the inventory level. But in 2018, the XN group had the highest value (41.3%), at which the health facilities would plan to take fast action on it. Moreover, the managers have to review their drug selection and quantification to avoid investing in non-moving high-cost drugs. A similar study done in India revealed there were 33 items under NX (non-moving item found in Z category) that were to be discarded.17
Out of 85.4% and 86.1% of category I in 2017 and 2018, the XN group account for 16.2% and 41.3% of the total consumption value. This result is in line with the study done in India in which the combined FSN–XYZ analysis identified 33 items that came under the XN category and are chosen for discarding.17 The current study implies that the items having high cost were being stored with no movement throughout the year. This can probably lead to an increment in carrying cost due to the rise in the cost of deterioration and the cost of pilferage. So, there must be strict control over non-moving and slow-moving items.
Conclusion
For inventory management, different inventory control methods can be used. The matrix analysis is one of the inventory control techniques in which we can identify items requiring close monitoring. By coupling ABC with VEN a meaningful control over the inventory will be possible. Besides, categorization of drugs according to the XYZ–FSN matrix benefits the health facilities to determine the level of inventory with high value in dead-stock or slow-moving items. For inventory management of vital drugs, only ABC and VEN matrix classification are insufficient to control the stock at an appropriate level with minimum shortage and oversupply. Moreover, consideration of consumption patterns and their closing stock value in forecasting and setting inventory level give an accurate stock level for optimization of vital drugs inventory management.17 Their efficient implementation helps health facilities to take measure on items grouped as XN and AN like transferring to other health facilities; and ZN items to discard.
Acknowledgment
We would like to acknowledge Jimma University, school of pharmacy for their advice, guidance, and assistance. We also like to extend our gratitude to Oromia regional health Bureau, for their co-operation, and West Arsi zone and Shashemene town health office for their financial support.
Disclosure
The authors report no conflicts of interest in this work.
References
1. World Health Organization. Global Spending on Health: A World in Transition 2019. 2019. Available from: https://creativecommons.org/licenses/by-nc-sa/3.0/igo.
2. Mikulic M. Global spending on medicines in 2010, 2019, and a forecast for 2024 (in billion U.S. dollars). Statista. 2019. Available from: https://www.statista.com/statistics/280572/medicine-spending-worldwide/.
3. Management Sciences for Health. Managing Medicines Selection. In Managing Access to Medicines and Health Technologies. MSH; 2012:
4. Temegen ND, Gemechis MS, Gutu MA, Alemayehu AG, Dinka DI. Project proposal on renovation of pharmacy services: implementing Auditable Pharmaceutical Transaction and Services (APTS) in Shambu General Hospital, Horro Guduru Wollega Zone, Shambu Town, Oromia, North West Ethiopia. 2017.
5. Osei Mensah E. The effects of inventory management practices on service delivery at St. Martin’s Hospital, Agroyesum, Amansie-West. 2015.
6. Tadeg H, Ejigu E, Geremew E, Adinew A. Auditable Pharmaceutical Transactions and Services (APTS): findings of the baseline assessment at federal, Addis Ababa, and Teaching Hospitals. 2014.
7. Krishna RKV, Siddarth SMS, Rakesh P. A study on the selective controls of inventory management and application of ABC XYZ control matrix in the cardiology department of a tertiary care hospital. IOSR J Dent Med Sci. 2017;16:6–9. doi:10.9790/0853-1605090609
8. Gurmu TG, Ibrahim AJ. Inventory management performance of key essential medicines in health facilities of East Shewa Zone, Oromia Regional State, Ethiopia. Cukurova Med J. 2017;42(2):277–291. doi:10.17826/cutf.322908
9. Duangpun K, Watcharaphong M. Developing inventory management in Hospital. Int J Supply Chain Manag. 2015;4:11–19.
10. Stock JR, Lambert DM. Strategic Logistics Management. McGraw-Hill; 2001.
11. National Community Pharmacists Association (NCPA). Managing the pharmacy inventory. Available from: http://bccpharmacytech.weebly.com/uploads/7/5/0/4/7504847/ownership-managinginventory.pdf.
12. The Pharmaceutical Fund and Supplies Agency would. Standard Operating Procedures (SOP) Manual for the Integrated Pharmaceuticals Logistics System in Health Facilities of Ethiopia. Pharmaceuticals Fund and Supply Agency; 2015.
13. Tamirat A, Jemal A, Gashe F, Suleman S, Sudhakar S, Fekadu G. Integrated pharmaceutical logistics system implementation in selected health facilities of ethiopia: the case of four wollega zones pharmaceutical care & health systems. J Pharma Care Health Sys. 2020;7.
14. Yogesh K, Kumar Khaparde R, Dewangan K, Kumar Dewangan G, Dhiwar JS, Sahu D. FSN analysis for inventory management – case study of sponge iron plant. Int J Res Appl Sci Eng Technol. 2017;5:52–58.
15. Pund SB, Kuril BM, Hashmi SJ, Doibale MK, Doifode SM. ABC-VED matrix analysis of Government Medical College, Aurangabad drug store. Int J Community Med Public Health. 2016;3:469–472. doi:10.18203/2394-6040.ijcmph20160434
16. Al-Najjar SM, Maha KJ, Ola AS. Application of ABC-VED matrix analysis to control the inventory of a central pharmacy in a Public Hospital: a Case Study. Int J Sci Res. 2010;9:1328–1336.
17. Divya D, Jayamohan MS. Stock control in a chemical firm: combined FSN and XYZ analysis. Int Conf Emerg Trends Eng Sci Technol. 2016;24:562–567.
18. Bivash M, Onkar ND, Santanu D, Case A Study on inventory management using selective control techniques. 2012.
19. United States Agency for International Development. Logistics Indicators Assessment Tool (LIAT). John Snow, Inc./ DELIVER; 2005.
20. Yitayew A. Inventory Management Practice in Case of Arba Minch University [bachelor's thesis]. Arba Minch; GRIN Verlag. Available from: https://www.grin.com/document/381182. 2014.
21. Vaz F, Ferreira A, Pereira-Antao I, Kulkarni M, Motghare D. Application of inventory control techniques for drug management. Indian J Prev Soc Med. 2008;39:39–42.
22. Sefinew M, Mahlet Y, Berhanemeskel W, Workineh S. ABC-VEN matrix analysis of pharmaceutical inventory management in Tikur Anbessa Specialized Hospital for the years 2009 to 2013, Addis Ababa, Ethiopia. Indian J Basic Appl Med Res. 2016;5:734–743 Original.
23. Kivoto PM, Mulaku M, Ouma C, Ferrario A, Kurdi A, Godman B, Oluka M. Clinical and financial implications of medicine consumption patterns at a Leading Referral Hospital in Kenya to guide future planning of care. Pharm Med Outcomes Res. 2018:1–13. doi:10.3389/fphar.2018.01348
24. Manhas AK, Malik A, Haroon R, Sheikh MA, Syed A. Analysis of inventory of drug and pharmacy department of a tertiary care hospital. JIMSA. 2012;25:183–185.
25. Tumaini HL. Analysis of medicines expenditures and pharmaceutical inventory control management at Muhimbili National Hospital. Medicine (Baltimore). 2013.
26. Maj SK, Brig AC. ABC-VED analysis of expendable medical stores at a tertiary care hospital. Med J Armed Forces India. 2014;1:5–8.
27. Shakti G, Sunil K. Hospital Stores Management - an Integral Approach. In Inventory Control 60 –72. Jaypee Brothers Medical Publishers (P) Ltd; 2000.
 © 2021 The Author(s). This work is published and licensed by Dove Medical Press Limited. The
full terms of this license are available at https://www.dovepress.com/terms
and incorporate the Creative Commons Attribution
- Non Commercial (unported, 3.0) License.
By accessing the work you hereby accept the Terms. Non-commercial uses of the work are permitted
without any further permission from Dove Medical Press Limited, provided the work is properly
attributed. For permission for commercial use of this work, please see paragraphs 4.2 and 5 of our Terms.
© 2021 The Author(s). This work is published and licensed by Dove Medical Press Limited. The
full terms of this license are available at https://www.dovepress.com/terms
and incorporate the Creative Commons Attribution
- Non Commercial (unported, 3.0) License.
By accessing the work you hereby accept the Terms. Non-commercial uses of the work are permitted
without any further permission from Dove Medical Press Limited, provided the work is properly
attributed. For permission for commercial use of this work, please see paragraphs 4.2 and 5 of our Terms.