")
Back to Journals » Journal of Multidisciplinary Healthcare » Volume 15
Evaluation of miRNA-143 and miRNA-145 Expression and Their Association with Vitamin-D Status Among Obese and Non-Obese Type-2 Diabetic Patients
Authors Aladel A , Khatoon F, Khan MI, Alsheweir A, Almutairi MG , Almutairi SO, Almutairi FK, Osmonaliev K, Beg MMA
Received 2 October 2022
Accepted for publication 13 December 2022
Published 28 December 2022 Volume 2022:15 Pages 2979—2990
DOI https://doi.org/10.2147/JMDH.S391996
Checked for plagiarism Yes
Review by Single anonymous peer review
Peer reviewer comments 2
Editor who approved publication: Dr Scott Fraser
Alanoud Aladel,1 Fahmida Khatoon,2 Mohammad Idreesh Khan,3 Azzah Alsheweir,1 Malak Ghazi Almutairi,4 Sami Owaidh Almutairi,4 Faisal Khalid Almutairi,5 Kudaibergen Osmonaliev,6 Mirza Masroor Ali Beg6,7
1Department of Community Health Sciences, College of Applied Medical Sciences, King Saud University, Riyadh, Saudi Arabia; 2Biochemistry Department, College of Medicine, University of Ha’il, Ha’il, Saudi Arabia; 3Department of Clinical Nutrition, College of Applied Health Sciences in Ar Rass, Qassim University, Ar Rass, 51921, Saudi Arabia; 4Department of Clinical Nutrition, Almethnab General Hospital, Qassim Health Cluster, Ministry of Health, Al Mithnab, Saudi Arabia; 5Laboratory Department, Armed Forces Hospital in Qassim, Medical Services, Ministry of Defense Qassim Buraydah Al-Rass, Buraydah, Saudi Arabia; 6Faculty of Medicine, Alatoo International University, Bishkek, Kyrgyzstan; 7Centre for Promotion of Medical Research, Bishkek, Kyrgyzstan
Correspondence: Mirza Masroor Ali Beg, Email [email protected]
Objective: Growing epidemics of type-2 diabetes mellitus (T2DM) and obesity have become a serious health concern. Since miRNAs and vitamin levels affect the development and progression of numerous pathogenic diseases, including diabetes, the present study aimed to evaluate miRNA-143 and miRNA-145 expression and vitamin-D status among obese and non-obese T2DM patients.
Methods: The study included 100 clinically confirmed newly diagnosed obese and non-obese T2DM cases and 100 healthy subjects. Total RNA was extracted from collected blood samples and 100 ng of RNA was used for cDNA synthesis, then TaqMan assay was performed to evaluate the miRNA-143 and miRNA-145 relative expression.
Results: T2DM cases with hypertension (4.08 fold, p=0.01; 5.36 fold, p=0.009), fatigue (5.07 fold, p=0.04; 5.32 fold, p=0.03) and blurred vision (5.15 fold, p=0.01) showed higher miRNA-143 and miRNA-145 relative expression compared with their counterparts, respectively. A positive correlation was observed between miRNA-143 and miRNA-145 expression and decreased vitamin-D status in T2DM had significant association with impaired blood glucose fasting (p=0.001) and HDL level (p< 0.0001). Obese T2DM cases showed higher miRNA-143 and miRNA-145 expression compared with their counterparts. Vitamin-D deficient T2DM cases had higher miRNA-143 and miRNA-145 expression (5.69 fold, 5.91 fold) compared with insufficient (4.27 fold, p=0.03; 4.61 fold, p=0.03) and sufficient (4.08 fold, p=0.002; 4.29 fold, p=0.003). ROC curve for miRNA-143 and miRNA-145 between obese T2DM vs non-obese T2DM cases, at best possible cutoff value of 4.39 fold, 4.0 fold showed increased miRNA-143 and miRNA-145 expression, the sensitivity and specificity were 85%, 88% and 61%, 53% respectively (AUC=0.83, p< 0.0001; AUC=0.81, p< 0.0001).
Conclusion: Higher miRNA-143 and miRNA-145 expression could be a predictive indicator for obese T2DM cases, decreased status of vitamin-D was also significantly associated with impaired fasting blood sugar and HDL level, therefore it is important to evaluate the vitamin-D status among T2DM cases for better clinical outcome during the intervention.
Keywords: type 2 diabetes, obesity, vitamin-D, miRNA, expression, prognostic marker
Introduction
A disturbance in normal cell metabolism, the manner of transforming food to energy at cell level, is linked to metabolic disorders. T2DM and obesity have been linked to changes in cell metabolism1 and obesity and type-2 diabetes are the two most serious public health issues.2 T2DM and obesity have a strong link3 and this accounts for a significant portion of the health costs associated with obesity, and T2DM and their complications have a socioeconomic burden on society.1 Particularly, it is an unavoidably progressive disease that leads to the worsening function of multiple organs and systems, and it is an independent risk factor for coronary artery disease.4
Decreased beta cell insulin secretion or reduced insulin sensitivity mediated glucose uptake are the symptoms of type-2 diabetes.5 Pancreatic beta cells usually adapt to changes in metabolic load, beta cell failure can be inherited, and acquired loss of beta cell mass, primarily due to beta cell apoptosis in diabetes is observed.6
MiRNAs regulate insulin resistance in liver and hepatocytes, a study by Jordan et al of livers of diabetic rats observed impaired glucose metabolism with increased miRNA-143.7 Microarray investigation of metabolic syndrome patients compared with healthy control group (serum and urine sample) showed higher circulating miRNA-143 expression.8
A previous study has demonstrated that miR-145-5p is enriched in diabetic patients, and may represent a novel candidate biomarker.9
However, a growing number of studies on miRNAs and human diseases have revealed that these molecules play an important role in regulating cellular pathways. It is reasonable to conclude that miRNAs play a critical role in human diseases.10 Vitamin-D primarily affects the musculoskeletal system and helps maintain calcium homeostasis and deficiency has been linked with a number of chronic diseases, including diabetes.11 Evidence from both human and animal studies has revealed how the connection between low vitamin-D levels affects insulin sensitivity and glucose homeostasis12 and vitamin-D deficiency has been commonly observed in diabetic subjects.13 With a multiethnic population, Saudi Arabia has a high prevalence of T2DM and widespread concerns about vitamin-D deficiency.14 Therefore, we aimed to evaluate the expression and prognostic efficacy of miR143 and miR-145 and their association with vitamin-D status among obese and non-obese T2DM cases.
Methodology
Subject Recruitment, Blood Collection, and Total RNA Extraction
A total of 100 T2DM cases (obese and non-obese) and 100 healthy participants were included in the present case–control study from Saudi Arabia. Patient inclusion criteria were newly diagnosed T2DM patients, obese and non-obese T2DM, hypertensive, non-hypertensive T2DM and the exclusion criteria included any malignancy, and any kidney or cardiac-related disorder. Fasting and post-prandial samples were collected in fluoride vials from all 100 T2DM subjects, and 1 mL of blood was collected in EDTA vials to measure HbA1c. T2DM was diagnosed by measuring fasting blood glucose (glucose level over 126 mg/dL) and postprandial blood glucose (2-hour blood glucose over 200 mg/dL). All study participants had a total of 2 mL of peripheral blood collected in EDTA vials for the Expression study. Whole blood was subjected to RBCs lysis, after that WBCs were used to collect total RNA by using Trizol® reagent (Thermo Scientific, USA) following manufacturer’s instructions using chloroform, isoamyl alcohol and further nuclease-free water was used to elute the sample and stored at −80°C. The A260/280 ratio was used to determine the purity and integrity of the total RNA, which was then stored at −80°C for further processing. This research study was ethically approved by the research ethics committee, Ministry of Health, Saudi Arabia, Approval No/reg. no: 607–43-1478. Written informed consent was obtained from all the participants.
Polyadenylation and cDNA Synthesis
Using the TaqMan Advance microRNA reverse transcription kit, 100 ng of total extracted RNA from each participant was polyadenylated using the enzyme Poly-A Polymerase, according to the manufacturer’s protocol (TaqMan, Thermo Scientific, USA). To switch poly (A) tailed miRNAs into cDNA using a reverse transcriptase enzyme and other essential reagents provided with the manufacturer kit, a universal RT primer and other essential reagents were added for cDNA synthesis.
Quantitative Real-Time PCR for miR-143 and miR-145 Expression
MiRNA-143 and miRNA-145 expression were quantified by quantitative real-time PCR (qRT-PCR) using cDNA as template. Expression calculation was done by using the TaqMan probes for miRNA-143 (Assay ID: 478713_mir), TaqMan probes for miRNA-145 (Assay ID: 477916_mir) for quantification, and U6 (001973) as an internal control along with TaqMan advanced master mix (4444556). The expression of miR-143 and miR-145 was studied using a 40-cycle protocol that included a first denaturation step at 94°C for 50 seconds, annealing at 60°C for 50 seconds, and extension at 72°C for 50 seconds, with the final reaction volume kept at 20 L and the final step in the extension process completed at 72°C for 10 minutes. For target amplification, a melting curve analysis was performed between the temperatures of 35°C and 90°C, and all processes were duplicated to avoid errors with U6 as the in-house control.
Statistical Analysis
SPSS 21.0 and GraphPad Prism software version 6.05 were used for statistical analysis. To examine the significant differences between the groups, the Mann–Whitney U-test (2 groups) and the Kruskal–Wallis test (>2 groups) were used. The relative cycle threshold (Ct) method was used to show the expression level of miR-143 and miR-145. All values were normalized relative to the control values, which were depicted as a value of 1 and expression was defined as up or down-regulated as a result of more than or less than one. The p<0.05 was considered significant.
Results
Demographics of the Participants
All the demographic characteristics of 100 cases of T2DM and 100 healthy controls is depicted in Table 1. In brief, 72% of T2DM cases were males and 28% were females while in healthy controls 70% were males and 30% were females. Age of diagnosis of T2DM were categorized into 2 groups, ≤ 45 years were 40% and > 45 were 60% while among the healthy control ≤ 45 years were 38% and > 45 were 62%. Details are given in Table 1.
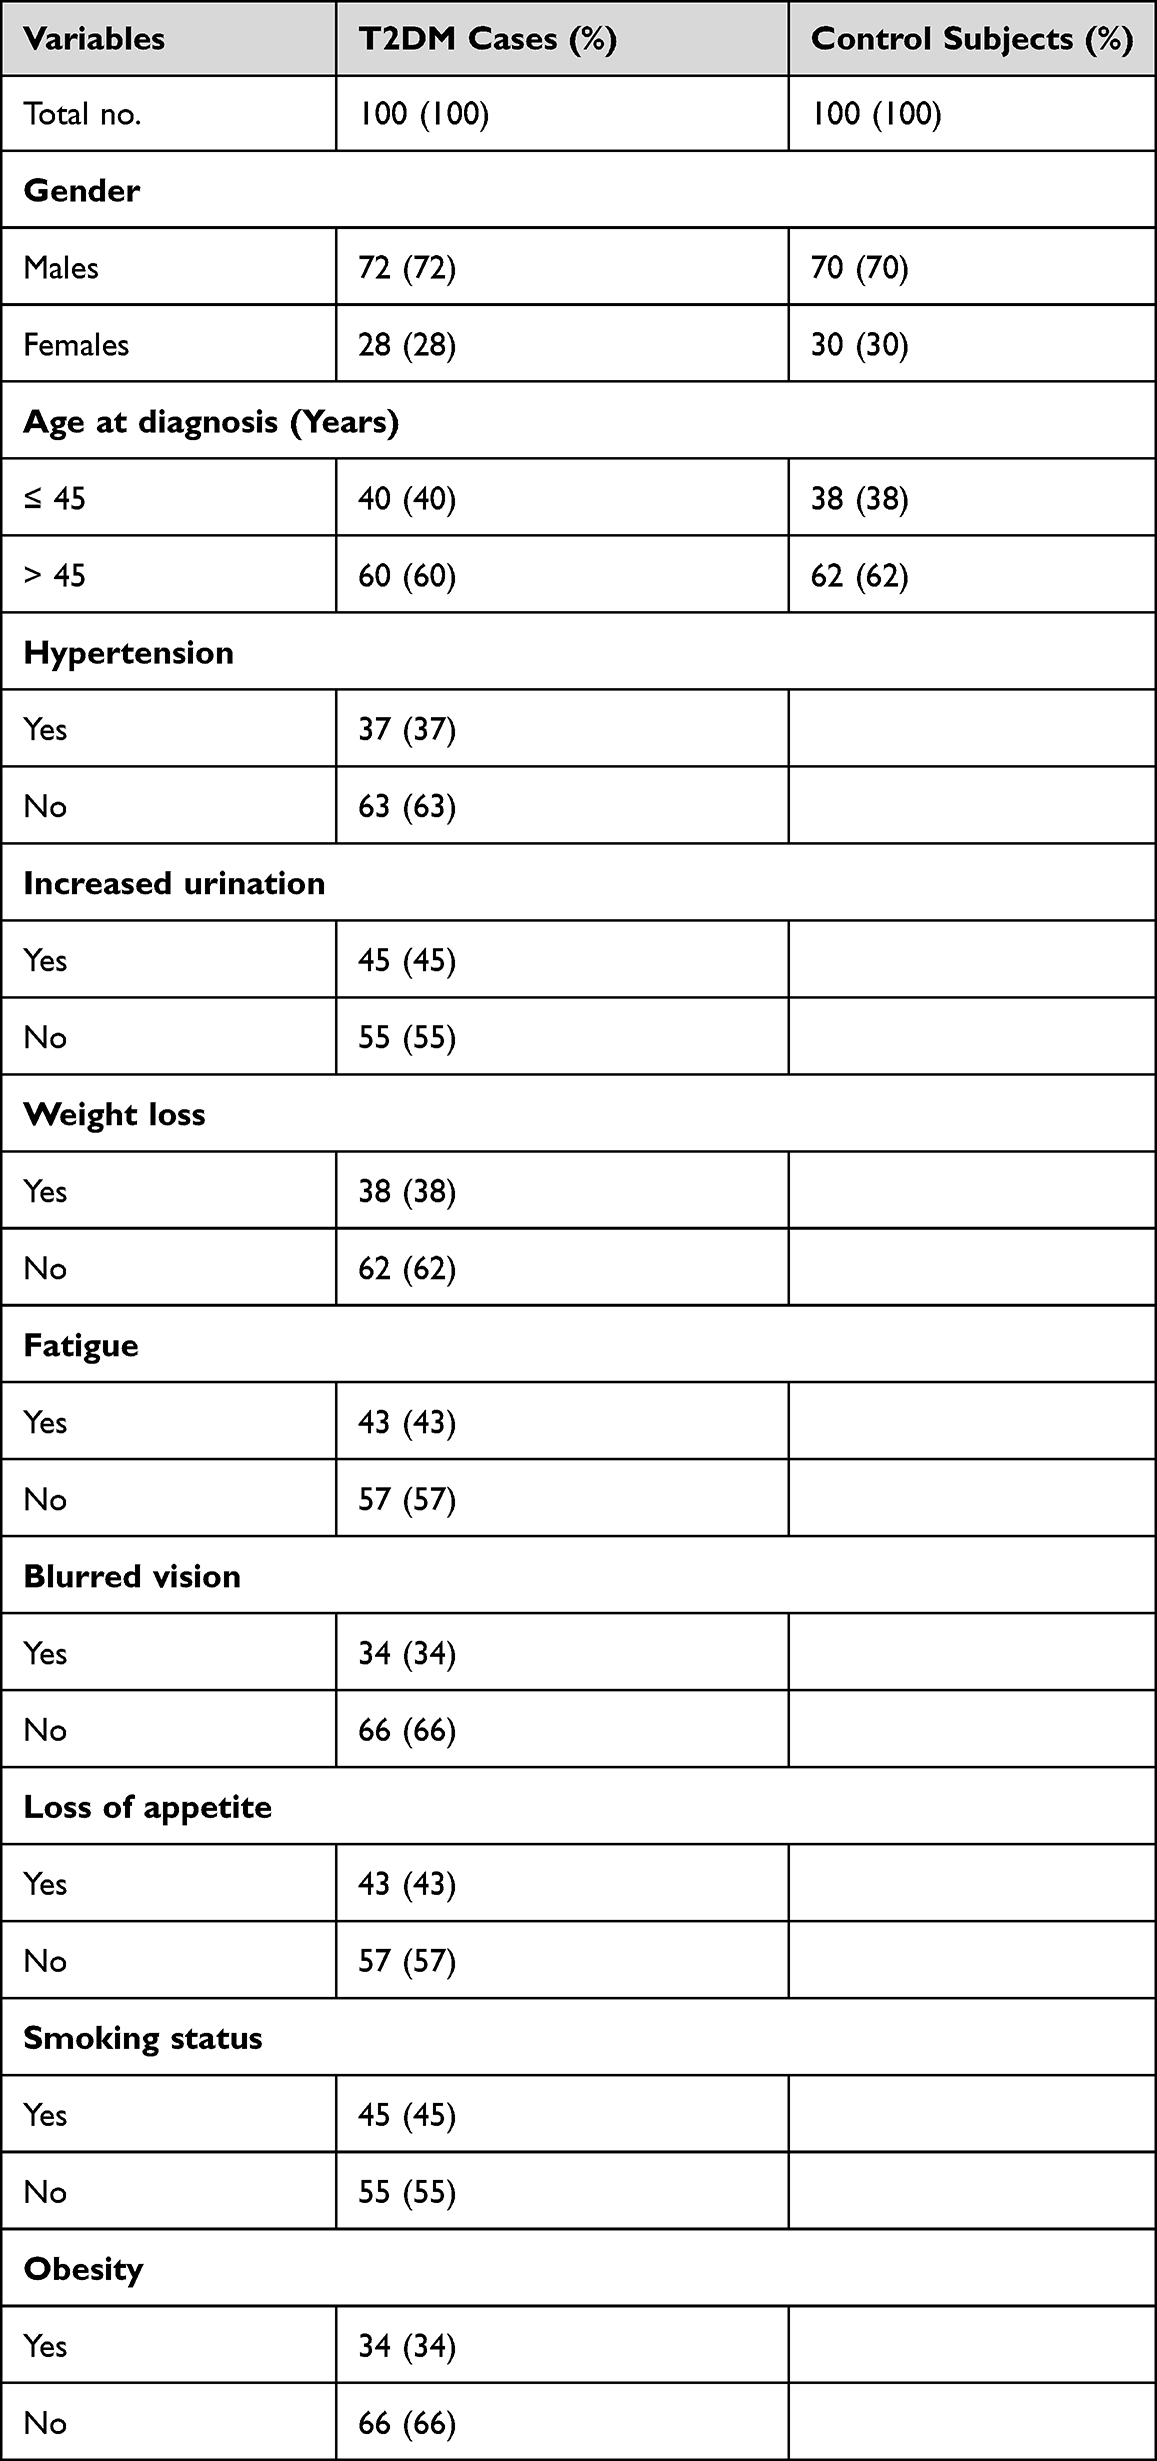 |
Table 1 Demographic Characteristics of Type 2 Diabetes Mellitus Cases and Healthy Controls |
Association of miRNA-143 Expression with Different Characteristics
Relative quantification method was used to calculate the miRNA-143 expression and compared with healthy controls overall 5.23 fold increased miRNA-143 expression was observed among the T2DM cases (Table 2). It was observed that T2DM cases with hypertension, fatigue, blurred vision showed 4.08 fold (p=0.01), 5.07 fold (p=0.04) and 5.15 fold (p=0.01) miRNA-143 expression compared with T2DM cases without hypertension, fatigue, blurred vision who showed significantly lower expression. No significant association of miRNA-143 expression was observed with age, gender, increased urination, weight loss, loss of appetite, or smoking status.
 |
Table 2 Relative Expression of miRNA-143 Among Type 2 Diabetic Cases Compared with Healthy Controls |
Association of miRNA-145 Expression with Different Characteristics
Relative miRNA-143 expression was analyzed compared with healthy controls and overall 6.55 fold relative expression was observed among the T2DM cases (Table 3). It was observed that the miRNA-154 expression was higher in T2DM cases with hypertension (5.36 fold, p=0.009) and fatigue (5.32 fold, p=0.03) compared with its contrast.
 |
Table 3 Relative Expression of miRNA-145 Among Type 2 Diabetic Cases Compared with Healthy Controls |
Correlation of miRNA-143, and miRNA-145 Among T2DM Cases
A correlation analysis was performed to analyze the association between miRNA-143 and miRNA-145 expression among the T2DM cases (Figure 1). A significant positive correlation (r=0.63, p<0.0001) was observed between miRNA-143 and miRNA-145 expression suggesting that increase in expression of miRNA-143 would lead to increase in expression of miRNA-145 and vice versa among T2DM cases.
 |
Figure 1 Correlation between miRNA-143 and miRNA-145 expression among the T2DM cases. |
Correlation of miRNA-143, and miRNA-145 with Biochemical Parameters Among T2DM Cases
In the correlation analysis of miRNA-143 and miRNA-145 with biochemical parameters (Table 4), we observed miRNA-143 showed negative correlation with HDL (r = −0.26, p=0.008) and miRNA-145 showed positive correlation with TG (r = −0.23, p=0.01).
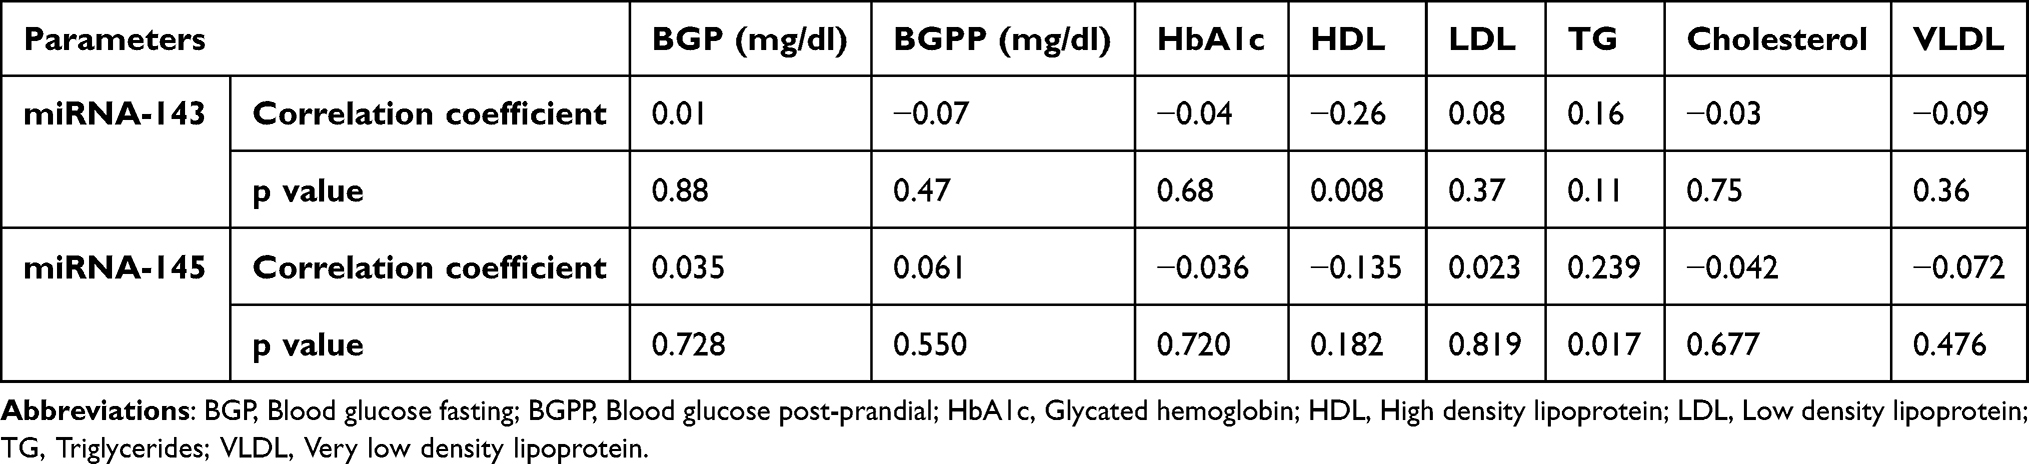 |
Table 4 Correlation Analysis and Coefficient of miRNA-143 and miRNA-145 with Biochemical Parameters Among T2DM |
Biochemical Parameters and Vitamin-D Status Among T2DM Cases
T2DM with different vitamin-D status (deficiency, insufficiency and sufficiency) was used to compare the biochemical parameters (blood glucose fasting, blood glucose post-prandial, HbA1c, HDL, LDL, TG, cholesterol, VLDL) (Table 5). It was observed that vitamin-D status of the T2DM cases had a significant association with blood glucose fasting and HDL level. T2DM cases with vitamin deficiency had 252.21 mg/dl blood glucose fasting, T2DM cases with vitamin insufficiency had 232.22 mg/dl while sufficient cases showed 226.0mg/dl (p=0.001). It was also observed that the T2DM cases with vitamin-D deficiency had 36.08mg/dl, T2DM cases with vitamin insufficiency had 46.50 mg/dl while sufficient cases showed 49.80 mg/dl (p<0.0001).
 |
Table 5 Comparison of Biochemical Parameters with Vitamin-D Status Among the T2DM Cases |
MiRNA-143 and miRNA-145 Among Obese and Non-Obese T2DM Cases
Comparison of miRNA-143 and miRNA-145 expression was done between obese T2DM and non-obese T2DM cases (Figure 2A and B). It was observed that the obese T2DM cases had 6.19 fold relative expression of miRNA-143 while non-obese T2DM cases had 3.90 fold relative expression of miRNA-143 (p<0.0001). The relative expression of miRNA-145 among the obese T2DM cases was 6.81 fold while non-obese T2DM cases had 3.96 fold relative expression, this showed a statistically significant difference (p<0.0001).
 |
Figure 2 MiRNA expression among obese and non-obese T2DM cases. (A) miRNA-143, (B) miRNA-145. |
MiRNA-143 and miRNA-145 Expression with Vitamin Status Among Obese and Non-Obese T2DM Cases
MiRNA143 and miRNA145 was evaluated with regard to vitamin-D status among the T2DM cases (Figure 3A and B). It was observed that the vitamin-D deficient T2DM cases had higher miRNA-143 expression (5.69 fold) compared with insufficient (4.27 fold, p=0.03) and sufficient (4.08 fold, p=0.002). It was also observed that the vitamin-D deficient T2DM cases had higher miRNA-145 expression (5.91 fold) compared with insufficient (4.61 fold, p=0.03) and sufficient (4.29 fold, p=0.003).
 |
Figure 3 MiRNA expression with vitamin-D status. (A) miRNA-143, (B) miRNA-145. |
Prognostic Importance of miRNA-143 and miRNA-145 Expression with regard to Obese and Non-Obese T2DM Cases
T2DM cases were divided into two groups based on obesity (obese and non-obese T2DM cases) and ROC curves were analyzed to see if miRNA-143 and miRNA-145 could be used as a predictive/prognostic biomarker for T2DM cases (Figure 4A and B, Table 6). When a ROC curve was plotted for miRNA-143 between obese T2DM cases and non-obese T2DM cases, the sensitivity and specificity were 85% and 61%, respectively, at the best possible cutoff value of 4.39 fold increased miRNA-143 expression (AUC=0.83, p<0.0001). The sensitivity and specificity for miRNA-145 in obese T2DM cases vs non-obese T2DM cases were 88% and 53%, respectively, at the best possible cutoff value of 4.0 fold increased miRNA-145 expression (AUC=0.81, p<0.0001).
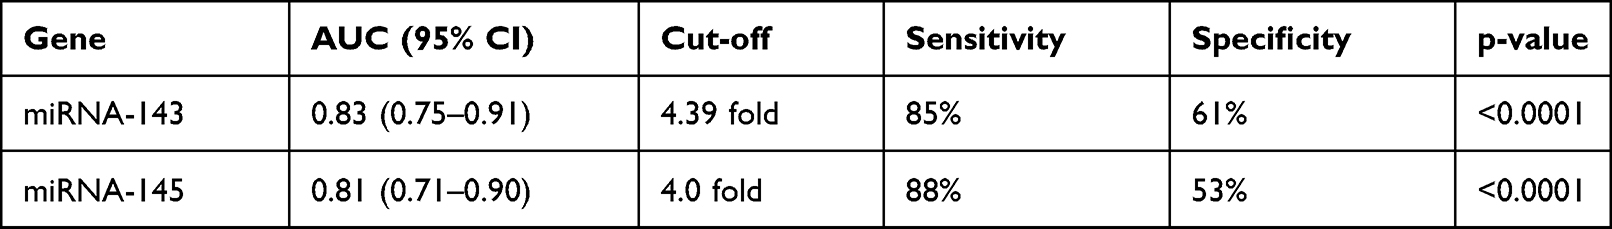 |
Table 6 AUC, Sensitivity, Specificity and Cutoff for miRNA-143 and miRNA-145 Between Obese and Non-Obese T2DM Cases |
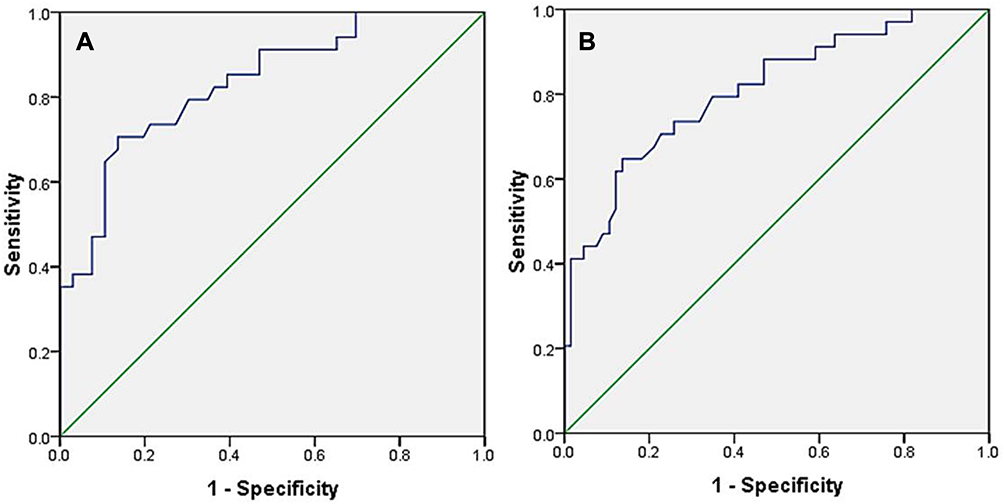 |
Figure 4 ROC curve analysis for prognostic importance between non-obese and obese T2DM cases. (A) AUC for miRNA-143, (B) AUC for miRNA-145. |
Discussion
Lifestyle changes have been shown to be very effective in prevention of T2DM,15 workout intervention programs are cost-effective and have other health benefits16 and better insulin sensitivity is linked with physical activity.17 Exercise can help to delay or prevent the onset of T2DM and minimize the medication use18 and intensity; style of exercise has an impact on the individual’s better outcome.19 It has been observed that miRNA-143 has been linked to the development of type 2 diabetes16 and obesity increases the miRNA-143 expression and inhibits insulin-mediated AKT phosphorylation in obese mice’s liver and adipose tissue.20 TGF-induced miRNA-143 and miRNA-145 stimulate the switch of vascular smooth muscle cells to a dysfunctional phenotype particular to T2DM.21 Overexpression of miRNA-143 in mice damages insulin-stimulated AKT activation, and it is upregulated in the liver of genetic and dietary obese mouse models.7
Present research work also observed increased miRNA-143 expression, and found it to be associated with hypertension, fatigue and blurred vision among the T2DM cases. MiRNA-143 has also been linked to an increase in body weight, as well as glucose homeostasis and impaired insulin-stimulated AKT activation.22 Jordan et al found that in a diet-induced obese mouse model, the expression of miRNA-143 and miRNA-145 is upregulated.7 Xie et al reported that the TNF-treatment in adipose tissue regulates the intensity of adipose-related miRNAs such as miR-143.23 In the same way higher miRNA-145 expression was observed to be associated with hypertension and fatigue among the T2DM cases. A positive correlation was observed between miRNA-143 and miRNA-145 expression suggesting increase or decrease in miRNA-143 expression would lead increase or decrease miRNA-145 expression. Changes in the expression of miRNA143 and miRNA-145 was observed among T2DM cases with and without obesity, obese T2DM cases showed higher miRNA-143 and miRNA-145 expression compared with non-obese T2DM cases. It suggested that obesity influences the upregulation of miRNA-143 and miRNA-145 expression.
ROC curve analysis showed that miRNA-143 and miRNA-145 upregulation had high sensitivity suggesting this to be a prognostic marker for obesity prediction among the T2DM cases. In the same way Esau et al confirmed that miR-143 usually triggers adipocyte differentiation and is overexpressed in obesity.24 Takanabe et al also reported that obese mice had a 3.3 fold higher expression of miRNA-143 in adipose tissue.22 The HFD-induced overexpression of miRNA-143 in the adipose tissue done by RT-PCR.25 In the context of T2DM macrovascular complications, these are linked with aberrant miRNA-145 expression to saphenous vein smooth muscle cell senescence.26 Both miRNA-143 and miRNA-145 promote the transition of vascular smooth muscle cells to a dysfunctional phenotype associated with T2DM.21 Obesity increases miRNA-143 expression, which inhibits insulin-stimulated AKT phosphorylation in the liver and adipose tissue of obese mice and suggests that miRNA-143 is involved in the development of T2DM.20 Studies have shown that T2DM cases or impaired glucose tolerance had significantly poorer vitamin-D levels (25(OH)D).27,28 Lack of vitamin-D has been associated with impaired insulin response and excretion can occur in T2DM.29,30 A study observed the poor vitamin-D status was linked with obesity and diabetes.31 Studies have examined the link between vitamin-D status and the risk of developing T2DM, and found that vitamin-D deficiency is a risk factor for the development of T2DM.32,33 Research revealed that poor vitamin-D status contributes to diabetes-related complications such as retinopathy, nephropathy, and peripheral neuropathy.34 Vitamin-D deficiency is prevalent in type 2 diabetes35 and higher blood glucose levels had been linked with low vitamin-D among T2DM cases.36,37 It has been suggested that vitamin-D deficiency among T2DM has a strong connection with control of glycemia and it has been suggested that reduced risk of developing T2DM is linked with sufficient serum vitamin-D levels.38 It has been also observed that the vitamin-D deficiency linked with T2DM cases had higher miRNA-143 and miRNA-145 expression. Present study also observed vitamin-D deficiency linked with higher FBG, higher miRNA-143 and miRNA-145 expression and lower HDL level among the T2DM cases.
Conclusion
Obese T2DM cases had higher miRNA-143 and miRNA-145 expression and ROC curve analysis showed that miRNA-143 and miRNA-145 expression could be a predictive marker for obese T2DM cases. Decreased vitamin-D status may cause the increased FBG, higher miRNA-143 and miRNA-145 expression and decreased HDL level. Therefore, it is important to evaluate the vitamin-D status among the T2DM cases and vitamin-D intervention could be made for better T2DM management.
Data Sharing Statement
The corresponding author can provide the datasets that were used and/or analyzed during this study upon request.
Ethics and Informed Consent
The research ethics committee of the Ministry of Health, K.S.A., gave their approval to this study. Before the study began, participants gave their written informed consent. The study was carried out in accordance with the Declaration of Helsinki and all ethical principles concerning human experimentation were followed.
Acknowledgments
This research project was supported by a grant from the “Research Center of the Female Scientific and Medical Colleges”, Deanship of Scientific Research, King Saud University.
Disclosure
The authors declare no conflicts of interest in this work.
References
1. Singla P, Bardoloi A, Parkash AA. Metabolic effects of obesity: a review. World J Diabetes. 2010;1(3):76. doi:10.4239/wjd.v1.i3.76
2. Zimmet P, Alberti KG, Shaw J. Global and societal implications of the diabetes epidemic. Nature. 2001;414:782–787. doi:10.1038/414782a
3. Astrup A, Finer N. Redefining type 2 diabetes: ‘diabesity’ or ‘obesity dependent diabetes mellitus’? Obes Rev. 2000;1:57–59. doi:10.1046/j.1467-789x.2000.00013.x
4. National Institute of Diabetes and Digestive and Kidney Diseases (NIDDK). National Diabetes Statistics: complications of diabetes in the United States; 2004. Available from http://diabetes.niddk.nih.gov/DM/PUBS/statistics/#complications.
5. Lazar MA. How obesity causes diabetes: not a tall tale. Science. 2005;307:373–375. doi:10.1126/science.1104342
6. Rhodes CJ. Type 2 diabetes—a matter of beta-cell life and death? Science. 2005;307:380–384. doi:10.1126/science.1104345
7. Jordan SD, Krüger M, Willmes DM, et al. Obesity-induced overexpression of miRNA-143 inhibits insulin-stimulated AKT activation and impairs glucose metabolism. Nat Cell Biol. 2011;13(4):434–446. doi:10.1038/ncb2211
8. Xihua L, Shengjie T, Weiwei G, et al. Circulating miR-143-3p inhibition protects against insulin resistance in Metabolic Syndrome via targeting of the insulin-like growth factor 2 receptor. Transl Res. 2019;205:33–43. doi:10.1016/j.trsl.2018.09.006
9. Barutta F, Tricarico M, Corbelli A, et al. Urinary exosomal microRNAs in incipient diabetic nephropathy. PLoS One. 2013;8(11):e73798. PMID: 24223694; PMCID: PMC3817183. doi:10.1371/journal.pone.0073798
10. Cho WC. MiRNAs in cancer – from research to therapy. Biochim Biophys Acta. 1805;2010:209–217.
11. Nakashima A, Yokoyama K, Yokoo T, Urashima M. Role of vitamin D in diabetes mellitus and chronic kidney disease. World J Diabetes. 2016;7:89–100. doi:10.4239/wjd.v7.i5.89
12. Dhas Y, Banerjee J, Damle G, Mishra N. Association of vitamin D deficiency with insulin resistance in middle-aged type 2 diabetics. Clin Chim Acta. 2019;492:95–101. doi:10.1016/j.cca.2019.02.014
13. Hussain Gilani SY, Bibi S, Siddiqui A, Ali Shah SR, Akram F, Rehman MU. Obesity and diabetes as determinants of vitamin D deficiency. JAMC. 2019;31:432–435.
14. Meo SA. Prevalence and future prediction of type 2 diabetes mellitus in the Kingdom of Saudi Arabia: a systematic review of published studies. J Pakistan Med Assoc. 2016;66(6):722–725.
15. Praet SF, van Loon LJ. Exercise: the brittle cornerstone of type 2 diabetes treatment. Diabetologia. 2008;51:398–401. doi:10.1007/s00125-007-0910-y
16. Pedersen BK, Saltin B. Exercise as medicine—Evidence for prescribing exercise as therapy in 26 different chronic diseases. Scand J Med Sci Sports. 2015;25(Suppl. S3):1–72. doi:10.1111/sms.12581
17. Hawley JA, Lessard SJ. Exercise training-induced improvements in insulin action. Acta Physiol. 2008;192:127–135. doi:10.1111/j.1748-1716.2007.01783.x
18. Zanuso S, Sacchetti M, Sundberg CJ, Orlando G, Benvenuti P, Balducci S. Exercise in type 2 diabetes: genetic, metabolic and neuromuscular adaptations. A review of the evidence. Br J Sports Med. 2017;51:1533–1538. doi:10.1136/bjsports-2016-096724
19. Montero D, Lundby C. Refuting the myth of non-response to exercise training: ‘non-responders’ do respond to higher dose of training. J Physiol. 2017;595:3377–3387. doi:10.1113/JP273480
20. Li B, Fan J, Chen N, Novel A. Regulator of Type II Diabetes: microRNA-143. Trends Endocrinol Metab. 2018;29:380–388. doi:10.1016/j.tem.2018.03.019
21. Riches K, Alshanwani AR, Warburton P, et al. Elevated expression levels of miR-143/5 in saphenous vein smooth muscle cells from cases with Type 2 diabetes drive persistent changes in phenotype and function. J Mol Cell Cardiol. 2014;74:240–250. doi:10.1016/j.yjmcc.2014.05.018
22. Takanabe R, Ono K, Abe Y, et al. Up-regulated expression of microRNA-143 in association with obesity in adipose tissue of mice fed highfat diet. Biochem Biophys Res Commun. 2008;376(4):728–732. doi:10.1016/j.bbrc.2008.09.050
23. Xie H, Sun L, Lodish HF. Targeting microRNAs in obesity. Expert Opin Ther Targets. 2009;13:1227–1238. doi:10.1517/14728220903190707
24. Esau C, Kang X, Peralta E, et al. MicroRNA-143 regulates adipocyte differentiation. J Biol Chem. 2004;279(50):52361–52365. doi:10.1074/jbc.C400438200
25. Nazari M, Saberi A, Karandish M, Jalali MT. Adipose tissue miRNA level variation through conjugated linoleic acid supplementation in diet-induced obese rats. Adv Clin Exp Med. 2018;27(11):1477–1482. doi:10.17219/acem/93728
26. Hemmings KE, Riches-Suman K, Bailey MA, O’Regan DJ, Turner NA, Porter KE. Role of MicroRNA-145 in DNA damage signalling and senescence in vascular smooth muscle cells of type 2 diabetic cases. Cells. 2021;10:919. doi:10.3390/cells10040919
27. Gao Y, Zheng T, Ran X, et al. Vitamin D and incidence of prediabetes or type 2 diabetes: a four-year follow-up community-based study. Dis Markers. 2018;2018:1926308. doi:10.1155/2018/1926308
28. Fu J, Han L, Zhao Y, et al. Vitamin D levels are associated with metabolic syndrome in adolescents and young adults: the BCAMS study. Clin Nutr. 2019;38:2161–2167. doi:10.1016/j.clnu.2018.08.039
29. Lips P, Eekhoff M, van Schoor N, et al. Vitamin D and type 2 diabetes. J Steroid Biochem Mol Biol. 2017;173:280–285. doi:10.1016/j.jsbmb.2016.11.021
30. Gulseth HL, Wium C, Angel K, Eriksen EF, Birkeland KI. Effects of vitamin D supplementation on insulin sensitivity and insulin secretion in subjects with type 2 diabetes and vitamin D deficiency: a randomized controlled trial. Diabetes Care. 2017;40(7):872–878. doi:10.2337/dc16-2302
31. Kabadi SM, Lee BK, Liu L. Joint effects of obesity and vitamin D insufficiency on insulin resistance and type 2 diabetes: results from the NHANES 2001– 2006. Diabetes Care. 2012;35(10):2048–2054. doi:10.2337/dc12-0235
32. Lu L, Bennett DA, Millwood IY, et al. Association of vitamin D with risk of type 2 diabetes: a Mendelian randomisation study in European and Chinese adults. PLoS Med. 2018;15:e1002566. doi:10.1371/journal.pmed.1002566
33. Muñoz-Garach A, García-Fontana B, Muñoz-Torres M. Vitamin D status, calcium intake and risk of developing type 2 diabetes: an unresolved issue. Nutrients. 2019;11:642. doi:10.3390/nu11030642
34. Usluogullari CA, Balkan F, Caner S, et al. The relationship between microvascular complications and vitamin D deficiency in type 2 diabetes mellitus. BMC Endocr Disord. 2015;15:33. doi:10.1186/s12902-015-0029-y
35. Al Hewishel MA, Bahgat M, Al Huwaiyshil A, Alsubie MA, Alhassan A. 25(OH)D serum level in non-diabetic and type II diabetic patients: a Cross-Sectional Study. Cureus. 2020;12(6):e8910. doi:10.7759/cureus.8910
36. Yang K, Liu J, Fu S, et al. Vitamin D status and correlation with glucose and lipid metabolism in Gansu Province, China. Diabetes Metab Syndr Obes. 2020;13:1555–1563. doi:10.2147/DMSO.S249049
37. Bhatt SP, Misra A, Gulati S, Singh N, Pandey RM. Lower vitamin D levels are associated with higher blood glucose levels in Asian Indian women with pre-diabetes: a population-based cross-sectional study in North India. BMJ Open Diabetes Res Care. 2018;6(1):e000501. doi:10.1136/bmjdrc-2017-000501
38. Parker J, Hashmi O, Dutton D, et al. Levels of vitamin D and cardiometabolic disorders: systematic review and meta-analysis. Maturitas. 2010;65:225–236. doi:10.1016/j.maturitas.2009.12.013
 © 2022 The Author(s). This work is published and licensed by Dove Medical Press Limited. The full terms of this license are available at https://www.dovepress.com/terms.php and incorporate the Creative Commons Attribution - Non Commercial (unported, v3.0) License.
By accessing the work you hereby accept the Terms. Non-commercial uses of the work are permitted without any further permission from Dove Medical Press Limited, provided the work is properly attributed. For permission for commercial use of this work, please see paragraphs 4.2 and 5 of our Terms.
© 2022 The Author(s). This work is published and licensed by Dove Medical Press Limited. The full terms of this license are available at https://www.dovepress.com/terms.php and incorporate the Creative Commons Attribution - Non Commercial (unported, v3.0) License.
By accessing the work you hereby accept the Terms. Non-commercial uses of the work are permitted without any further permission from Dove Medical Press Limited, provided the work is properly attributed. For permission for commercial use of this work, please see paragraphs 4.2 and 5 of our Terms.