Back to Journals » International Journal of Nanomedicine » Volume 17
Evaluation of Metformin Hydrochloride Tailoring Bilosomes as an Effective Transdermal Nanocarrier
Authors Salem HF, Nafady MM, Ali AA, khalil NM ![]() , Elsisi AA
, Elsisi AA
Received 21 October 2021
Accepted for publication 3 February 2022
Published 17 March 2022 Volume 2022:17 Pages 1185—1201
DOI https://doi.org/10.2147/IJN.S345505
Checked for plagiarism Yes
Review by Single anonymous peer review
Peer reviewer comments 2
Editor who approved publication: Professor Farooq A. Shiekh
Video abstract of "Metformin HCL Bilosomes as a Transdermal Nanocarrier" [ID 345505].
Views: 909
Heba F Salem,1 Mohammed M Nafady,2 Adel A Ali,1 Nermeen M Khalil,2 Amani A Elsisi1
1Department of Pharmaceutics & Industrial Pharmacy, Faculty of Pharmacy, Beni-Suef University, Beni-Suef, Egypt; 2Department of Pharmaceutics, Faculty of Pharmacy, Nahda University, Beni-Suef, Egypt
Correspondence: Mohammed M Nafady, Department of Pharmaceutics, Faculty of Pharmacy Nahda University, Beni-Suef, 62511, Egypt, Tel +01100719792, Email [email protected]; [email protected]
Introduction: Metformin hydrochloride (metformin HCL), a first-line drug treating diabetes type II, was known to cause severe gastritis, so seeking a non-oral dosage form was the new trend. Bilosomes are bilayer nano-vesicles of non-ionic surfactants embodying bile salts. In our study, bilosomes were investigated as an acceptable novel carrier for active targeting transdermal delivery of metformin HCL, circumventing its side effects.
Methods: Twelve bilosome formulations were prepared with solvent evaporation method with slight modification according to a 31 .22 full factorial design, and the optimized formulation was determined using Design -Expert 13 software (Stat-Ease, Inc., Minneapolis, Minnesota, USA) studying the effect of surfactant and bile salt types on the entrapment efficiency (EE), vesicle size (VS), polydispersity index (PDI), zeta potential (ZP), percentage of drug released within 24 h (R), and flux of drug permeated within 6 h (Jss) of vesicles. In addition, the optimized formulation was further evaluated to Fourier-transform infrared spectroscopy (FTIR), deformability index (DI), and transmission electron microscope (TEM) to ensure bilosomes formation, elasticity, and spherical shape, respectively.
Results: The resulting vesicles publicized EE from 56.21% to 94.21%, VS from 183.64 to 701.8 nm, PDI values oscillating between 0.33 and 0.53, ZP (absolute value) from 29 to 44.2 mV, biphasic release profile within 24 h from 60.62 and up to 75.28%, and permeation flux enhancement (198.79– 431.91 ng cm − 2 h− 1) in comparison with the non-formulated drug (154.26 ng cm − 2 h− 1). Optimized formulation was found to be F8 with EE = 79.49%, VS = 237.68 nm, ZP = 40.9 mV, PDI = 0.325, R = 75.28%, Jss = 333.45 ng cm− 2 h− 1 and DI = 6.5 with spherical self-closed non-aggregated vesicles and non-superimposed bands of its components in the FTIR.
Conclusion: Overall results showed that bilosome incorporation of metformin HCL improved permeation and offered a new nano-carrier for active transdermal delivery.
Keywords: metformin HCL, bile salts, bilosome, Design-Expert 13, permeation study, edge activators
Graphical Abstract:

Introduction
Metformin HCL is the first-line oral therapy of diabetes type II, which proved recently with an effect on the treatment of cancer, obesity, fatty liver, and cardiovascular diseases.1 Metformin HCL many formulations were studied such as conventional tablets, sustained release tablets,2 floatable gastro-retentive tablets.3 The main common side effect of metformin HCL is causing gastrointestinal tract (GIT) disturbance that can affect the patient compliance in the long term,4 so seeking a transdermal delivery system for metformin attracted researchers’ interest recently.5
The transdermal route has many advantages over the oral one as it does not affect GIT and avoids the first-pass hepatic effect.5 As with most drugs, metformin HCL cannot easily penetrate the stratum corneum obstacle of the skin.6 Metformin HCL was recently investigated for its transdermal delivery;7 a hydrogel micro-needles8 of metformin HCL based on hyaluronic acid required preparation at 60°c for drug release occurrence, as no release noticed at 40°c.6,8 Besides, the known disadvantages of micro-needles: accurate dosing inquiry and dependency on the stratum corneum thickness that may differ from one person to another.9 Metformin HCL loading on bilosomes as a nano-carrier can overcome this permeation problem avoiding the microneedle disadvantages, bilosome lipid structure, and ability to be absorbed in the interface and permeate through the lipid structure of the skin, altering its barrier function.10
Bilosomes are bi-layered bile salts-based vesicles that involve non-ionic surfactants and show superior enhancement of transdermal delivery over other nano-vesicles such as liposomes and niosomes.10 Bile salts act as edge activators with fluidizing effects and electrostatic stabilizers by the surface charge density addition, so yield highly stable vesicles for transdermal delivery.11 Bilosomes can be prepared by the solvent evaporation method.10
In this study, several variables were used to evaluate and finally detect the optimized formulation of metformin HCL bilosomes and evaluate the drug permeation flux using rat skin.
Materials and Methods
Experimental Factorial Design
Using Design-Expert 13 software (Stat-Ease, Inc., Minneapolis, Minnesota, USA), a 31 .22 full factorial multilevel-category design (Table 1) was adopted. The experimental design was used to investigate the response surfaces of the different independent factors giving a polynomial equation for the model and numerical determination of diverse solutions for the optimized formulation.12,13 Three independent factors combined effect (independent variables): surfactant type with two levels (S40 and S60), edge activator type (bile salts) with three levels (SC, SDC, and STC), and two levels of edge activator amount (8 and 14 mg). In addition, dependent variables (responses) included were: entrapment efficiency (EE), vesicle size (VS), polydispersity index (PDI), zeta potential (ZP), drug release percentage within 24 h (R), and flux of drug amount permeated within 6 h (Jss) was investigated. One–way ANOVA test was used to analyze the data for significance evaluation and interactions, p-value <0.05 was considered statistically significant.
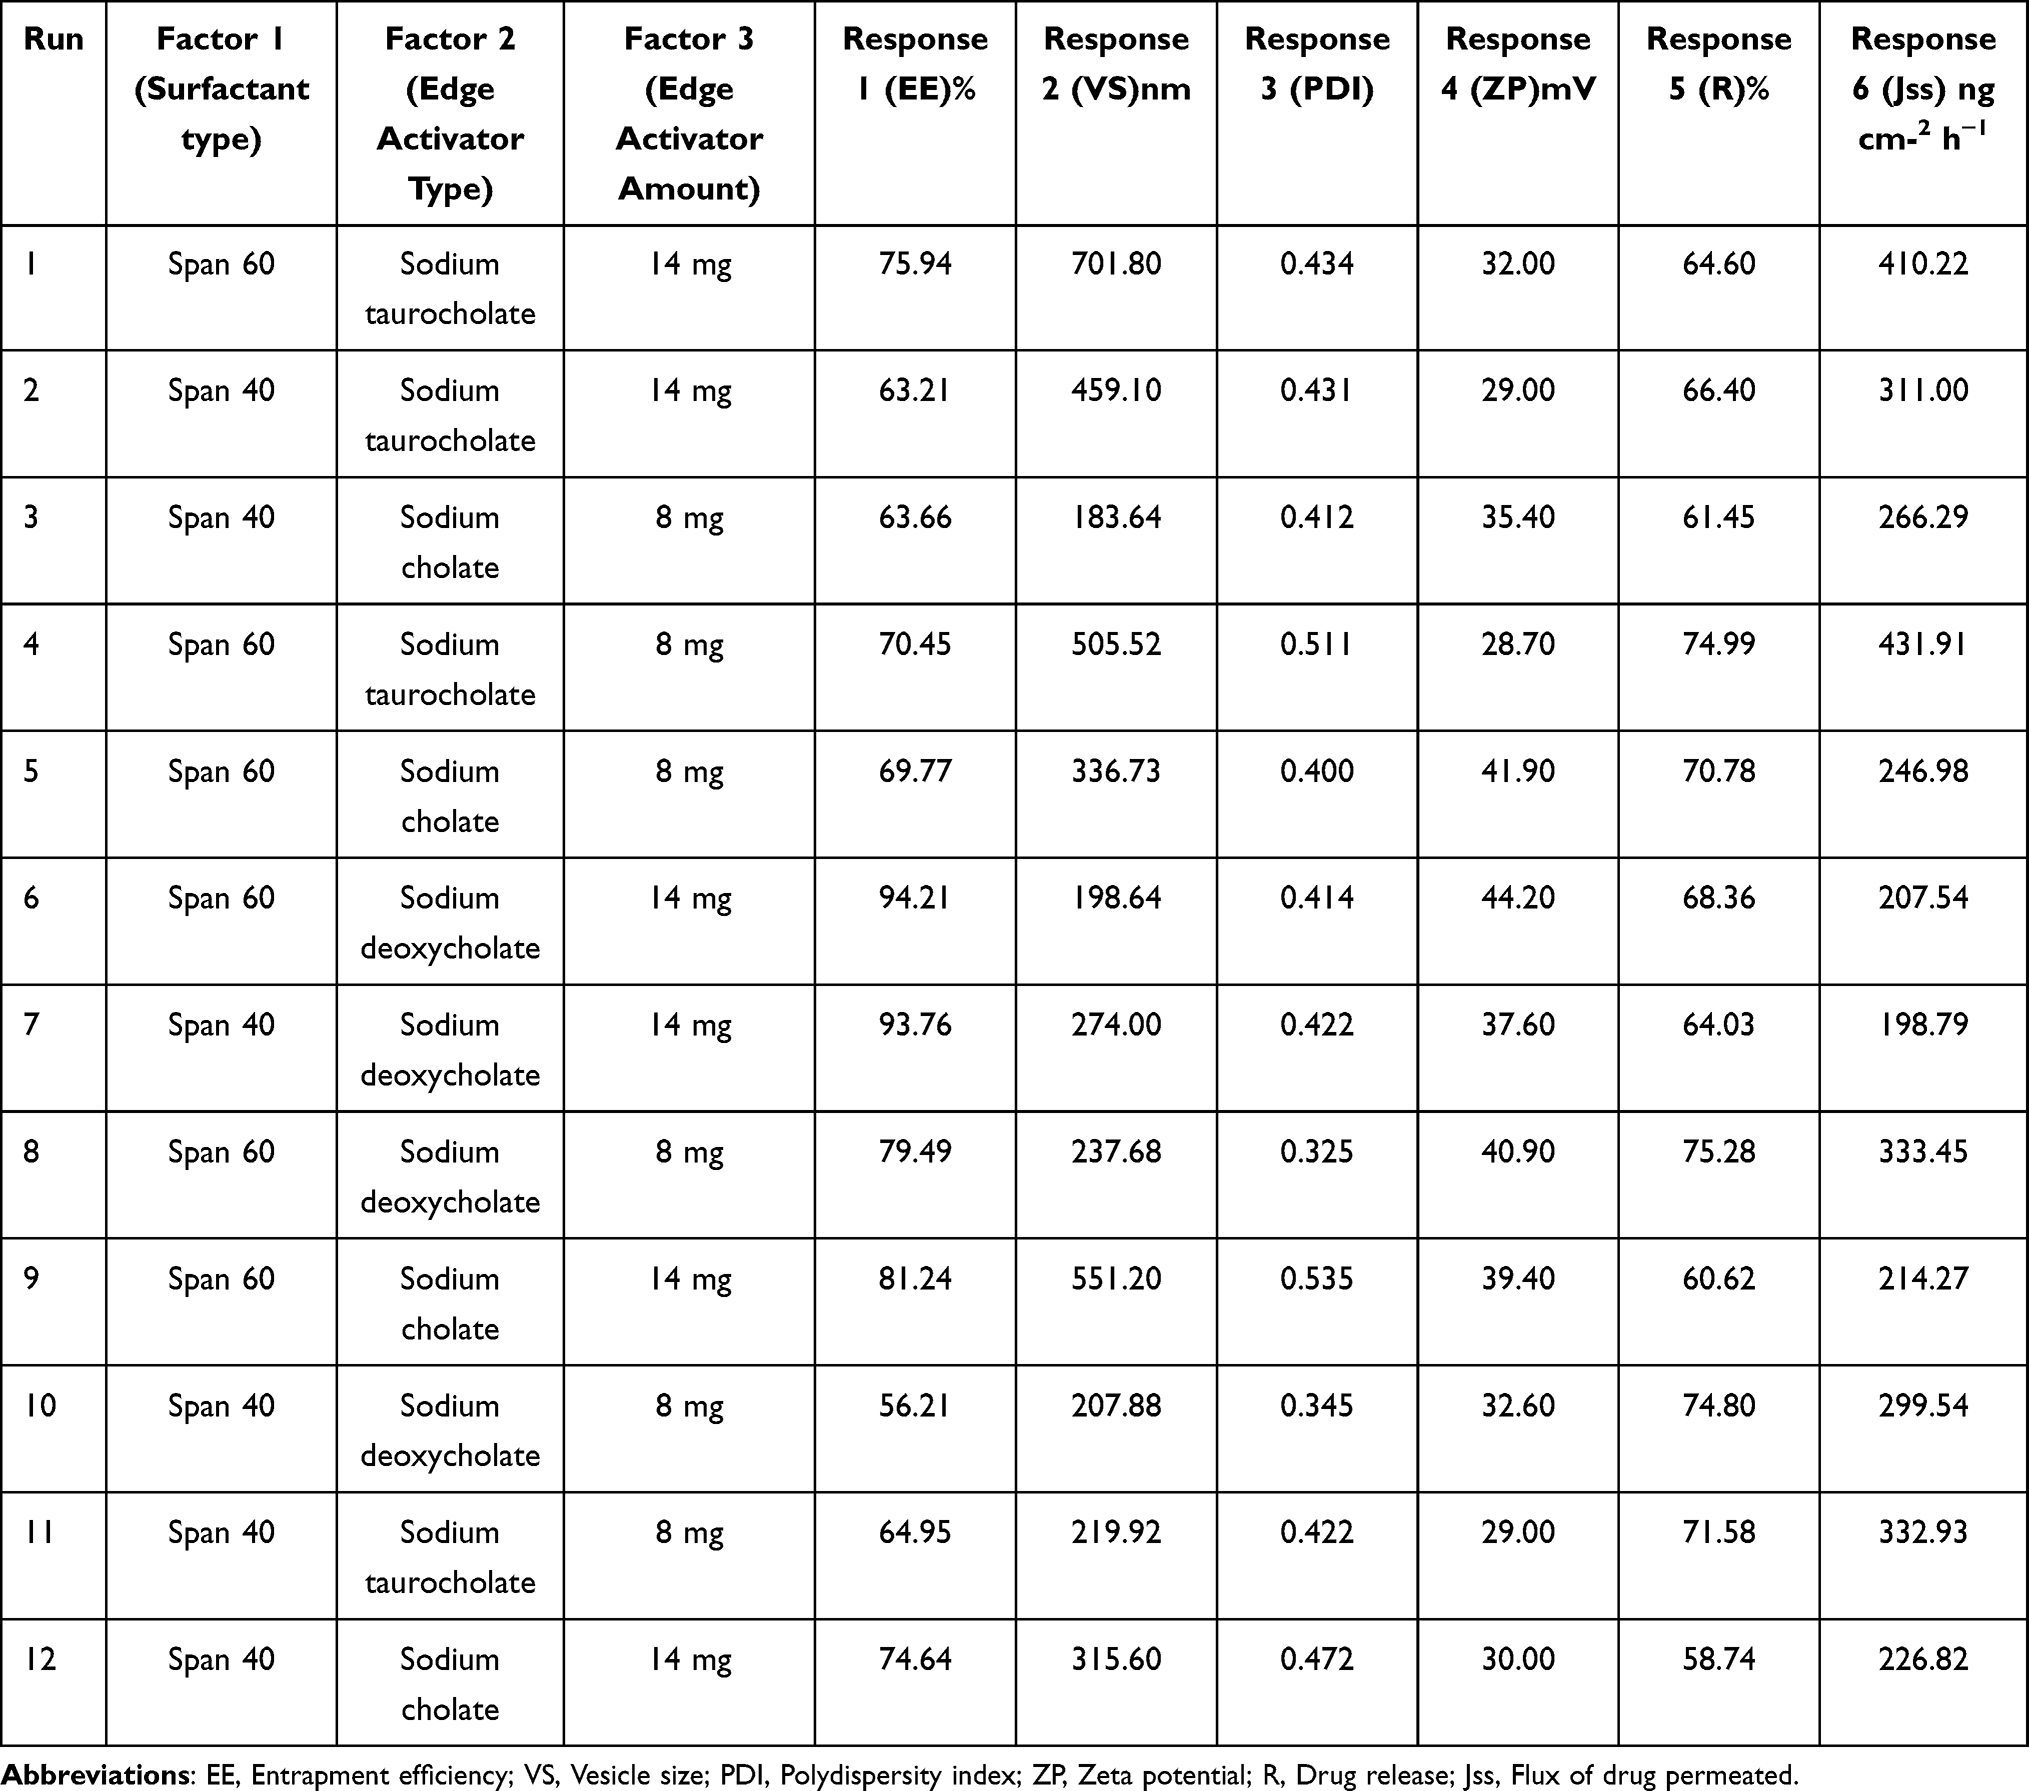 |
Table 1 Design Matrix Depicting the Experimental Runs and Values of Response Variables Obtained for Prepared Metformin HCL Bilosomes |
Preparation of Metformin HCL Bilosomes
Metformin HCL bilosomes were prepared using the solvent evaporation method with slight modification.14,15 Briefly, metformin HCL (600 mg) and cholesterol (14 mg) were dissolved in methanol: methylene chloride (1:2) after addition of surfactant and edge activator according to the design of each formulation (Table 1). Then, solvents were allowed to evaporate on a magnetic stirrer (IKA, C-MAG HS 7 digital, Germany) at 60°c with continuous agitation. After complete solvent evaporation, the resulting residue was hydrated with phosphate citrate buffer pH 4 to obtain the bilosome suspension. Skin pH range is from (4 to 6),16 and bilosome formulations were prepared and characterized using phosphate citrate buffer pH 4 due to metformin HCL’s tendency to be more soluble in acidic media.17
Entrapment Efficiency Percentage (EE %) of Metformin HCL Bilosomes
The efficiency of metformin HCL entrapment in bilosomes was evaluated in-directly using the ultra-centrifugation technique.14 Briefly, 1 mL of each bilosome formulation was centrifuged using cooling centrifuge apparatus (Sigma Laborzentrifugen D-37520, Osterode–am-Harz, Germany) at 4°C and 14,000 rpm for 90 min. The supernatant was separated and then analyzed for the free drug using a UV spectrophotometer (Shimadzu, UV-2401 PC, Kyoto Japan)15,18,19 at λ max = 233 nm (the specified metformin HCL wavelength according to the performed calibration curve). The entrapped drug concentration was determined using the regression equation of the standard curve developed in phosphate citrate buffer pH415,16 using a blank to avoid any interference. EE% was calculated using the following equation (Eq.1):

Where DT is the theoretical amount of metformin HCL, and DS is the detected amount.
Vesicle Size (VS), Polydispersity Index (PDI), and Zeta Potential (ZP) of Metformin HCL Bilosomes
The dynamic light-scattering technique was used to determine VS, PDI, and ZP for all bilosome formulations after a suitable dilution with distilled water using zeta seizer (Malvern ZetaSizer3000, UK) at a fixed angle of 90° at 25°C.20
In-Vitro Release of Metformin HCL Bilosomes
The amount of metformin HCL released from prepared bilosomes was determined using the modified USP Dissolution Tester apparatus II method (Paddle type-Erweka DT-720, Germany).14 Glass tubes with open endings were closed from one end with a well-tied 4.5 cm2 stretched cellophane membrane (immersed 24 h in the release medium) as a diffusion membrane, and bilosomes equivalent to 1 mg were then added. The tubes replaced the dissolution apparatus paddles, and the apparatus speed was set at 100 rpm. The temperature was maintained at 32 ± 0.5°C using 500 mL of phosphate citrate buffer pH 4 as a release milieu.15,16 Samples of 3 mL volume were withdrawn at a predetermined time interval (0.08, 0.16, 0.25, 0.5, 1, 2, 3, 4, 22, and 24 h) and immediately replenished with an equal volume of fresh milieu. UV spectrophotometer (Shimadzu, UV-2401 PC, Kyoto Japan)15,18,19 was used to analyze samples at λ max = 233 nm. R % was calculated from the linear regression equation (Eq. 2):

Permeation Study of Metformin HCL Bilosomes
The permeation profile of each bilosome formulation was determined using USP Dissolution Tester apparatus II (Paddle type-Erweka DT-720, Germany).15,21 The same method and experimental conditions of release test were used, replacing the cellophane membrane with a shaved abdominal area (4.5cm2) of male albino rat skin. A 200±20 g weight of albino rats was obtained from Nahda university animal facility and sacrificed by cervical dislocation, and then the abdominal area shaving and dissection were done with a razor. The skin was soaked in phosphate citrate buffer solution pH = 415,16 at 4°C for 1 h before the experiment’s launch.13,15 Experimental protocol was done according to Beni-Suef Animal Facility guidelines approved by the Pharmacology and Toxicology Department (Faculty of Pharmacy, Beni-Suef University, on 20 June 2009). In addition, it was based on the guidelines suggested by recommendations of the National Institutes of Health Guide for Care and Use of Laboratory Animals (Publication No 85–23, revised 1985).15 The cumulative percentage of permeated metformin HCL was calculated using Fick’s law (Eq.3):

Where Jss is the steady-state flux, dQ/dt is the permeation rate, (Q) is the cumulative permeated amount of metformin HCL at a time (t), and (A) is the application area (4.5 cm2). In other words, it was calculated from the slope of the plot of the cumulative amount of drug permeated per cm2.
Measurement of Vesicular Elasticity in Term of Deformability Index (DI) of Metformin HCL Bilosomes
Extrusion method22 was used to measure the elasticity of the optimized bilosome formulation after suitable dilution of the vesicles (about 10 folds). The extrusion process was done using a 200 nm pore size nylon filter (Jinteng Experiment Equipment Co., Ltd, Tianjin, China)11 under the constant pressure of 2.5 bar (Haug Kompressoren AG; Büchi Labortechnik AG, Flawil, Switzerland). The experiment was performed in triplicate to obtain the average value. The following equation was used to calculate the DI (Eq.4):23

Where DI is the deformability index, J is the weight of extrusion dispersion in 10 min, rv is the size of the extruded vesicles (nm), and rp is the membrane pore size (nm).
Fourier Transform Infrared Spectroscopy Study (FTIR) of the Optimized Metformin HCL Bilosome Formulation
Different components of the optimized bilosome formulation (F8) were analyzed using FTIR Spectrophotometer (BRUKER-ALPHA, Specac, Germany).15 In brief, 0.5 mL of the sample was placed just below the fixed probe of the FTIR and scanned over 3500–1000 cm−1 wavenumber region.
Transmission Electron Microscope (TEM) of the Optimized Metformin HCL Bilosome Formulation
The morphology of bilosome vesicles was observed by a high-resolution transmission electron microscope (HRTEM) (JEOL Co., JEM-1400, Japan) using the negative stain technique. A drop of optimized bilosome formulation was placed over a carbon-coated copper grid after suitable dilution with distilled water and using a phosphotungstic stain at an accelerating voltage of 160 KV.11
Results and Discussion
Factorial Design Analysis
Full factorial design is a suitable way to study the effect of different variables and interactions with the least number of trials.24 In this study, a 31 0.22 full factorial design was implemented and statistically analyzed using Design-Expert 13 (Multilevel- categoric factorial) software (Stat-Ease, Inc., Minneapolis, Minnesota, USA). The main effect was picked as the design model.
The coefficient of determination (R2) and the coefficient of variation (CV %) values provide valuable perceptions regarding the regression model. R2 (the goodness-of-fit of statistical analysis) does not indicate the precision or the causation relationship between the independent and dependent variables. CV% represents the ratio of the standard deviation to the mean that can be used in comparing variation degrees between different data series. Means can differ from one another, so both R2 and CV% should be considered with other variables in the statistical model.25
Adequate precision rates the signal-to-noise ratio. Precision >4 is desirable and mean the model can navigate the design space.18,26 In our study: R2, CV%, and adequate precision as listed in (Table 2) were used to evaluate the perfect insight and fitness of the design model to the experimental data.
 |
Table 2 Analysis of Variance and Fit Statistics of the Factorial Model |
The fitted models could be illustrated as regression equations (Eq. 4–9). A positive sign in the polynomial equations reveals that increasing the factor cause increase in the response and vice versa.15 3D-response surface plots were scrutinized to understand the interaction if present (Figure 1). Recognizing the analysis manner occurs using Box-Cox for power transformation (Figure 2) that determines the higher and lower confidence intervals (C.I.) of lambda (Table 3), the current lambda = 1. Accordingly, the statistical analysis was done on the original data.
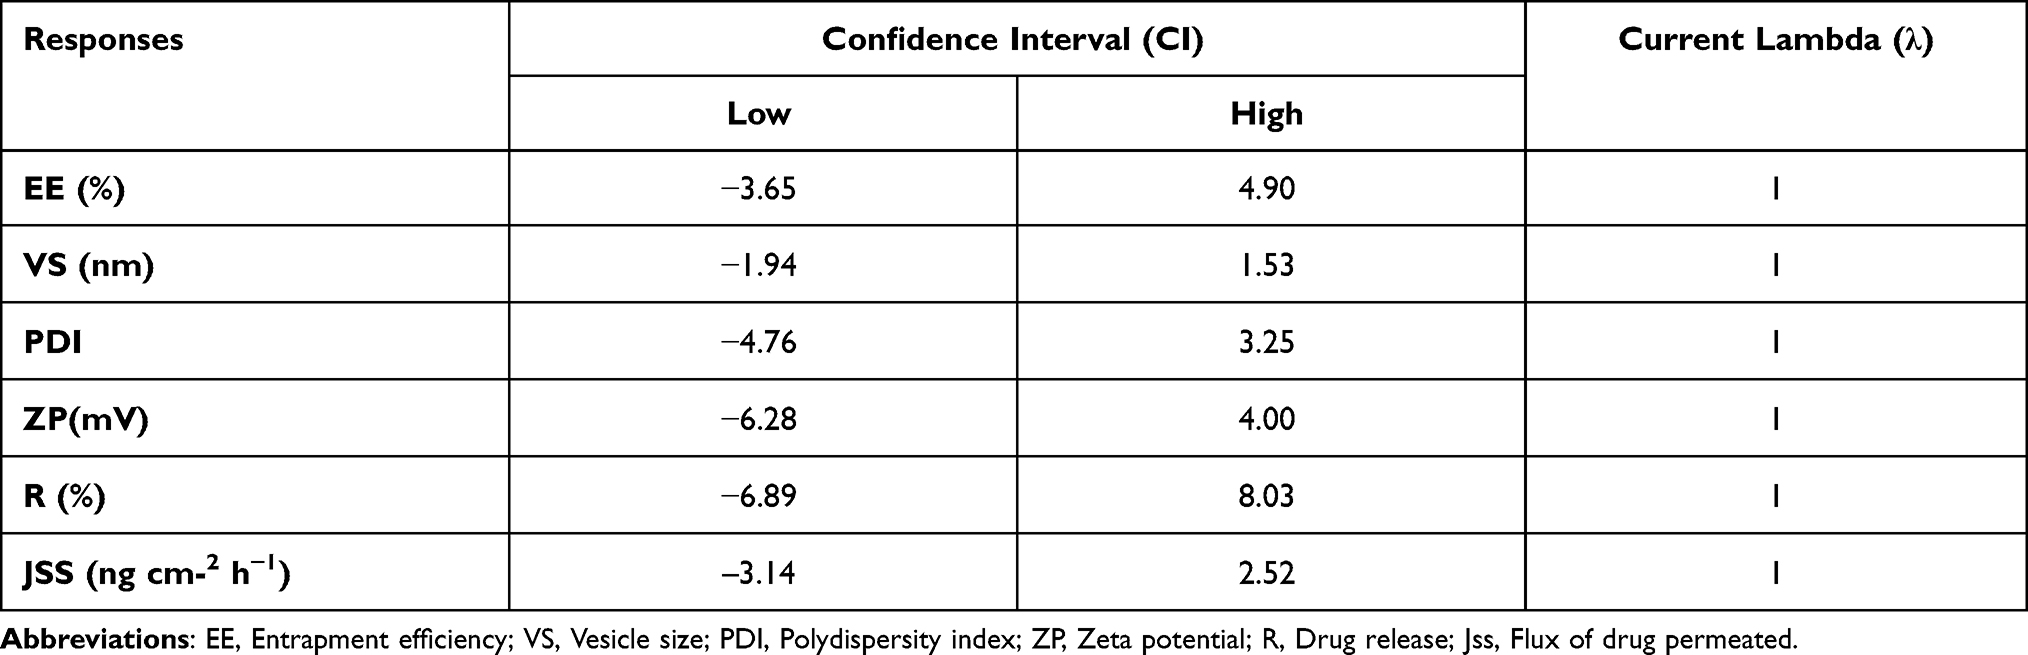 |
Table 3 Box-Cox Confidence Intervals of Different Responses |
 |
Figure 1 3D response surface plots showing the influence of surfactant type, bile salt type and bile salt amount of metformin hydrochloride bilosomes on different responses of EE: entrapment efficiency (A); VS: vesicle size (B); PDI: polydispersity index (C); ZP: zeta potential (D); R: drug release (E); Jss: flux of drug permeated (F). |
 |
Figure 2 Box-Cox plot of all responses. EE: entrapment efficiency (A); VS: vesicle size (B); PDI: polydispersity index (C); ZP: zeta potential (D); R: drug release (E); Jss: flux of drug permeated (F). |
Characterization of Bilosome Preparations
Entrapment Efficiency Percentage (EE %) of Metformin HCL Bilosomes
Despite metformin HCL’s hydrophilic nature, the prepared formulations showed EE from 56.21% to 94.21% (Table 1), which mirrors acceptable loading on the bilosome vesicles and minimal drug loss during preparation, that can be accredited to cholesterol addition that increases the bilosome bilayer viscosity and rigidity.27 Results showed a significant effect (p < 0.05) of the design model on EE % (Table 2).
Type of surfactant showed a positive impact on EE % (Eq. 5); bilosomes prepared using S60 exhibited higher EE % than those of S40 (Figure 1A), this may be attributed to three reasons: first, S60 longer saturated alkyl chain (C14) that gives a more stable bilosome bilayer,28 second, its lower HLB (Hydrophilic lipophilic balance) value (4.7) than S40 (HLB 6.7) that make it more hydrophobic and give better EE,29 and the third reason can be its room temperature solidity and higher phase transition temperature T°c (53°CT).30
The anionic nature of bile salts gives the vesicles negative charges leading to a high repulsion force that increases the bilosome inner core so highly entrap the hydrophilic drugs.31 Bilosomes prepared using SC and STC showed lower EE% than SDC. SDC increases the bilayer membrane elasticity and the drug solubility into the membrane due to its surface-active property32 and ability to integrate into the surface of the bilayer membrane, thus increasing the EE. The lower HLB value of SDC (16) compared to that of STC (22.1) and SC (18.0), this higher hydrophobicity acted as a barrier retarding the drug leakage from vesicles follow-on higher EE%.33 The average EE% in twelve formulations were 80.9%, 72.3%, and 68.6% for SDC, SC, and STC, respectively. Still, the bile salt effect found was insignificant (p = 0.15).
On the other hand, the bile salt amount showed a significant positive effect (p < 0.05) on EE% as the more bile salt amount (14mg), the more the entrapped drug obtained (Eq. 5). Increasing the bile salt increases the drug solubility in the dispersion media by forming mixed micelles and enhancing drug entrapment into the bilosome vesicles.13 Adequate precision for EE% was equal to 6.602 (Table 2), considered a good signal that this model can be used to navigate the design space. The final coded factor equation is:

Vesicle Size (VS), Polydispersity Index (PDI), and Zeta Potential (ZP) of Metformin HCL Bilosomes
Bilosomes VS of all formulations was found to be in a plausible nano-range of (183.64–701.8 nm) (Table 1) regarding the VS coded regression equation (Eq.6) the design model showed a significant effect (p < 0.05) on the bilosomes VS that graphically illustrated as response 3-D plots (Figure 1B). Surfactants can decrease the size of vesicles by micelle formation and interfacial tension reduction.34 The more HLB value of the surfactant, the more the VS due to higher surface free energy.35,36
Moreover, the increased surfactant hydrophilicity resulted in more water uptake leading to an increase in the bulk size of vesicles.13 However, S60 (HLB 4.7) exhibited larger VS bilosomes than S40 (HLB 6.7), which may be attributed to the higher ZP of S60 vesicles as increasing ZP increases the repulsion force between bilosome bilayer leading to much increase in the VS.11,37
Bile salt presence affects the VS by decreasing the surface tension,32 and the interfacial tension between vesicle bilayer, consequently, the space among vesicle bilayer.38 However, increasing bile salt amount in a high concentration makes it tend to aggregate itself.32 Bile salts anionic nature and steroid structure increase the VS by dual effect; the first is by increasing the internal aqueous core space, and the second is the high steric repulsive force between the bilosome bilayers that might boost the bilosomes bulkiness.20,39 The final coded factor equation is:

PDI values from 0 to 0.4 supports a homogeneous VS distribution; PDI values near to 1 reflect particles aggregation,40 in our study PDI values oscillating between 0.33 and 0.53 (Table 1) that signposts a good uniform VS distribution. Both the type of surfactant and the type of bile salt showed a positive effect (increasing) on the PDI according to the polynomial equation, while the amount of bile salt showed a negative one (Eq.7). ANOVA of the design model revealed an insignificant effect on the PDI for all factors (Figure 1C). The final coded factor equation is (Eq.7):

Bilosomes are electrostatic stabilizers,41 and their good stability was assured by the negative zeta potential values obtained. Absolute values were used to avoid misunderstanding (29 to 44.2 mV) (Table 1). ZP value around ±30 mV indicates electric repulsion between vesicles and good suspension stability with less agglomeration ability during storage.42 Negative charge results can be attributed to the bile salt anionic nature that supports the skin penetration ability of bilosomes.43
The regression equation of ZP (Eq.8) showed a synergistic effect of all factors on ZP but, only the type of surfactant and the type of the bile salt showed a significant effect (p = 0.0167, 0.0099 respectively) (Table 2). STC gives the lowest ZP values (Figure 1D) due to the strongly acidic taurine group. High ionization of STC will release more sodium ions in the solution raising the electrolyte concentration and consequently the bilayer compression due to counter ions gathering.44 The final coded factor equation is:

In-vitro Release of Metformin HCL Bilosomes
The release profile of all bilosome formulations (60.62 and up to 75.28% % within 24 h) was biphasic. Initial rapid release followed by a slower one proceeding with a maintainable rate characteristic of nano-carriers (Figure 3). 30 The drug’s preliminary rapid dissolution occurred to the adsorbed amount on the bilosome vesicles. In contrast, the slow one occurs due to the barricade effect of vesicles.45 ANOVA results indicate a significant impact (p < 0.05) of both bile salt type and amount with a p = 0.0051 and 0.0008, respectively, on the release percentage (Table 2).
 |
Figure 3 Release profile of metformin HCL from different bilosome formulations within 24 h. |
Surfactants increase the drug release by increasing the drug solubility.34,46 The higher the surfactant HLB value used, the more rapid is the diffusion to the release medium.30 However, our study did not much agree with these findings, and the surfactant type effect on the release profile was insignificant (p = 0.0686).
SDC has a synergistic effect on the release profile (+2.98) (Eq. 9); it increases the fluidity and the elasticity of the vesicle bilayer by incorporating it into the bilayer membrane leading to easy seepage of the drug from the vesicles besides its permeation enhancement property.46 Conversely, STC decreases the critical micelle concentration (CMC) due to many bilosome side-chain hydrophobic methylene groups throughout its conjugation with taurine, which delays the drug release.13 The 3D plot of the release is illustrated in Figure 1E. The final coded factor equation is:

Permeation Study of Metformin HCL Bilosomes
Studying permeation suggests the amount of drug delivered to the systemic circulation.47 Increasing the gradient drug concentration (driving force) at the interface between the skin and the bilosome pushes the systemic drug delivery occurrence.48,49 The design model of bilosome formulations showed a significant effect on permeation (p = 0.0096). Compared to the un-formulated metformin HCL solution, the amount of metformin HCL permeated within (4 h) from the prepared bilosomes showed a significant increase (p < 0.05) for F4, F8, and F9 while at (6 h) (last Q) showed a significant increase (p < 0.05) for all the bilosome formulations except for F7 and F12. The permeation flux (jss) for bilosome formulations is oscillating between 198.79 and 431.91 ng cm −2 h−1, with (r2 = 0.86–0.99) while the un-formulated metformin HCL solution showed a flux of 154.26 ng cm −2 h−1 (Table 4).
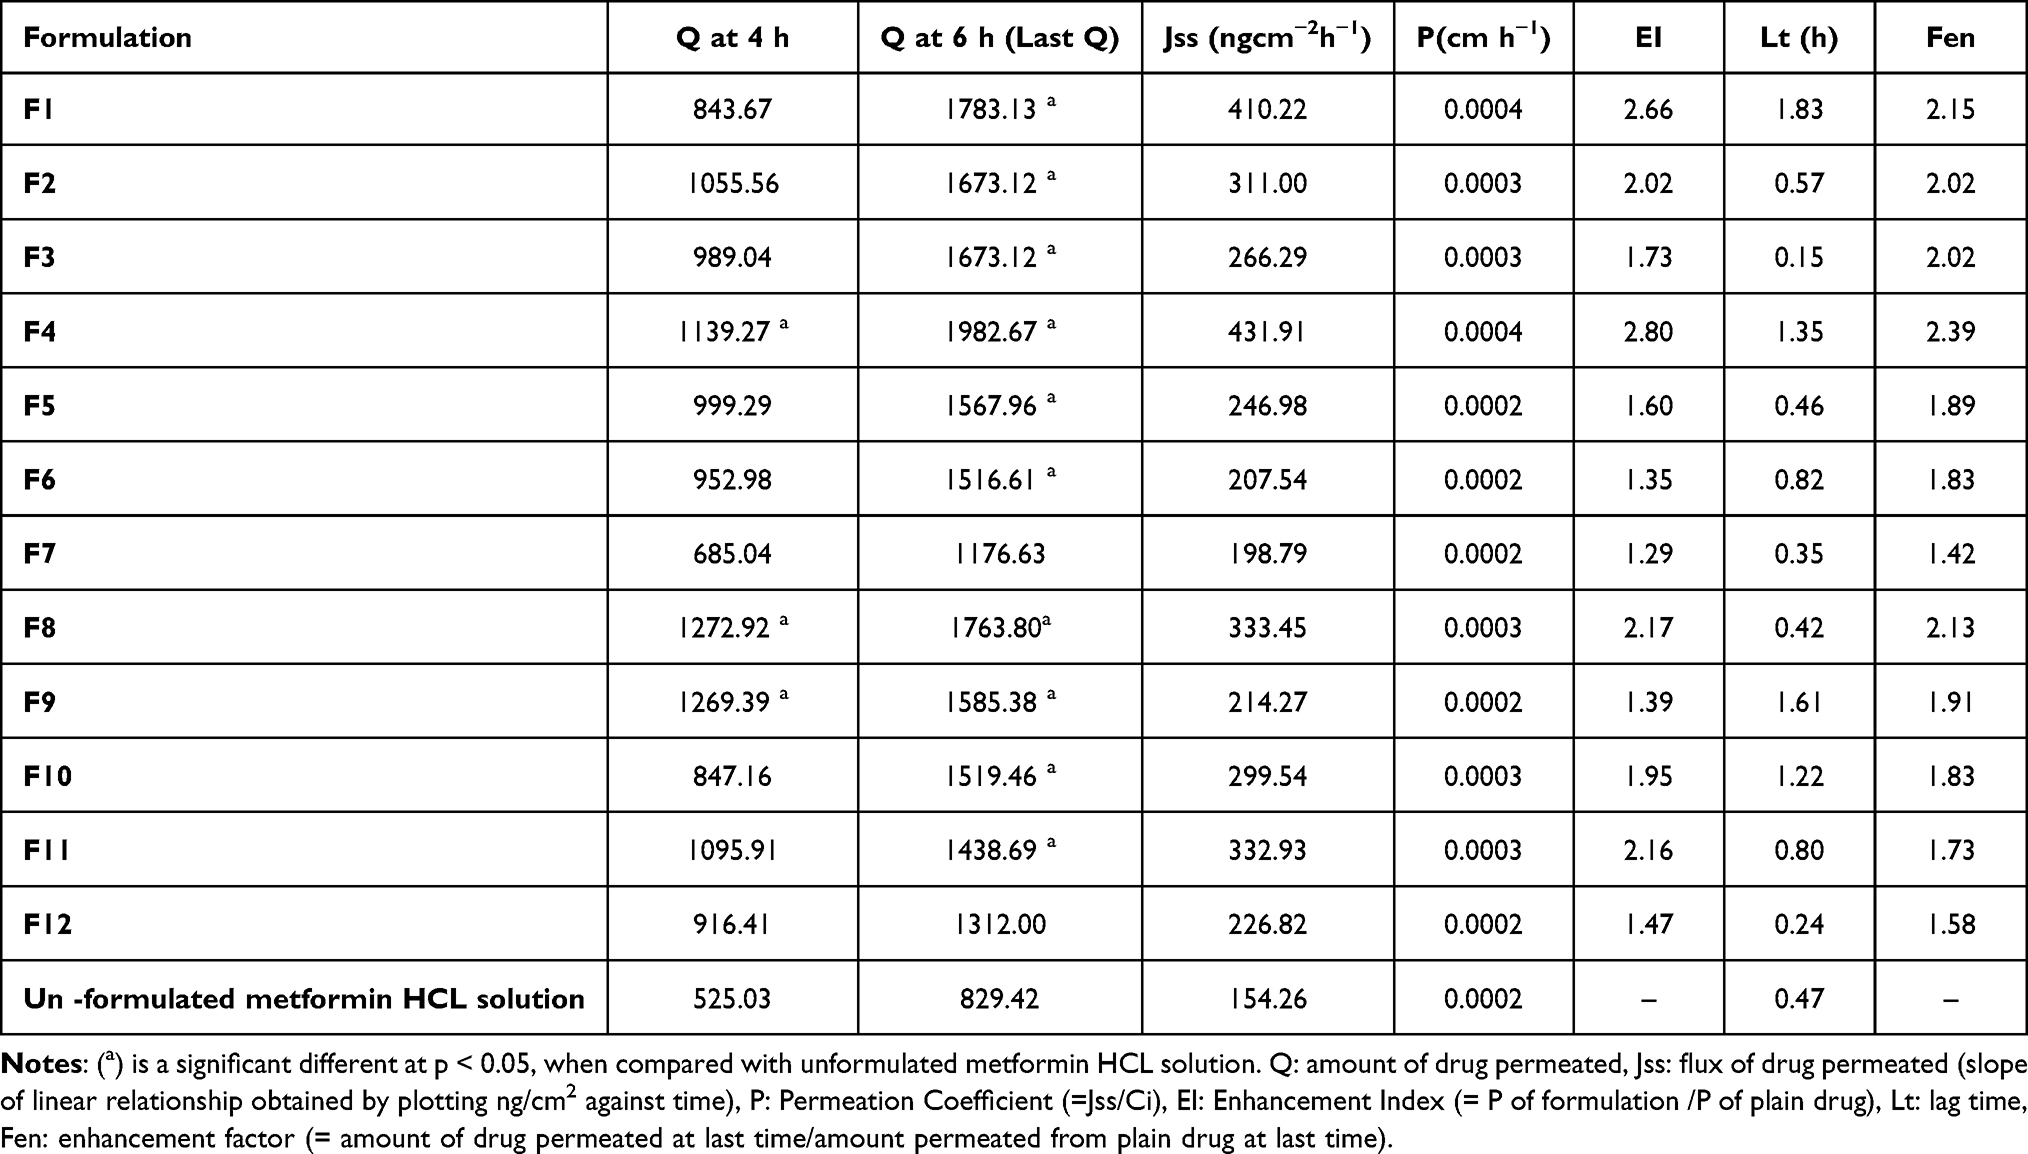 |
Table 4 In vitro Skin Permeation Parameters of Different Bilosome Formulations |
This permeation enhancement results can be owed to the vesicles nano-size, high internalization into the lipid matrix. In addition, anionic surfactants enhance the permeation capacity and increase the hydrostatic pressure, altering the subcutaneous layer to make vesicle penetration easier.32 Bile salts pierce the skin intercellular lipids and overcome the skin blockade property by interacting with the coenocyte’s keratin threads leading it to open. Besides, increasing the vesicular deformability and elasticity lowers the formulations efflux.50–52 The 3D plot of the permeation is illustrated in Figure 1F. The final coded factor equation is (Eq.10):

Optimization Data Analysis and Validation of the Optimization Model
The experimental solutions numerical optimization and response surface analysis were obtained using Design-Expert 13 (Multilevel- categoric factorial) software (Stat-Ease, Inc., Minneapolis, Minnesota, USA). The formulation with the highest desirability value was selected based on the maximum EE, absolute ZP, release, and permeation flux in addition to the minimum VS and PDI values. Depending on the highest desirability (0.814) (Figure 4), F8 was nominated to be the optimized formulation, it is composed of S60 as a surfactant and 8 mg of SDC as a bile salt with EE = 79.49%, VS = 237.68 nm, ZP = 40.9 mV, PDI = 0.325, R = 75.28%, and jss = 333.45 ng cm−2 h−1.
 |
Figure 4 Bar representation of formulating and response factors desirability of the optimized metformin HCL bilosome formulation (F8). |
The lag time of the optimized formulation was 0.42 h, which is considered enough time for balanced saturation of rat skin and excellent partitioning of drug between skin and reservoir medium, which may be due to the homogeneous drug distribution throughout the skin to obtain significant permeation. The composition and responses of F8 and the predicted optimized formulation are shown in Table 5.
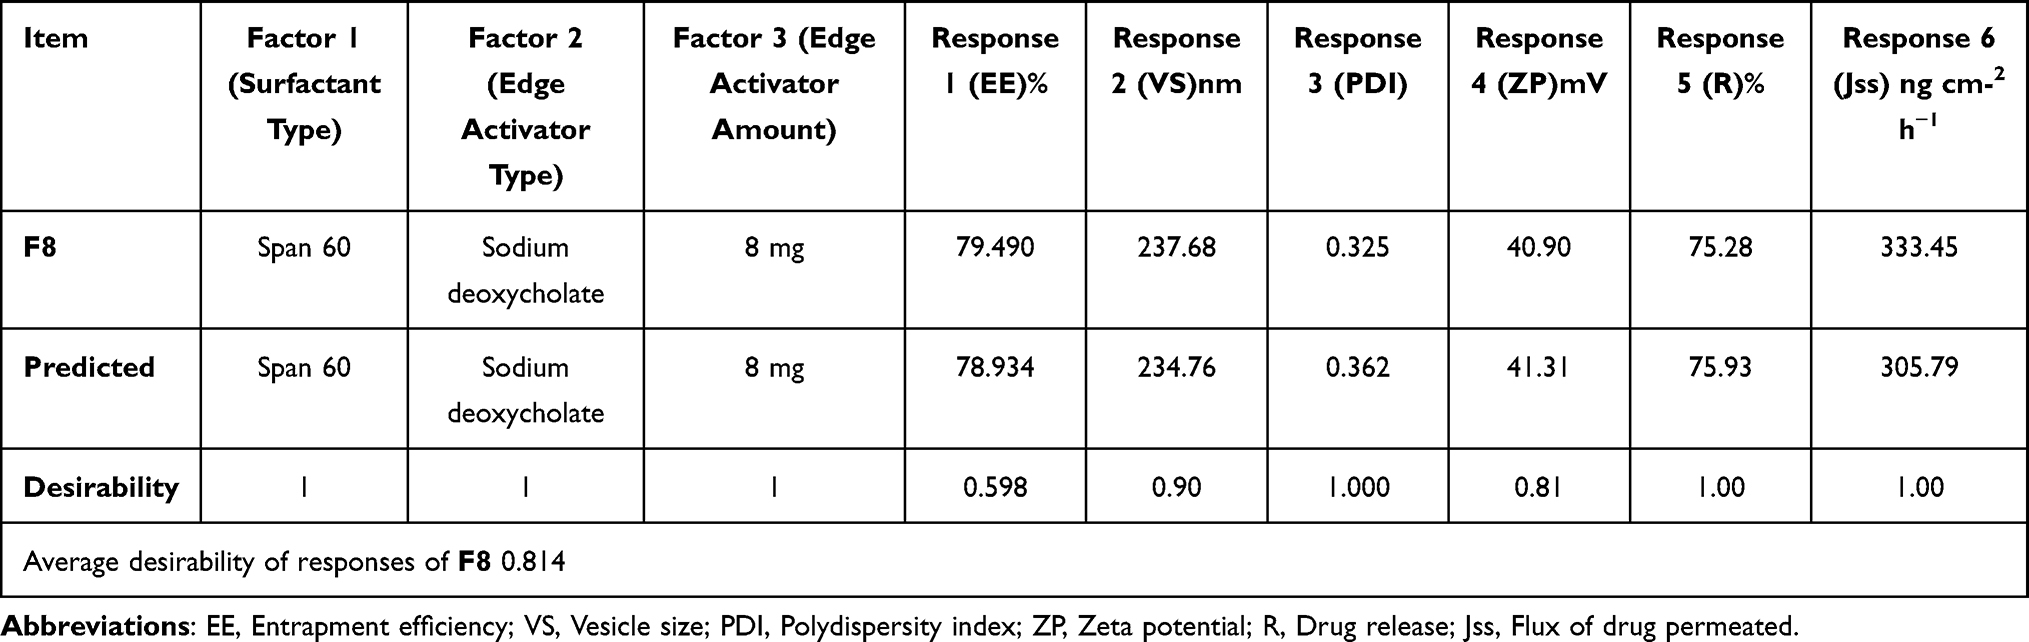 |
Table 5 Composition, Responses and Desirability of F8 and the Predicted Optimized Formulation |
Measurement of Vesicular Elasticity in Term of Deformability Index (DI) of Metformin HCL Bilosomes
Vesicle deformability and elasticity are crucial parameters for transdermal drug delivery. Increasing bilosomes deformability allows it to squeeze through smaller diameter skin pores with minimal risk of vesicles’ rupture.53 Oppositely, the less deformable vesicles must split into smaller ones to trespass the membrane pores.54 F8 (the optimized formulation) showed a high DI value (6.5) which confirms the hypothesis of the ability of metformin bilosomes to squeeze through skin pores with high flexibility while maintaining their size.53
Fourier Transform Infrared Spectroscopy Study (FTIR) of the Optimized Metformin HCL Bilosome Formulation
FTIR spectra assured bilosome vesicle formation by comparing the optimized formulation (F8) (Figure 5A) fingerprint region (below 1500cm−1) with those of its components (metformin HCL, S60, SDC, and cholesterol), and it was found to be not overlaid (Figure 5B–E). Metformin characteristic bands are the amine N-H group at 3339, 3274 cm−1, C-N, C=N at 1562, 1634 cm−1 wavenumbers, respectively, and the C-H bending at 1494 cm−1 (Figure 5B). Span 60 spectra showed the O-H group at wave number 3330 cm−1, alkanes, and aromatic rings at wavenumber 1449 cm−1 (Figure 5C). Figure 5 Continued. Figure 5 FTIR spectra of the optimized bilosome formulation (A), metformin HCL (B), Span 60 (C), sodium deoxycholate (D), and cholesterol (E).

The characteristic bands of SDC are shown at wave number 2939 cm−1 (aliphatic C-H) and wave number 1562 cm−1 (COO−) (Figure 5D). Cholesterol O-H group appears at wave number 3341 cm−1 and alkanes, aromatic rings at wave number 1454 cm−1 (Figure 5E). FTIR spectra of both metformin HCL and the optimized formulation F8 depicted no change in their function group regions that confirms the lack of chemical interaction between the drug and other components of the formulation. On the other hand, the fingerprint regions are not superimposed, which validates physical character changes.
Transmission Electron Microscope (TEM) of the Optimized Metformin HCL Bilosome Formulation
TEM photomicrograph of optimized formulation (F8) approved the size analysis result but was a little smaller (mean diameter: 98.00 ± 4.02 nm) due to the drying process occurring during TEM imaging. It showed uni-lamellar spherical, self-closed vesicles with a rough surface. No particle aggregation was observed (Figure 6).
 |
Figure 6 Transmission electron micrograph (TEM) of the optimized metformin HCL bilosome formulation (F8). |
Conclusion
In this study, metformin hydrochloride bilosomes were successfully formulated and evaluated as a novel topical drug delivery system that enhances its skin permeation and transdermal delivery and helps in avoiding gastritis as a drastic side effect. Twelve bilosome formulations were prepared by solvent evaporation method according to a 31 .22 full factorial design to determine the possible optimized formulation. All formulations were evaluated and showed acceptable EE, nano VS and stable vesicles confirmed by ZP results. In addition, the release profile showed a biphasic pattern, and the permeation profiles obtained showed a noticeable enhancement in the permeation flux of bilosomes over the unformulated drug.
Optimized bilosome formulation (F8) was picked by design expert 13 numerical optimization, it composed of S60 as a surfactant, and 8 mg of SDC as a bile salt. The overall results of this study give a good interest towards bilosomes enhancement role in the active transdermal delivery of metformin HCL.
Statistical Analysis
The significance of differences was established by two-way analysis of variance using Graph Pad Prism version 6.0 for Windows, Graph Pad Software (San Diego, CA, USA). The results were expressed in mean, and P-value <0.05 was considered statistically significant.
Abbreviations
Entrapment efficiency (EE), vesicle size (VS), polydispersity index (PDI), zeta potential (ZP), percentage of drug released (R), and flux of drug permeated (Jss). DI (Deformability index). Fourier-transform infrared spectroscopy (FTIR) and vesicle shape using Transmission electron microscope (TEM), Hydrophilic lipophilic balance (HLB).
Acknowledgments
The authors are thankful to Nahda University Beni-Suef central lab for providing the facilities to bring out this work.
Disclosure
The authors report no conflicts of interest in this work.
References
1. Cicero AF, Tartagni E, Ertek S. Metformin and its clinical use: new insights for an old drug in clinical practice. Arch med sci. 2012;8(5):907.
2. Basak SC, Kumar KS, Ramalingam M. Design and release characteristics of sustained release tablet containing metformin HCl. Revista Brasileira de Ciências Farmacêuticas. 2008;44:477–483.
3. Basak S, Rahman J, Ramalingam M. Design and in vitro testing of a floatable gastroretentive tablet of metformin hydrochloride. Die Pharmazie Int J Pharmaceutical Sci. 2007;62(2):145–148.
4. Jain SK, Gupta A. Development of Gelucire 43/01 beads of metformin hydrochloride for floating delivery. AAPS PharmSciTech. 2009;10(4):1128–1136.
5. Kaestli L-Z, Wasilewski-Rasca A-F, Bonnabry P, Vogt-Ferrier N. Use of transdermal drug formulations in the elderly. Drugs Aging. 2008;25(4):269–280.
6. Rostamkalaei SS, Akbari J, Saeedi M, Morteza-Semnani K, Nokhodchi A. Topical gel of Metformin solid lipid nanoparticles: a hopeful promise as a dermal delivery system. Colloids Surf B Biointerfaces. 2019;175:150–157.
7. Ng LC, Gupta M. Transdermal drug delivery systems in diabetes management: a review. Asian j Pharmaceutical Sci. 2020;15(1):13–25.
8. Migdadi EM, Courtenay AJ, Tekko IA, et al. Hydrogel-forming microneedles enhance transdermal delivery of metformin hydrochloride. J Controlled Release. 2018;285:142–151.
9. Bariya SH, Gohel MC, Mehta TA, Sharma OP. Microneedles: an emerging transdermal drug delivery system. J Pharm Pharmacol. 2012;64(1):11–29.
10. Al-Mahallawi AM, Abdelbary AA, Aburahma MH. Investigating the potential of employing bilosomes as a novel vesicular carrier for transdermal delivery of tenoxicam. Int J Pharm. 2015;485(1–2):329–340.
11. El Zaafarany GM, Awad GA, Holayel SM, Mortada ND. Role of edge activators and surface charge in developing ultradeformable vesicles with enhanced skin delivery. Int J Pharm. 2010;397(1–2):164–172.
12. Ali J, Bhatnagar A, Kumar N, Ali A. Chitosan nanoparticles amplify the ocular hypotensive effect of cateolol in rabbits. Int J Biol Macromol. 2014;65:479–491.
13. Aziz DE, Abdelbary AA, Elassasy AI. Investigating superiority of novel bilosomes over niosomes in the transdermal delivery of diacerein: in vitro characterization, ex vivo permeation and in vivo skin deposition study. J Liposome Res. 2019;29(1):73–85.
14. Khalil RM, Abdelbary A, Kocova El-Arini S, Basha M, El-Hashemy HA. Evaluation of bilosomes as nanocarriers for transdermal delivery of tizanidine hydrochloride: in vitro and ex vivo optimization. J Liposome Res. 2019;29(2):171–182.
15. El-Menshawe SF, Ali AA, Rabeh MA, Khalil NM. Nanosized soy phytosome-based thermogel as topical anti-obesity formulation: an approach for acceptable level of evidence of an effective novel herbal weight loss product. Int J Nanomedicine. 2018;13:307.
16. Lambers H, Piessens S, Bloem A, Pronk H, Finkel P. Natural skin surface pH is on average below 5, which is beneficial for its resident flora. Int J Cosmet Sci. 2006;28(5):359–370.
17. Desai D, Wong B, Huang Y, et al. Influence of dissolution media pH and USP1 basket speed on erosion and disintegration characteristics of immediate release metformin hydrochloride tablets. Pharm Dev Technol. 2015;20(5):540–545.
18. Salem HF, Kharshoum RM, Awad SM, Mostafa MA, Abou-Taleb HA. Tailoring of retinyl palmitate-based ethosomal hydrogel as a novel nanoplatform for acne vulgaris management: fabrication, optimization, and clinical evaluation employing a split-face comparative study. Int J Nanomedicine. 2021;16:4251.
19. Alruwaili NK, Zafar A, Imam SS, et al. Stimulus responsive ocular gentamycin-ferrying chitosan nanoparticles hydrogel: formulation optimization, ocular safety and antibacterial assessment. Int J Nanomedicine. 2020;15:4717.
20. Ahmed S, Kassem MA, Sayed S. Bilosomes as promising nanovesicular carriers for improved transdermal delivery: construction, in vitro optimization, ex vivo permeation and in vivo evaluation. Int J Nanomedicine. 2020;15:9783.
21. Albash R, El-Nabarawi MA, Refai H, Abdelbary AA. Tailoring of PEGylated bilosomes for promoting the transdermal delivery of olmesartan medoxomil: in-vitro characterization, ex-vivo permeation and in-vivo assessment. Int J Nanomedicine. 2019;14:6555.
22. van den Bergh BA, Wertz PW, Junginger HE, Bouwstra JA. Elasticity of vesicles assessed by electron spin resonance, electron microscopy and extrusion measurements. Int J Pharm. 2001;217(1–2):13–24.
23. Aziz DE, Abdelbary AA, Elassasy AI. Fabrication of novel elastosomes for boosting the transdermal delivery of diacerein: statistical optimization, ex-vivo permeation, in-vivo skin deposition and pharmacokinetic assessment compared to oral formulation. Drug Deliv. 2018;25(1):815–826.
24. Jain S, Patel N, Madan P, Lin S. Quality by design approach for formulation, evaluation and statistical optimization of diclofenac-loaded ethosomes via transdermal route. Pharm Dev Technol. 2015;20(4):473–489.
25. Menard S. Coefficients of determination for multiple logistic regression analysis. Am Stat. 2000;54(1):17–24.
26. De Lima LS, Araujo MDM, Quináia SP, Migliorine DW, Garcia JR. Adsorption modeling of Cr, Cd and Cu on activated carbon of different origins by using fractional factorial design. Chem Eng j. 2011;166(3):881–889.
27. Elnaggar YS, Omran S, Hazzah HA, Abdallah OY. Anionic versus cationic bilosomes as oral nanocarriers for enhanced delivery of the hydrophilic drug risedronate. Int J Pharm. 2019;564:410–425.
28. Abdelbary G, El-Gendy N. Niosome-encapsulated gentamicin for ophthalmic controlled delivery. AAPS pharmscitech. 2008;9(3):740–747.
29. Hao Y, Zhao F, Li N, Yang Y. Studies on a high encapsulation of colchicine by a niosome system. Int J Pharm. 2002;244(1–2):73–80.
30. Mohamed MI, Abdelbary AA, Kandil SM, Mahmoud TM. Preparation and evaluation of optimized zolmitriptan niosomal emulgel. Drug Dev Ind Pharm. 2019;45(7):1157–1167.
31. Aboud HM, Ali AA, El-Menshawe SF, Elbary AA. Nanotransfersomes of carvedilol for intranasal delivery: formulation, characterization and in vivo evaluation. Drug Deliv. 2016;23(7):2471–2481.
32. Zafar A, Alruwaili NK, Imam SS, et al. Bioactive Apigenin loaded oral nano bilosomes: formulation optimization to preclinical assessment. Saudi Pharm J. 2021;29(3):269–279.
33. El-Nabarawi MA, Shamma RN, Farouk F, Nasralla SM. Bilosomes as a novel carrier for the cutaneous delivery for dapsone as a potential treatment of acne: preparation, characterization and in vivo skin deposition assay. J Liposome Res. 2020;30(1):1–11.
34. Qumber M, Alruwaili NK, Bukhari SNA, et al. BBD-based development of itraconazole loaded nanostructured lipid carrier for topical delivery: in vitro evaluation and antimicrobial assessment. J Pharm Innov. 2021;16(1):85–98.
35. Nagarwal RC, Kant S, Singh P, Maiti P, Pandit J. Polymeric nanoparticulate system: a potential approach for ocular drug delivery. J Controlled Release. 2009;136(1):2–13.
36. Yoshioka T, Sternberg B, Florence AT. Preparation and properties of vesicles (niosomes) of sorbitan monoesters (Span 20, 40, 60 and 80) and a sorbitan triester (Span 85). Int J Pharm. 1994;105(1):1–6.
37. Abdelbary G. Ocular ciprofloxacin hydrochloride mucoadhesive chitosan-coated liposomes. Pharm Dev Technol. 2011;16(1):44–56.
38. Opatha SAT, Titapiwatanakun V, Chutoprapat R. Transfersomes: a promising nanoencapsulation technique for transdermal drug delivery. Pharmaceutics. 2020;12(9):855.
39. Abdelbary AA, Abd-Elsalam WH, Al-Mahallawi AM. Fabrication of novel ultradeformable bilosomes for enhanced ocular delivery of terconazole: in vitro characterization, ex vivo permeation and in vivo safety assessment. Int J Pharm. 2016;513(1–2):688–696.
40. Centis V, Vermette P. Physico-chemical properties and cytotoxicity assessment of PEG-modified liposomes containing human hemoglobin. Colloids Surf B Biointerfaces. 2008;65(2):239–246.
41. Wang L, Huang X, Jing H, Ma C, Wang H. Bilosomes as effective delivery systems to improve the gastrointestinal stability and bioavailability of epigallocatechin gallate (EGCG). Food Res Int. 2021;149:110631.
42. Badria F, Mazyed E. Formulation of Nanospanlastics as a Promising Approach for Improving the Topical Delivery of a Natural Leukotriene Inhibitor (3- Acetyl-11-Keto-β-Boswellic Acid): statistical Optimization, in vitro Characterization, and ex vivo Permeation Study. Drug Des Devel Ther. 2020;14:3697.
43. Chen-yu G, Chun-fen Y, Qi-lu L, et al. Development of a quercetin-loaded nanostructured lipid carrier formulation for topical delivery. Int J Pharm. 2012;430(1–2):292–298.
44. Saka E, Güler C. The effects of electrolyte concentration, ion species and pH on the zeta potential and electrokinetic charge density of montmorillonite. Clay Miner. 2006;41(4):853–861.
45. Sinico C, Valenti D, Manconi M, Lai F, Fadda AM. Cutaneous delivery of 8-methoxypsoralen from liposomal and niosomal carriers. J Drug Deliv Sci Technol. 2006;16(2):115–120.
46. Mohsen AM, Asfour MH, Salama AA. Improved hepatoprotective activity of silymarin via encapsulation in the novel vesicular nanosystem bilosomes. Drug Dev Ind Pharm. 2017;43(12):2043–2054.
47. El-Laithy HM, Shoukry O, Mahran LG. Novel sugar esters proniosomes for transdermal delivery of vinpocetine: preclinical and clinical studies. Eur j pharmaceutics biopharmaceutics. 2011;77(1):43–55.
48. Verma DD, Verma S, Blume G, Fahr A. Particle size of liposomes influences dermal delivery of substances into skin. Int J Pharm. 2003;258(1–2):141–151.
49. Aboelwafa AA, El-Setouhy DA, Elmeshad AN. Comparative study on the effects of some polyoxyethylene alkyl ether and sorbitan fatty acid ester surfactants on the performance of transdermal carvedilol proniosomal gel using experimental design. AAPS pharmscitech. 2010;11(4):1591–1602.
50. Muzzalupo R, Tavano L, Cassano R, Trombino S, Ferrarelli T, Picci N. A new approach for the evaluation of niosomes as effective transdermal drug delivery systems. Eur J Pharmaceutics Biopharmaceutics. 2011;79(1):28–35.
51. Gaba B, Fazil M, Ali A, Baboota S, Sahni JK, Ali J. Nanostructured lipid (NLCs) carriers as a bioavailability enhancement tool for oral administration. Drug Deliv. 2015;22(6):691–700.
52. Som I, Bhatia K, Yasir M. Status of surfactants as penetration enhancers in transdermal drug delivery. J Pharm Bioallied Sci. 2012;4(1):2.
53. Kakkar S, Pal Kaur I. A novel nanovesicular carrier system to deliver drug topically. Pharm Dev Technol. 2013;18(3):673–685.
54. Alomrani AH, Shazly GA, Amara AA, Badran MM. Itraconazole-hydroxypropyl-β-cyclodextrin loaded deformable liposomes: in vitro skin penetration studies and antifungal efficacy using Candida albicans as model. Colloids Surf B Biointerfaces. 2014;121:74–81.
 © 2022 The Author(s). This work is published and licensed by Dove Medical Press Limited. The
full terms of this license are available at https://www.dovepress.com/terms
and incorporate the Creative Commons Attribution
- Non Commercial (unported, 3.0) License.
By accessing the work you hereby accept the Terms. Non-commercial uses of the work are permitted
without any further permission from Dove Medical Press Limited, provided the work is properly
attributed. For permission for commercial use of this work, please see paragraphs 4.2 and 5 of our Terms.
© 2022 The Author(s). This work is published and licensed by Dove Medical Press Limited. The
full terms of this license are available at https://www.dovepress.com/terms
and incorporate the Creative Commons Attribution
- Non Commercial (unported, 3.0) License.
By accessing the work you hereby accept the Terms. Non-commercial uses of the work are permitted
without any further permission from Dove Medical Press Limited, provided the work is properly
attributed. For permission for commercial use of this work, please see paragraphs 4.2 and 5 of our Terms.