Back to Journals » OncoTargets and Therapy » Volume 10
Evaluation of efficacy of transcatheter arterial chemoembolization for hepatocellular carcinoma using magnetic resonance diffusion-weighted imaging
Authors Wu X, Wang J, Ji J, Chen M, Song J
Received 22 June 2016
Accepted for publication 23 November 2016
Published 16 March 2017 Volume 2017:10 Pages 1637—1643
DOI https://doi.org/10.2147/OTT.S115568
Checked for plagiarism Yes
Review by Single anonymous peer review
Peer reviewer comments 3
Editor who approved publication: Prof. Dr. Geoffrey Pietersz
Xiao-Ming Wu,1 Jun-Feng Wang,1 Jian-Song Ji,2 Ming-Gao Chen,1 Jian-Gang Song1
1Department of Radiology, Jinhua People’s Hospital, Jinhua, 2Department of Radiology, Lishui Municipal Center Hospital, Lishui, People’s Republic of China
Abstract: Although the efficacy of transcatheter arterial chemoembolization (TACE) has been recommended as first-line therapy for nonsurgical patients with hepatocellular carcinoma (HCC), it is difficult to accurately predict the efficacy of TACE. Therefore, this study evaluated the efficacy of TACE for HCC using magnetic resonance (MR) diffusion-weighted imaging (DWI). A total of 84 HCC patients who received initial TACE were selected and assigned to the stable group (n=39) and the progressive group (n=45). Before TACE treatment, a contrast-enhanced MR scan and DWI (b=300, 600, and 800 s/mm2) were performed on all patients. The modified response evaluation criteria in solid tumors were used for evaluation of tumor response. Receiver operating characteristic curve was employed to predict the value of apparent diffusion coefficient (ADC) for TACE efficacy. The ADC values of HCC patients in the progressive group were higher than those in the stable group at different b-values (b=300, 600, and 800 s/mm2) before TACE treatment. The area under the curve of ADC values with b-values of 300, 600, and 800 s/mm2 were 0.693, 0.724, and 0.746; the threshold values were 1.94×10⁻³ mm2/s, 1.28×10⁻³ mm2/s, and 1.20×10⁻³ mm2/s; the sensitivity values were 55.6%, 77.8%, and 73.3%; and the specificity values were 82.1%, 61.5%, and 71.8%, respectively. Our findings indicate that the ADC values of MR-DWI may accurately predict the efficacy of TACE in the treatment of HCC patients.
Keywords: magnetic resonance imaging, diffusion-weighted imaging, hepatocellular carcinoma, transcatheter arterial chemoembolization, apparent diffusion coefficient
Introduction
Hepatocellular carcinoma (HCC) is a common malignancy in the People’s Republic of China with characteristics of high malignancy, fast-growing progress, and poor prognosis.1 The GLOBOCAN 2012 shows that the estimated age-standardized rates (ASRs) of liver cancer incidence and mortality in a Chinese standard population (ASR China) rank the second and third highest cancer incidence and mortality and accounts for 12.9% of all new cancer cases and 17.4% of all cancer deaths in the People’s Republic of China in 2012.2 The incidence rate of HCC ranks fifth in males and ninth in females, and the mortality rate ranks second worldwide.3 The early diagnosis of this disease is difficult due to the absence of specific symptoms in its early stage, and therefore, the majority of patients are diagnosed at an advanced stage, losing their chance for radical surgery.4 Factors resulting in HCC are complicated, including hepatitis B virus infection, hepatitis C virus infection, aflatoxin exposure, obesity, alcohol-related cirrhosis, smoking, and diabetes.5 Systemic therapies including hormonal therapy, chemotherapy, biologic, and biochemical therapy are regarded as the effective therapies for HCC patients.6 The main therapeutic methods include surgical resection, liver transplantation, radiotherapy, ablation treatment, and transcatheter arterial chemoembolization (TACE).7 TACE is an effective means of palliation, which is minimally invasive, cheap, and safe. It is also recommended as the optimal treatment for HCC.8
TACE can block the blood supply to the tumor and kill tumor cells selectively.9 Patients suffering from early-stage cancers with a high recurrence rate can be treated with surgical treatments, and patients with advanced-stage cancers need more sophisticated and systemic treatments.10 Accurate and timely evaluation of the postoperative efficacy of TACE is of great significance for the improvement of the patients’ survival rate and quality of life. There are various methods to assess the therapeutic efficacy of TACE, such as computed tomography (CT) perfusion imaging, ultrasonography, and magnetic resonance diffusion-weighted imaging (MR-DWI).11 It is necessary to promote further research on therapeutic efficacy evaluation of TACE. DWI is a functional MR imaging (MRI) technique and allows the observation of the water molecules diffusion process in vivo, reflecting the tissue conditions indirectly.12 The apparent diffusion coefficient (ADC) value concept is used to quantize diffusion process of water molecules.13 MR-DWI has been developed rapidly in recent years with the introduction of spin-echo echo-planar imaging and parallel imaging technology with multichannel coils,13 which is also important for the evaluation of therapeutic efficacy after TACE. In the present study, we aimed to evaluate the efficacy of TACE for HCC using the ADC values of MR-DWI.
Materials and methods
Ethical statement
This study was conducted in accordance with approval from the Ethics Committee of Jinhua People’s Hospital. Written informed consent was collected from each of the eligible patients prior to the experiment.
Subjects
A total of 84 HCC patients who received initial TACE between January 1, 2013 and January 1, 2015 were selected for this study. The 84 HCC patients included 57 males and 27 females with the average age of 54.5±9.6 years (25–76 years). Inclusion criteria: 1) patients diagnosed with primary liver cancer by needle biopsy, CT, MRI, ultrasound examination, digital subtraction angiography, and α-fetoprotein (AFP); 2) the tumors were single nodule or giant block; and 3) the patients planned to receive TACE treatment. Exclusion criteria: 1) patients were not able to be depicted with MR examination (with metals in body); 2) patients with immune system disease, nervous system lesions, heart disease, hepatic disease, and renal disease; 3) patients who could not hold their breath for 15–20 seconds after respiratory training; 4) females during pregnancy or lactation; 5) patients with hypersensitivity to contrast agents; and 6) patients with severe medical disease.
MRI scanning
The patients were scanned after fasting for 6 hours. After respiratory and breath training, the patients were required to hold their breath in the scanning process, and the patients were scanned in a dorsal position. DWI was performed after conventional sequences imaging using a spin-echo echo-planar sequence (repetition time =8,000 ms; echo time =75.4 ms; matrix size =128×128; number of excitation =1; field of view =40×40 cm; section thickness =6 mm; section gap =1.5 mm; b-factors =0, 300, 600, and 800 s/mm2; diffusion gradient directions = ALL; phase-frequency encoding direction = R/L). The images were obtained after initiating an intravenous bolus injection of gadolinium with diethylenetriaminepentacetate (dose =0.1 mmol/kg; injection rate =3.0 mL/s), followed by a flush with 20 mL of sterile saline solution.
Three-dimensional isotropic volumetric interpolated breath-hold examination (3D-VIBE) was employed for axial scanning (repetition time =3.3 ms; echo time =1.35 ms; bandwidth =500 Hz; flip angle =13°; matrix size =240×320; field of view =280×350 mm; section thickness =2 mm; section gap =0.5 mm). The ulnar vein of patient was injected with contrast medium (gadopentetate dimeglumine) at a flow rate of 2 mL by using a high-pressure injector, and the total amount injected was 0.2 mmol/kg. A total of 20 mL of normal saline was used for washing the pipe after injection, and the VIBE was started after the patient’s breath was held, and axial scanning was conducted 15 times to receive dynamic contrast-enhanced scan images. Each scan time lasted for 16 seconds, and subjects would be noticed for breathing in the interval time of 5 seconds.
The MRI image processing was performed on the workstation of Philips Achieva Nova Dual 1.5T. The area above and below the lesion was avoided to reduce the effect of partial volume. Size of the region of interest was selected to cover the remaining slices in the lesion. The region of interest was slightly smaller than the lesion. The signal intensity was determined, and the ADC values of all the layers were calculated using the following formula: (ADC = [ln(S0/S1)]/[b1 − b0]). The mean value was taken as the general ADC value. In the natural log, b0 =0 s/mm2, b1 =300, 600, or 800 s/mm2, S0 and S1 were the signal intensities of the lesion on images obtained at each b-value.
Transcatheter arterial chemoembolization
The puncture technology was conducted in the right femoral artery using the Seldinger approach under local anesthesia. The imaging of the celiac artery or common hepatic artery was performed. Chemotherapeutic drugs including 1,000 mg 5-fluorouracil or floxuridine, 20 mg mitomycin, and 40 mg pirarubicin hydrochloride were then perfused. A 5-French catheter (or a microcatheter if necessary) was inserted into the blood supply artery with a selective or superselective intubation technique. It was then followed by embolism with 5–30 mL hyper liquidness iodinated oil until blood supply vessels were obliterated. Hepatic angiograms were performed to observe the condition of lipiodol deposition. The wound was dressed with pressure bandaging, and the patient was returned to their ward. The embolism standards were as follows: radiograpy indicated that iodinated oil gathered properly in the tumor, tumor vessels supplying blood were obliterated, and tumor staining almost disappeared. Extubation, local compression, and pressure dressing were then conducted. The second TACE was performed 1 month later.
Follow-up and efficacy evaluation
Patients were routinely followed up every 1–2 months after TACE. The MRI images and other clinical data were obtained. Cases followed up for more than half a year were included in the study. The deadline of the follow-up period was July 1, 2015. The curative effect was evaluated according to the modified response evaluation criteria in solid tumors standard of American Association for the Study of Liver Diseases.14 Complete response (CR): no enhancement at arterial phase in the research subjects. Partial response (PR): the diameter of lesions (with enhancement at arterial phase) decreased 30% or more. Stable disease (SD): between the PR and PD. Progression disease (PD): the diameter of lesions (with enhancement at arterial phase) increased 20% or more. MRI or CT was performed on the target lesions. Cases of SD + PD were thought to be progressive, and cases of CR + PR were thought to be stable. The disease progression included local tumor recurrence, intrahepatic metastasis, or distant metastasis. All cases were divided into either the stable group or the progressive group based on the final MRIs. The disease progression (including local tumor recurrence, intrahepatic metastasis, or distant metastasis) was verified by MRI in the progressive group.
Statistical analysis
All data were analyzed using the Statistical Package for Social Science 21.0 (IBM Corporation, Armonk, NY, USA). The measurement data were expressed as mean ± standard deviation. One-Sample Kolmogorov–Smirnov test was firstly performed on the measurement data, and the comparison between the two groups on the data of the normal distribution and heterogeneity of variance was conducted using independent-sample t-test, but comparison between two groups on the data of the abnormal distribution was conducted using the Wilcoxon rank-sum test. The enumeration data were expressed as percentage and compared using the χ2 test and Fisher’s exact probability. The ranked data were detected using the nonparametric rank-sum test. The receiver operating characteristic (ROC) curve was used to calculate ADC values and to predict the threshold as well as the efficiency of the curative effects after TACE. Cox’s regression model was used to analyze the effects of significant factors on disease progression. All statistical tests were two-sided with P<0.05 considered to indicate statistical significance.
Results
Baseline characteristics of HCC patients between the stable and progressive groups
The stable group included 39 patients (25 males and 14 females; mean age 52.6±10.2 years), and the progressive group included 45 patients (32 males and 13 females; mean age 54.8±9.1 years). The age and AFP value of patients between the two groups were in normal distribution. No significant differences on age, gender, and AFP values were observed in HCC patients between the stable and progressive groups (all P>0.05). There were significant differences in the history of hepatitis B cirrhosis, clinical staging, incidence of portal vein cancerous embolus, Child-Turcotte-Pugh (CTP) score, and incidence of arteriovenous fistulas of HCC patients between the two groups (all P<0.05) (Table 1).
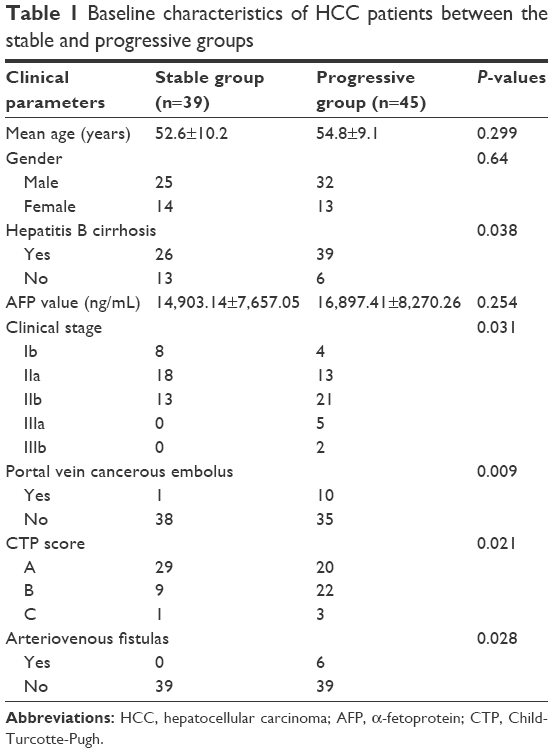 | Table 1 Baseline characteristics of HCC patients between the stable and progressive groups |
MRI features of HCC lesions at different b-values
Before TACE, the structures of HCC lesions were clearly seen at the b-value of 300 s/mm2, the signal intensity of HCC lesion was slightly higher, the margin of the lesions and internal cystic necrosis were unclear, the pseudocapsule was not observed (Figure 1A and D). When b-value =600 s/mm2, the image resolution reduced. Signal intensity of residual and recurrent lesions became slightly higher, and image of the necrosis, cyst degeneration, margin of lesions and pseudocapsule can be clearly observed. The signal intensity of liver decreased but still stayed at a high level (Figure 1B and E). The structures of HCC lesions were not clearly observed at the b-value of 800 s/mm2; the signal intensity of HCC lesion was slightly higher; and the necrosis, cyst degeneration, margin of the lesion, and pseudocapsule were also observed clearly. When b-value =800 s/mm2, the image resolution was low and the anatomical structure was vague. The residual and recurrent lesions displayed high signal intensity, and the high signal intensity in liver continued to decrease (Figure 1C and F).
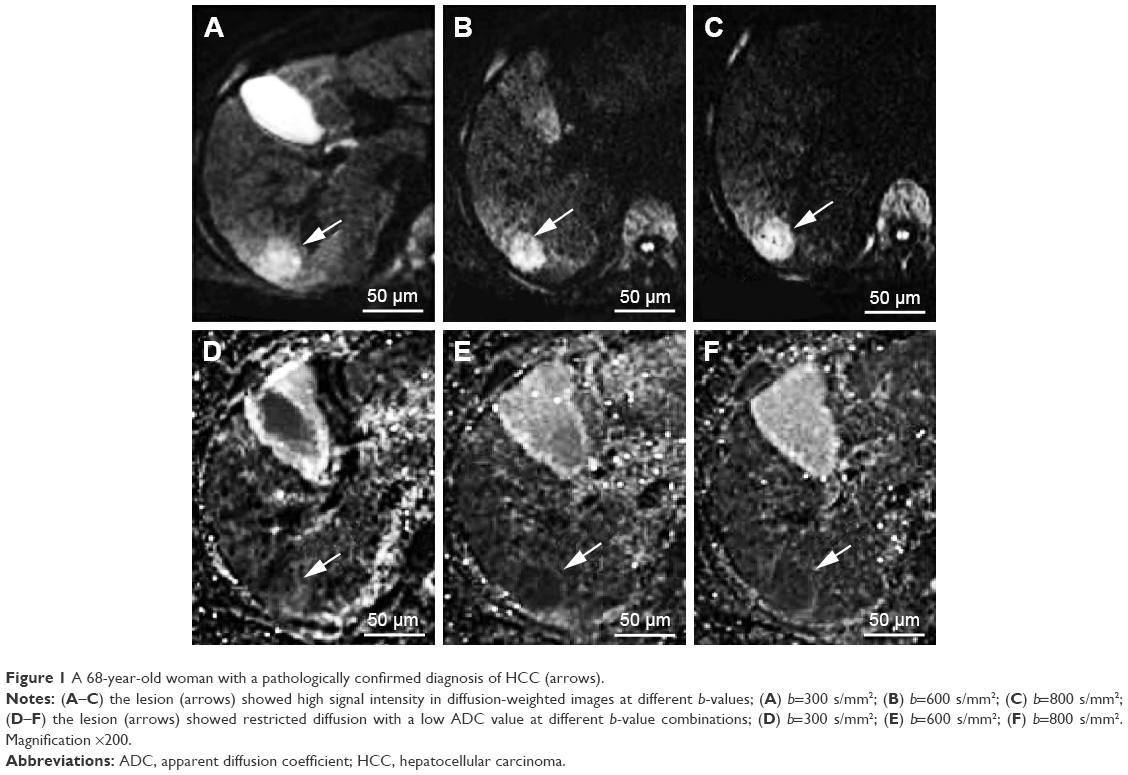 | Figure 1 A 68-year-old woman with a pathologically confirmed diagnosis of HCC (arrows). |
Comparisons of ADC values of the lesions of HCC patients between the stable and progressive groups before TACE
The ADC values of the stable and progressive groups at different b-values before TACE (b=300, 600, and 800 s/mm2) are shown in Table 2 and Figure 2. The ADC values at different b-values of HCC patients between the stable and progressive groups were in normal distribution (all P>0.05). The ADC values of the stable group were significantly lower than those of the progressive group with b-values of 300, 600, and 800 s/mm2 (P=0.036, P=0.010, P=0.036, respectively).
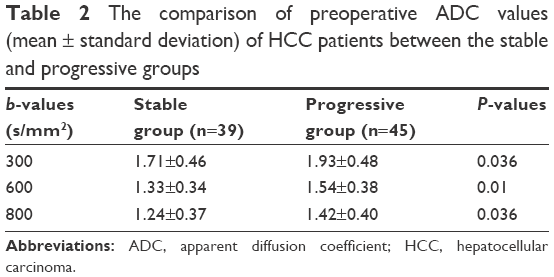 | Table 2 The comparison of preoperative ADC values (mean ± standard deviation) of HCC patients between the stable and progressive groups |
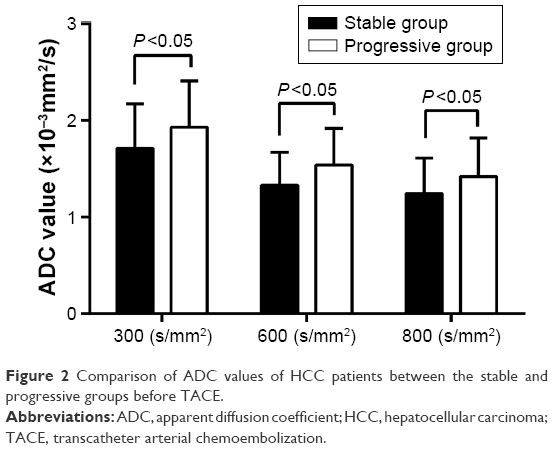 | Figure 2 Comparison of ADC values of HCC patients between the stable and progressive groups before TACE. |
Variations in the sensitivity and specificity between different ADC values
The ROC curve of the preoperative ADC values is shown in Figure 3. The threshold points, sensitivity, and specificity were 1.94×10⁻³ mm2/s, 55.6%, and 82.1%, respectively, with the b-value of 300 s/mm2, and the area under the curve (AUC) was 0.693 (95% confidence interval [CI]: 0.581–0.805). The threshold points, sensitivity, and specificity were 1.28×10⁻³ mm2/s, 77.8%, and 61.5%, respectively, with the b-value of 600 s/mm2, and AUC was 0.724 (95% CI: 0.616–0.832). When the b-value was set at 800 s/mm2, the threshold points, sensitivity, and specificity were 1.20×10⁻³ mm2/s, 73.3%, and 71.8%, respectively, and AUC was 0.746 (95% CI: 0.639–0.852). The AUC values at different b-values (b=300, 600, and 800 s/mm2) were significantly different from AUC of 0.5 (all P<0.05; Table 3).
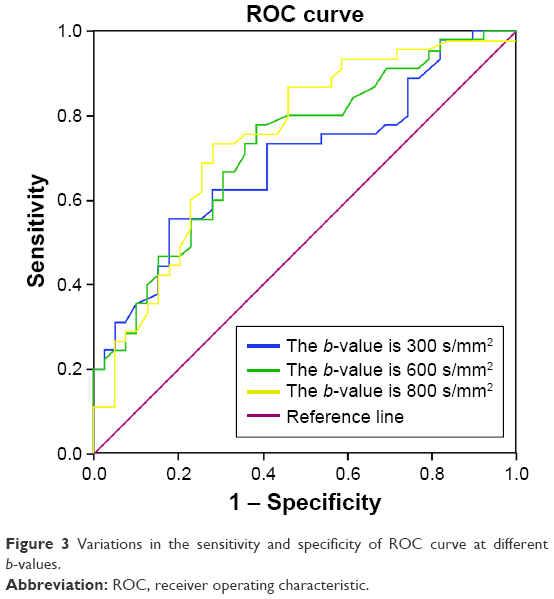 | Figure 3 Variations in the sensitivity and specificity of ROC curve at different b-values. |
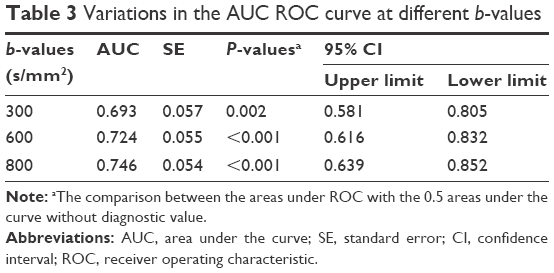 | Table 3 Variations in the AUC ROC curve at different b-values |
Predictors of disease progression after TACE
Factors such as tumor staging (Stages II and III), portal vein cancerous embolus, CTP score (A, B, and C), arteriovenous fistulas, and ADC values were analyzed using Cox’s regression model. The results revealed that the disease progression could be affected by a multiple of factors including ADC values (b=600 s/mm2 – relative risks [RRs]: 77.158; 95% CI: 1.583–3,761.794; 800 s/mm2 – RR: 2.456; 95% CI: 1.112–5.424), hepatitis B cirrhosis (RR: 4.045; 95% CI: 4.045–11.674), tumor staging (Stage II – RR: 6.382; 95% CI: 1.650–24.677; Stage III – RR: 12.316; 95% CI: 2.586–58.663), portal vein cancerous embolus (RR: 11.207; 95% CI: 4.050–31.008), CTP score (B classification – RR: 2.727; 95% CI: 1.370–5.427; C classification – RR: 18.453; 95% CI: 3.919–86.893), and arteriovenous fistulas (RR: 6.415; 95% CI: 2.186–18.828) (all P<0.05; Table 4).
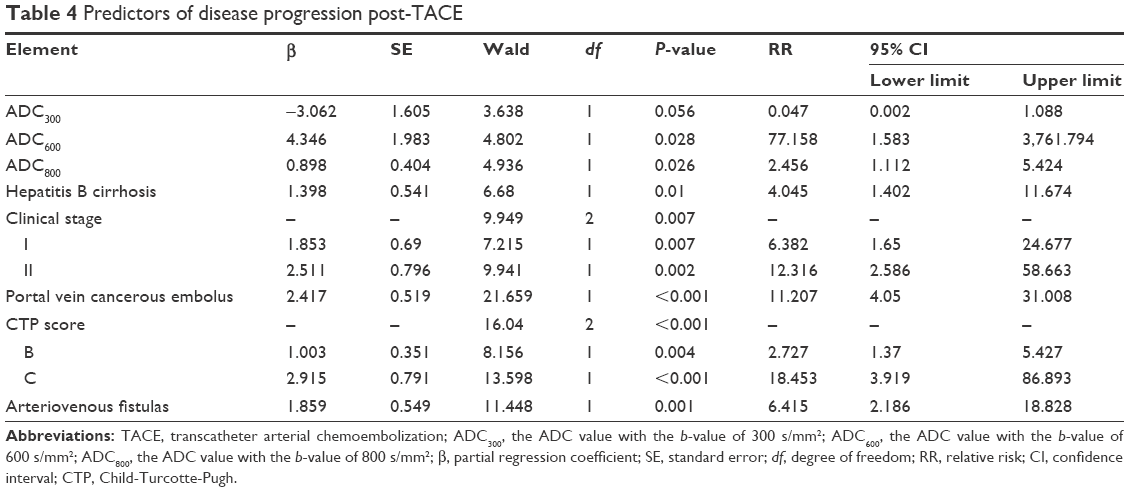 | Table 4 Predictors of disease progression post-TACE |
Discussion
Our findings indicate that the ADC values of MR-DWI may accurately predict the efficacy of TACE in the treatment of HCC patients. It is well-known that HCC is a common malignancy with a high morbidity and mortality rate worldwide.15 TACE is an optimal nonsurgical treatment for HCC which is internationally accepted.16 TACE can not block the blood supply to the tumor completely, which leads to incomplete tumor necrosis and recurrence.17 However, the combination of TACE and other treatments is identified to contribute to the survival of HCC patients compared with a single treatment.18 A proper evaluation system to predict the therapeutic efficacy after TACE is urgently needed, which is important to monitor the cancer development, providing indications for clinical project establishment and prognosis detection. Therefore, our findings may offer insights into the treatment of HCC.
In this study, a total of 84 HCC patients who received initial TACE in the hospital were divided into two groups randomly. Results showed that the HCC patients between the two groups significantly differed in hepatitis B cirrhosis, tumor staging, portal vein cancerous embolus, CTP score, and the ratio of arteriovenous fistulas. Furthermore, Cox analysis reveals that different ADC values, hepatitis B cirrhosis, tumor staging, portal vein cancerous embolus, CTP score, and arteriovenous fistulas prior to TACE could all affect the disease progression. This is also consistent with a previous study.19 The study showed that the ADC values of the HCC lesions could reflect the curative effects of TACE. One study reported that the ADC value reflects the diffusion process of water molecules.20 Tumor cell apoptosis and necrosis may occur in some carcinoma tissues for lack of blood and oxygen supply after TACE, which consequently leads to a higher ADC value.22 Therefore, it is reasonable for us to observe that the signal intensity of necrotic tumor tissues is lower, while its ADC value is significantly higher than that of the viable tumor in the DWI image. There is a negative correlation between the tumor ADC value and cell density.22 When the cell density increases, the extracellular space decreases, limiting the diffusion of water molecules, and thus the ADC values decrease accordingly. Cell density is a significant indicator of cellular differentiation and malignancy of the tumor.22 With this in mind, the ADC value may reflect the degree of malignancy to some extent. In this study, the incidence rate of postsurgical arteriovenous fistulas was relatively high, which may be correlated with disease severity and pathological types of HCC. Li et al23 reported that the changes of hepatic arteries and veins involved in fistulas can be used to diagnose hepatic arteriovenous fistula and assess its arterial embolization effect in HCC patients, and thus, we may conclude that the ratio of arteriovenous fistula was associated with HCC. Many factors may affect the determination of ADC values, such as image platforms, scanning sequences, and b-values. It was reported that the image quality is the best, and the signal-to-noise ratio is the highest at specific b-value of 600 s/mm2.3,24 Freiman et al25 demonstrated that a higher b-value can reduce the signal-to-noise ratio, while a lower b-value may be affected by blood perfusion easily. Our study clearly supported that the ADC values of HCC lesions could predict the curative effects of TACE.
In conclusion, our preliminary results indicated that the ADC values of MR-DWI may accurately predict the efficacy of TACE in the treatment of HCC patients. Nevertheless, measuring an ADC value with only three b-values seems not sound enough to conclude that it may predict the efficacy of TACE. Thus, further studies should investigate the diagnostic power of ADC values with different b-values for HCC efficacy. In addition, factors such as blood perfusion were not considered, and further studies are still required for a more comprehensive understanding of the indicative role of ADC value for HCC recurrence. Interestingly, different tissues of HCC tumors have been studied using different methods and it has been suggested that the tumors may be affected by the heterogeneity of the different organs. In addition, the DWI signal between tumors may be heterogeneous and quantitative evaluation of ADC values may not be able to switch from one tumor entity to another. Finally, DWI must be within a reasonable acquisition time, which limits the spatial resolution and may affect the readability of DWI and the calculation of ADC values.
Acknowledgment
We would like to acknowledge the helpful comments on this paper received from our reviewers.
Disclosure
The authors report no conflicts of interest in this work.
References
Li C, Li G, Miao R, et al. Primary liver cancer presenting as pyogenic liver abscess: characteristics, diagnosis, and management. J Surg oncology. 2012;105(7):687–691. | ||
Wei KR, Yu X, Zheng RS, et al. Incidence and mortality of liver cancer in China, 2010. Chin J Cancer. 2014;33(8):388–394. | ||
Zhang Y, Ren JS, Shi JF, et al. International trends in primary liver cancer incidence from 1973 to 2007. BMC Cancer. 2015;15:94. | ||
Sun V, Ferrell B, Juarez G, et al. Symptom concerns and quality of life in hepatobiliary cancers. Oncol Nurs Forum. 2008;35(3):E45–E52. | ||
Center MM, Jemal A. International trends in liver cancer incidence rates. Cancer Epidemio Biomarkers Prev. 2011;20(11):2362–2368. | ||
Zhu AX. Systemic therapy of advanced hepatocellular carcinoma: how hopeful should we be? Oncologist. 2006;11(7):790–800. | ||
Iwamoto S, Yamaguchi T, Hongo O, et al. Excellent outcomes with angiographic subsegmentectomy in the treatment of typical hepatocellular carcinoma: a retrospective study of local recurrence and long-term survival rates in 120 patients with hepatocellular carcinoma. Cancer. 2010;116(2):393–399. | ||
Zhou Y, Zhang X, Wu L, et al. Meta-analysis: preoperative transcatheter arterial chemoembolization does not improve prognosis of patients with resectable hepatocellular carcinoma. BMC Gastroenterology. 2013;13:51. | ||
Li H, Li N, Xiang Q, et al. Value of hepatic diffusion-weighted magnetic resonance imaging in evaluating liver fibrosis following transarterial chemoembolization with low doses of chemotherapy. Exp Ther Med. 2014;8(2):642–646. | ||
Rammohan A, Sathyanesan J, Ramaswami S, et al. Embolization of liver tumors: past, present and future. World J Radiol. 2012;4(9):405–412. | ||
Chen G, Ma DQ, He W, et al. Computed tomography perfusion in evaluating the therapeutic effect of transarterial chemoembolization for hepatocellular carcinoma. World J Gastroenterol. 2008;14(37):5738–5743. | ||
Koh DM, Collins DJ. Diffusion-weighted MRI in the body: applications and challenges in oncology. AJR Am J Roentgenol. 2007;188(6):1622–1635. | ||
Kwee TC, Takahara T, Ochiai R, et al. Diffusion-weighted whole-body imaging with background body signal suppression (DWIBS): features and potential applications in oncology. Eur Radiol. 2008;18(9):1937–1952. | ||
Lencioni R, Llovet JM. Modified RECIST (mRECIST) assessment for hepatocellular carcinoma. Semin Liver Dis. 2010;30(1):52–60. | ||
Ferlay J, Shin HR, Bray F, et al. Estimates of worldwide burden of cancer in 2008: GLOBOCAN 2008. Int J Cancer. 2010;127(12):2893–2917. | ||
Goshima S, Kanematsu M, Kondo H, et al. Evaluating local hepatocellular carcinoma recurrence post-transcatheter arterial chemoembolization: is diffusion-weighted MRI reliable as an indicator? J Magn Reson Imaging. 2008;27(4):834–839. | ||
Kubota K, Yamanishi T, Itoh S, et al. Role of diffusion-weighted imaging in evaluating therapeutic efficacy after transcatheter arterial chemoembolization for hepatocellular carcinoma. Oncol Rep. 2010;24(3):727–732. | ||
Li S, Zhang L, Huang ZM, Wu PH. Transcatheter arterial chemoembolization combined with ct-guided percutaneous thermal ablation versus hepatectomy in the treatment of hepatocellular carcinoma. Chin J Cancer. 2015;34(6):254–263. | ||
Shariff MI, Cox IJ, Gomaa AI, et al. Hepatocellular carcinoma: current trends in worldwide epidemiology, risk factors, diagnosis and therapeutics. Expert Rev Gastroenterol Hepatol. 2009;3(4):353–367. | ||
Li XR, Cheng LQ, Liu M, et al. DW-MRI ADC values can predict treatment response in patients with locally advanced breast cancer undergoing neoadjuvant chemotherapy. Med Oncol. 2012;29(2):425–431. | ||
Geschwind JF, Artemov D, Abraham S, et al. Chemoembolization of liver tumor in a rabbit model: assessment of tumor cell death with diffusion-weighted MR imaging and histologic analysis. J Vasc Interv Radiol. 2000;11(10):1245–1255. | ||
Gibbs P, Liney GP, Pickles MD, et al. Correlation of ADC and T2 measurements with cell density in prostate cancer at 3.0 Tesla. Invest Radiol. 2009;44(9):572–576. | ||
Li YY, Duan YY, Yan GZ, et al. Application of ultrasonography in the diagnosis and treatment tracing of hepatocellular carcinoma-associated arteriovenous fistulas. Liver Int. 2007;27(6):869–875. | ||
Vandecaveye V, De Keyzer F, Verslype C, et al. Diffusion-weighted MRI provides additional value to conventional dynamic contrast-enhanced MRI for detection of hepatocellular carcinoma. Eur Radiol. 2009;19(10):2456–2466. | ||
Freiman M, Voss SD, Mulkern RV, Perez-Rossello JM, Callahan MJ, Warfield SK. In vivo assessment of optimal b-value range for perfusion-insensitive apparent diffusion coefficient imaging. Medical Phys. 2012; 39(8):4832–4839. |
 © 2017 The Author(s). This work is published and licensed by Dove Medical Press Limited. The
full terms of this license are available at https://www.dovepress.com/terms
and incorporate the Creative Commons Attribution
- Non Commercial (unported, 3.0) License.
By accessing the work you hereby accept the Terms. Non-commercial uses of the work are permitted
without any further permission from Dove Medical Press Limited, provided the work is properly
attributed. For permission for commercial use of this work, please see paragraphs 4.2 and 5 of our Terms.
© 2017 The Author(s). This work is published and licensed by Dove Medical Press Limited. The
full terms of this license are available at https://www.dovepress.com/terms
and incorporate the Creative Commons Attribution
- Non Commercial (unported, 3.0) License.
By accessing the work you hereby accept the Terms. Non-commercial uses of the work are permitted
without any further permission from Dove Medical Press Limited, provided the work is properly
attributed. For permission for commercial use of this work, please see paragraphs 4.2 and 5 of our Terms.