")
Back to Journals » Journal of Multidisciplinary Healthcare » Volume 15
Evaluation of Drug Use Pattern in Pediatric Outpatient Clinics in a Tertiary Teaching Hospital Using WHO Drug-Prescribing Indicators
Authors Aldabagh A, Abu Farha R , Karout S, Itani R , Abu Hammour K, Alefishat E
Received 12 February 2022
Accepted for publication 28 April 2022
Published 18 May 2022 Volume 2022:15 Pages 1143—1151
DOI https://doi.org/10.2147/JMDH.S362172
Checked for plagiarism Yes
Review by Single anonymous peer review
Peer reviewer comments 3
Editor who approved publication: Dr Scott Fraser
Aya Aldabagh,1 Rana Abu Farha,1 Samar Karout,2 Rania Itani,2 Khawla Abu Hammour,3 Eman Alefishat3– 5
1Department Clinical Pharmacy, Faculty of Pharmacy, Applied Science Private University, Amman, Jordan; 2Pharmacy Practice Department, Faculty of Pharmacy, Beirut Arab University, Beirut, Lebanon; 3Department Biopharmaceutics and Clinical Pharmacy, Faculty of Pharmacy, The University of Jordan, Amman, Jordan; 4Department of Pharmacology, College of Medicine and Health Science, Khalifa University of Science and Technology, Abu Dhabi, United Arab Emirates; 5Center for Biotechnology, Khalifa University of Science and Technology, Abu Dhabi, United Arab Emirates
Correspondence: Eman Alefishat, Department of Pharmacology, College of Medicine and Health Science, Khalifa University of Science and Technology, P O Box 127788, Abu Dhabi, United Arab Emirates, Tel +9715018466, Email [email protected]
Purpose: The main aim of the study is to assess physicians’ prescribing patterns using the World Health Organization (WHO) prescribing indicators among pediatric outpatient clinics, and to identify areas in need of intervention regarding the rational use of medicines among pediatric outpatients in Jordan.
Methods: This is a descriptive observational cross-sectional study that was conducted at the outpatient pediatric clinics at Jordan University Hospital (JUH). During the study period, prescriptions were collected over a period of two months. Prescribing patterns were assessed using the five WHO drug prescribing indicators.
Results: A total of 1011 prescriptions/encounters were assessed. More than half of the encounters were for male patients (n= 595, 58.9%), and the median age of patients was eight years (IQR = 7.9). The average number of drugs prescribed per encounter was 1.8 ± 1.3; however, a specific individual clinic, the respiratory clinic, witnessed an average of 2.1 drugs prescribed per encounter. All of the prescribed drugs were prescribed by generic name (100%). Only 47.7% of the drugs were from the essential drug list of the JUH. Overall, antibiotics were prescribed in 19.5% of the encounters, but at higher rates in some clinics such as respiratory clinics (50.8%). Injectables were prescribed in 9.5% of the 1011 encounters; however, they were prescribed at higher rates in endocrinology and neurology clinics, in 44.8% and 31.3% of encounters, respectively.
Conclusion: This study revealed some adequate prescribing habits with an optimal prescribing pattern of generics and number of drugs per encounter among pediatric patients. However, the prescribing patterns of the essential drug list, antibiotics, and injectables, in specific clinics, failed to meet WHO standards. The findings of this study shed light on the need to establish national strategies to improve prescribing practices among the pediatric population.
Keywords: World Health Organization, irrational drug use, pediatrics, drug prescribing indicators, outpatient, Jordan
Introduction
Irrational drug prescribing is a major public health issue experienced by the healthcare sectors worldwide.1 It is defined as “prescribing that fails to conform to good standards of treatment”.2 It negatively affects drug therapy outcomes, increases the incidence of adverse drug reactions, increases the risk of drug-drug interactions,3 increases the demands on drugs monitoring, and infer unnecessary costs.4 Moreover, it may increase the frequency of emergency department visits, increase the length of hospital stay, and increase medications associated mortality.4
Inappropriate use of all medication has been estimated to be over 50%; this is reported to be at the levels these medications are prescribed, dispensed, or sold.2,5 Failure rates of more than 50% have been reported among patients to take their medication correctly.2,5 This level of irrational medication use is more significant in developing countries than in developed countries due to weaker health systems and less developed medicine use cycle monitoring mechanisms.3
To limit rational use of medications, the WHO established three core indicators; these indicators include prescribing indicators, patient care indicators, and healthcare facility-specific indicators. The use of these indicators is believed to support sound practice among prescribers and monitor medication prescribing patterns.6
The prescribing indicators help improve the prescribing habits and minimize the cost burden on both patientsand healthcare systems. The core prescribing indicators listed in the WHO manual include a group of parameters that are represented by 1) the average number of drugs per encounter, 2) the percentage of drugs prescribed by their generic names, 3) the percentage of encounter with prescribed antibiotics, 4) the percentage of encounter with prescribed injections, and 5) the number of drugs prescribed from the essential drug list. There is expanding evidence presenting these prescribing indicators as an essential assessment tool to evaluate the rational use of medications worldwide, especially in the developing countries.7
The pediatric population mandates special attention towards their health care.8 Although children represent a large proportion of the population in many developing countries (around 40%),9 generally, data on drug use in children is also scarce and underrepresented. In the Middle East and North Africa, where children and young people (0–24 year-olds) account for around half of the population, pediatrics requires specific attention due to the generally higher rates of irrational prescriptions among this age group. In Jordan, there is insufficient knowledge of drug prescribing patterns among the pediatric population.10 To our knowledge, this is the first study conducted to identify and screen medications’ prescribing patterns in pediatric patients in Jordan. Therefore, the aim of this study was to address the prescribing patterns of health care professionals among a pediatric population in Jordan.
Method
Study Design and Sample Size
This is a descriptive observational cross-sectional study that was conducted of pediatric patients (aged <18 years) at outpatient pediatric clinic at Jordan University Hospital (JUH), which is the first academic teaching 550-bed hospital in Jordan with 11 different medical departments. In this study, the prescribing pattern was evaluated using the WHO core prescribing indicators.
Data Collection
For each outpatient prescription, a pre-prepared data collection sheet was used to collect information about the prescribed medications, including drug name, drug dose, drug frequency, route of administration, and duration of therapy. Moreover, patients’ age, gender, insurance type, and outpatient clinic visited were also gathered from the details written in the prescriptions. All prescriptions were electronic and were collected from the different pediatric pharmacies using convenience sampling technique. Any prescription containing one medication or more was considered eligible to be collected whether the patients have chronic illnesses or not. Researchers at different days visited some of the pediatric pharmacies and asked them to provide them with some copies of the dispensed prescriptions at that day, and these prescriptions were returned back after collecting the required information from them.
Sample Size Calculation
According to WHO recommendations, the minimum number of prescriptions recommended to evaluate the prescribing indicators was 600 prescriptions,11 so we decided to recruit more than 600 prescriptions from the different pediatric clinics.
Operational Definitions
The core WHO prescribing indicators12 were calculated as follows:
- “The average number of drugs per encounter was calculated by dividing the total number of different drug products by the number of encounters evaluated.”
- “The percentage of encounters with antibiotics prescribed was calculated by dividing the number of patient encounters during which an antibiotic will be prescribed by the total number of patients encounters multiplied by 100”.
- “The percentage of encounters by generic name was determined by dividing the number of drugs will be prescribed by generic name by the total number of drugs in the prescription multiplied by 100”.
- “The percentage of encounters with an injection in prescription was calculated by dividing the number of patient encounters during which an injection will be prescribed by the total number of encounters multiplied by 100”.
- “The percentage of drugs in prescription from the essential drug list was determined by dividing the number of products in the prescription from the essential drug list by the total number of drugs in the prescription, multiplied by 100”.
Ethical Consideration
The World Medical Association Declaration of Helsinki guidance was followed in this study.13 The study was initiated after obtaining ethical approval by the Institutional Review Board (IRB) committee at Jordan University Hospital (Reference No. 312/2021). All the collected information was kept at the personal computer of the principal investigator using password-protected files.
Statistical Analysis
All the collected data were coded, entered, and analyzed using the Statistical Package for Social Sciences (SPSS) version 22. The descriptive analysis was conducted using mean/standard deviation (SD) for continuous variables or median/Interquartile range (IQR) based on normality. Checking for data normality was carried-out using the Shapiro–Wilk test (with P-value >0.05 indicating a normally distributed continuous variable). On the other hand, frequency (percentages) was used to express categorical variables.
Chi-squared analysis and ANOVA tests evaluated the differences in the five core prescribing standards between pediatric clinics. Chi-squared analysis was used for categorical variables and ANOVA tests for continuous variables. A P≤0.05 was considered statistically significant.
Results
Data was collected from 1011 prescriptions form the pediatric department between October 10 and December 12, 2021. More than half of the encounters were for male patients (n= 595, 58.9%), and almost the majority of them were for Jordanian patients (n= 992, 98.1%). The median age of patients was 8 years (IQR = 7.9) distributed at different age groups, as seen in Table 1. The majority of encounters (n= 975, 96.4%) were for patients with insurance either by the government/the ministry of health or personal insurance.
 |
Table 1 Sociodemographic Characteristics of Patients Included in the Study Encounters (N= 1011) |
Among the 1011 patients, around one-third prescription/encounters (n= 341, 33.7%) were from the neurology pediatric outpatient clinic, 31.2% (n= 315) were from the respiratory clinic, 13.9% (n= 141) from the endocrine clinic, 9.7% (n= 98) from the gastrointestinal clinic, and the remaining 11.5% (n= 116) were from the other pediatrics clinics (Figure 1).
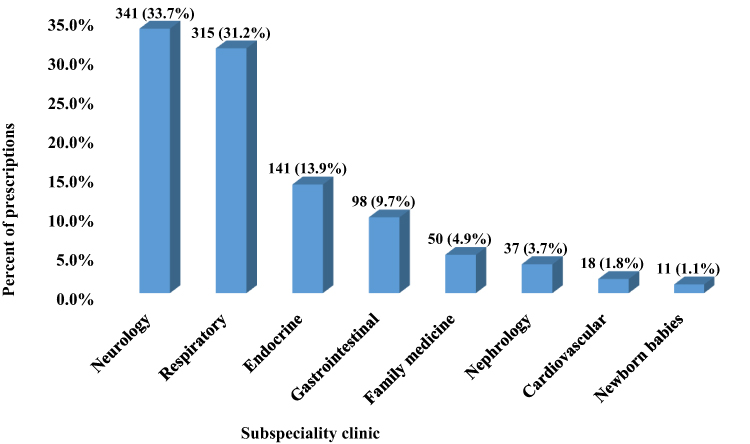 |
Figure 1 Patient disposition in each subspecialty clinic (The total number of prescription is 1011). |
In this study, among the recruited patients (n= 1011), a total of 1819 drugs were prescribed, and the number of prescribed medications per patient ranged from 1 to 8 medications per encounter with an average number of drugs per encounter of 1.8 among the study population. Figure 2 showed that only 5.7% of pediatric patients (n= 58) were receiving polypharmacy (≥5 prescribed drugs), while the majority of patients were receiving either one (n= 631, 62.4%) or two drug therapies (n= 161, 15.9%).
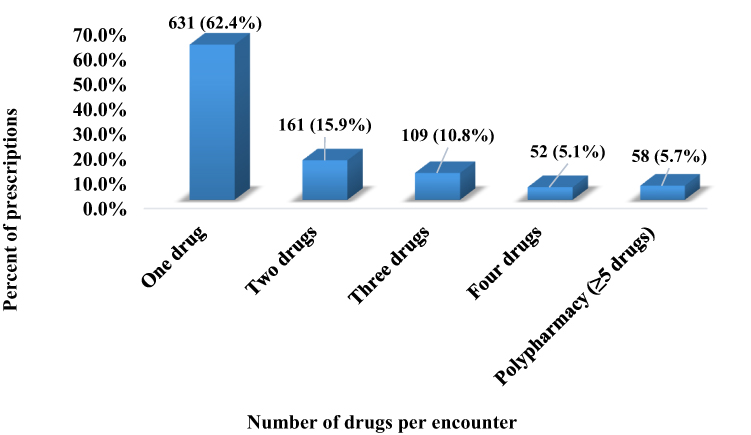 |
Figure 2 Patients’ distributions based on the number of drugs per encounter (The total number of prescription is 1011). |
Regarding the percentage of encounters with antibiotics, 19.5% (197) of encounters had antibiotics prescribed; the total number of prescribed antibiotics was 205. Among those encounters, the majority of encounters (n= 190/197= 96.4%) had only one antibiotic, while 6 encounters (6/197= 3.0%) had two antibiotics, and only one encounter (1/197= 0.5%) contain three antibiotics. Regarding the type of the 205 prescribed antibiotics, 12 different antibiotics were documented at the different clinics. The most commonly prescribed antibiotic was amoxicillin (n= 72, 35.1%) either alone or in combination with clavulanic acid, followed by azithromycin (n= 69, 33.7%), fucidic acid (n= 22, 10.7%) and cefixime (n= 21, 10.2%). Other prescribed antibiotics are seen in Table 2.
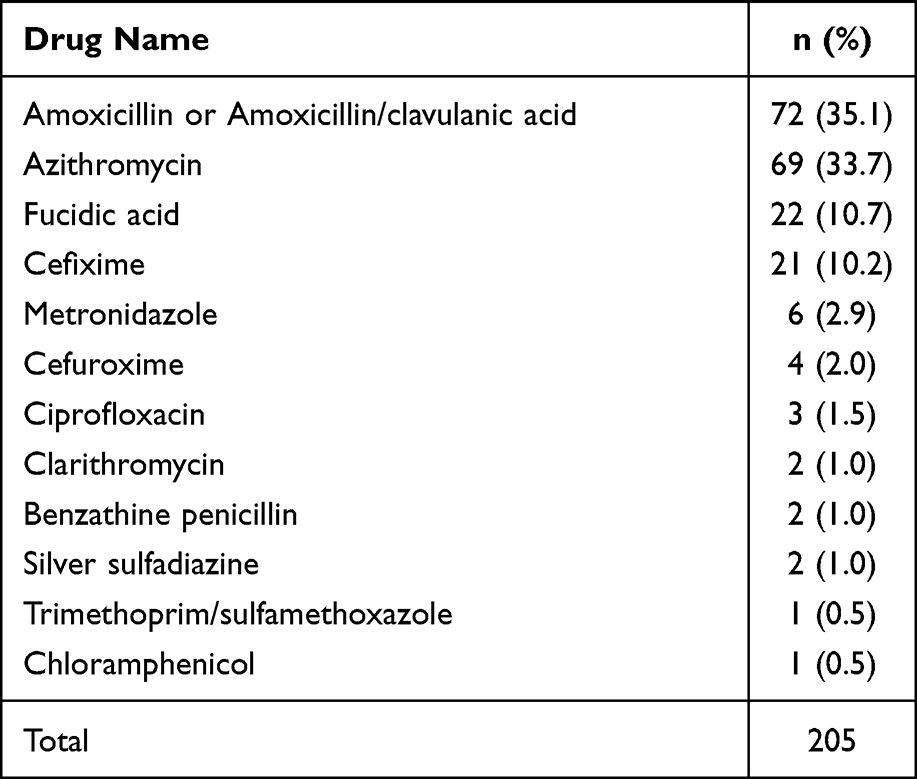 |
Table 2 Prescribed Antibiotics Among the Study Sample (N= 205) |
Injectables were prescribed in 9.5% of the encounters; in total 108 drugs prescribed were injectable medicines which were distributed over 96 encounters. Out of these 96 encounters, 85 (85/96= 88.5%) had only one injectable medicine, while 10 encounters (10/96= 10.4%) had two injectable medicines, and only one encounter (1/96= 1.0%) had three injectable medicines. Regarding the prescribed injectable medicine (n= 108), insulin was considered the most commonly prescribed injectable drug (n= 34, 31.5%), followed by botulinum toxin and vaccines (n= 20, 18.5% for both). Further details about the other prescribed injectable medicine are presented in Table 3.
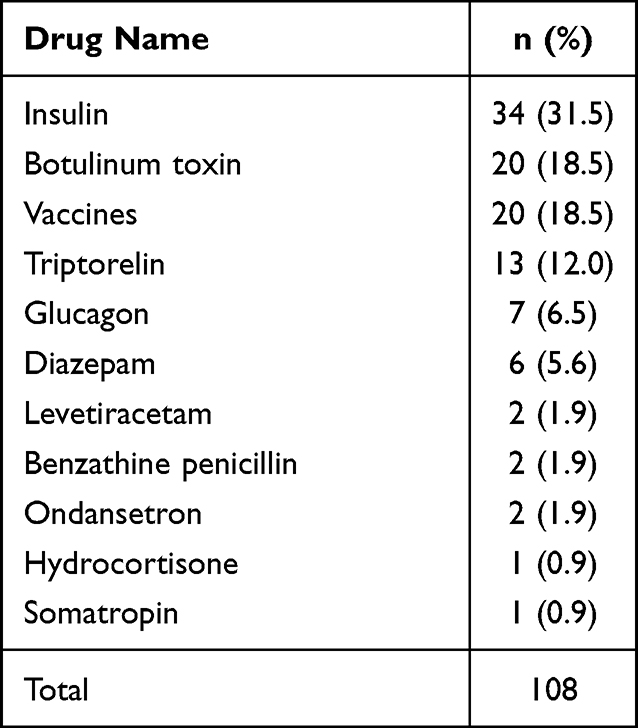 |
Table 3 Prescribed Injectable Medicine Among the Study Sample (N= 108) |
Table 4 shows the five core drug prescribing indicators where the average number of drugs prescribed per encounter was 1.8 ± 1.3. In addition, 100.0% of the drugs (n= 1819) were prescribed using their generic name (the international nonproprietary name). The percentage of drugs prescribed from the EDL of the JUH was 47.7% (n= 869). Across all the encounters, antibiotics were prescribed in 197 encounters (19.5%), while injectable medicine were prescribed in 96 encounters (9.5%).
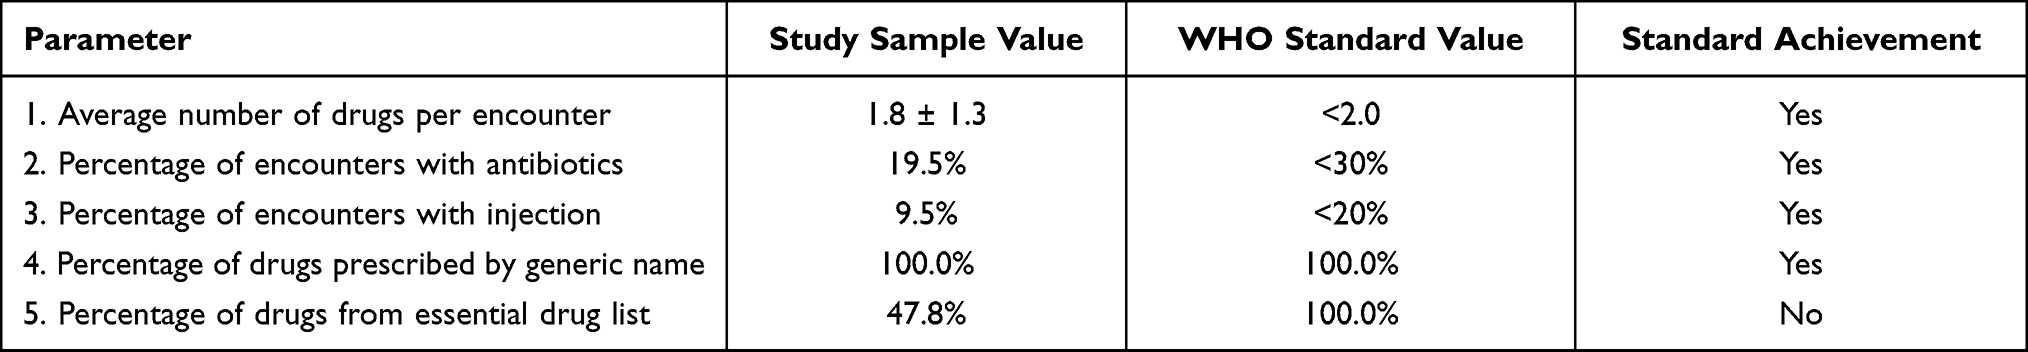 |
Table 4 Drug Core Prescribing Indicators Identified for the Study Sample (N= 1011) |
When comparing the different pediatric clinics (Table 5), the average number of drugs per encounter was higher in the respiratory clinic which had an average of 2.4 drugs per encounter (P<0.001). Respiratory clinics also showed the highest percentage of encounters with antibiotics prescribed (50.8%) compared to all other clinics (P<0.001). Besides, endocrine clinics showed the highest rates of prescribing injectable medicines (44.8%) compared to the different clinics (P<0.001). Finally, the gastrointestinal clinic showed the lowest percentages of drugs prescribed from the EDL at JUH (34.2%, P<0.001).
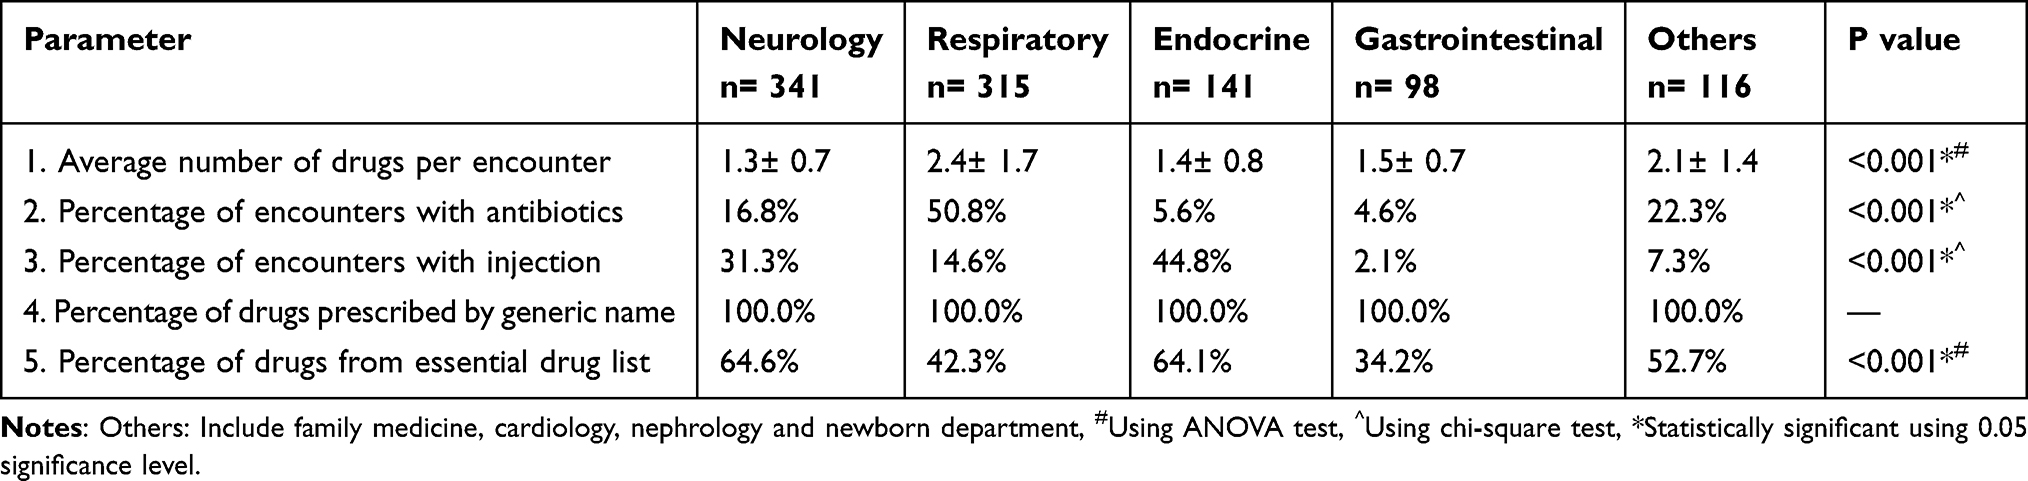 |
Table 5 Comparison of the Drug Core Prescribing Indicators Between the Different Pediatrics Outpatients Clinic (N= 1011) |
Discussion
In this study prescribing patterns have been documented among a pediatric population, using the WHO prescribing indicators.
Overall, the average number of drugs prescribed per encounter was 1.8, which is within the WHO standards that specify an upper limit of 2.0 drugs per encounter. Our results looked even more acceptable compared to similar studies conducted in Italy (2.9), Oman (2.3), India (2.29).14–16 This prescribing pattern was not universal across the different studied clinics, the respiratory clinic prescribing pattern failed to meet the WHO standards where an average number of 2.1 drugs prescribed per encounter was documented in this study. Interventions to correct such prescribing patterns can potentially lower the risk for drug-drug interactions, fewer adverse drug effects, and better tolerability. This may also be associated with a more lowering healthcare cost and better patient compliance, which in turn may lead to a successful treatment.17,18 Fortunately, the majority of pediatric patients received only one drug (62.4%).
The proportion of generics prescribed was as high as 100%. This high prescribing habit could be due to the strong influence of local pharmaceutical companies, knowing that substantially a high percentage of gross domestic product comes from Jordan’s pharmaceutical companies, while compared to other developing countries, it is one of the highest.19 This finding reflects a significant indicator of rational prescribing, as it promotes access to drugs, and affordability, thus encouraging treatment adherence.20,21 Several observational studies also revealed that it reduced government and patient expenditure on pharmaceuticals.21,22 Moreover, it facilitated communication between health care providers and reduced the risk for drug confusion.23,24 Interestingly, the results are much higher than results reported in previous studies conducted in Kenya (52%), Nigeria (49.5%), Sudan (49%), and Senegal (19%).8,24–26 As such, various rates of generic prescribing have been reported in literature owing to differences in the level of experience of physicians, the influence of pharmaceutical companies, compliance to international guidelines, and availability of drugs.26–28
Injectables were prescribed in 9.5% of the 1011 encounters; this is considered an acceptable prescribing pattern according to the WHO standards, where no more than 20% is specified as the upper limit. However, slightly lower levels were reported in recent studies conducted in Sudan (3.5%), India (1.6%), and Senegal (1.3%).24,25,28 While higher injectables prescribing levels have been reported in Oman (15%), and Pakistan (27%).29,30 Although the percentage of encounters with injections in the overall sample satisfied the WHO standards,12 this was not the case in all individual clinics, the endocrinology and neurology clinics witnessed significantly higher rates of 44.8%, and 31.3%, respectively. Although the higher rates in the endocrinology clinics can be partially explained by the need to use injectable peptides, the unnecessary and unsafe use of injectables can increase the risk for blood-borne infections and increase hospital waste particularly in countries with no adequate waste management systems. Moreover, unnecessary pain and injection site reactions.31,32
The percentage of drugs prescribed from the essential drug list failed to meet WHO standards among the pediatric population in this study. Only 47.7% of the drugs were from the EDL of the JUH lower than 50% of the proposed WHO reference value, showing low compliance to hospital EML most probably due to low dissemination, and awareness of EML for children. In addition, a high incidence of off-labeled or unapproved use of drugs is extremely used in the pediatric population.33 This perhaps could be a leading cause of this deviation, and low adherence to the WHO reference value. Almost similar essential medicine prescribing was reported in a study conducted in Senegal.24 Higher percentages of drugs prescribed from the essential list were reported in Pakistan (93.4%).29 This finding reflects on the importance of raising awareness on essential medicine use in the context of the pediatric population, which is crucial in reducing morbidity and mortality, gaining public trust, supporting health care system credibility as well as improving the utilization of scarce use resources.34 Furthermore, a proposed method could be designing a wise list, such as the one implemented in Sweden, with high adherence to just 200 essential medicines instead of more.35 This could increase the familiarity of prescribers with important good quality medicines, reducing irrationality, decreasing confusion of medicines, and lowering health care costs for both parties’ patient and government.33 Future follow-up studies should be conducted to assess the availability, and awareness of pediatric EML to physicians.
An overall appropriate use of antibiotics has been found in this study; 19.5% of the encounters have antibiotics prescribed, which is within the WHO standard range of up to 30%.12 However, significantly higher prescribing rates of antibiotic were recorded in individual clinics in particular, respiratory clinics where the percentage of encounters with antibiotic was significantly higher than the acceptable WHO standards (50.8%, P<0.001). Studies from Denmark and Sweden reported that antibiotics were among the most commonly prescribed medications in pediatric patients.36 Furthermore, it is worth mentioning that recent studies reported a significantly higher proportion of antibiotic use.23,24,34 The overall appropriate antibiotic prescribing (19.5%) in this study can be due to the antibiotic policy that has contributed to a low rate of antibiotic prescription. In Jordan, health care parties launched a national action plan to combat antimicrobial resistance that aimed at strengthening knowledge and evidence about the rational use of antibiotics. This tool was an effective evidence-based antibiotic developed for health care facilities to optimize antibiotic use and improve awareness of antimicrobial resistance through education and training.37,38 Our results highlight for local authorities in Jordan the need to intensively use the aforementioned national action plans to target specific clinics such as respiratory where there is room for improvement in their prescribing patterns compared to other clinics.
This study has several strengths such as a representative sample size of 1011 prescriptions from pediatric patients treated in outpatient clinics in a large tertiary teaching hospital. This study avoided possible prescriber reporting bias since the data was via observation of prescriptions with no prescriber interference. Moreover, it focuses on an understudied age group among which prescribing patterns and rational prescribing have not yet been addressed sufficiently. However, conducting this study in a single health care facility may limit the conclusions of the study as it might not be applicable to the general population. In addition, the study did not take into account seasonal variations, diagnosis of each condition that could affect rational prescribing practices. Another limitation that is linked to the WHO prescribing indicators is that it indicates the number of medications merely and does not indicate their adequacy based on the diagnosis. Finally, the number of prescriptions studied from the different clinics is variable, which might affect study generalizability.
Conclusion
This study revealed some adequate prescribing habits with an optimal prescribing pattern of generics and number of drugs per encounter among pediatric patients. However, the prescribing patterns of the essential drug list, antibiotics, and injectables, in specific clinics, failed to meet WHO standards. The findings of this study shed light on the need to further target pediatric clinics and enforce national strategies to tackle incompliant prescribing practices among the pediatric population.
Author Contributions
All authors made a significant contribution to the work reported, whether that is in the conception, study design, execution, acquisition of data, analysis and interpretation, or in all these areas; took part in drafting, revising or critically reviewing the article; gave final approval of the version to be published; have agreed on the journal to which the article has been submitted; and agree to be accountable for all aspects of the work.
Funding
There is no funding to report.
Disclosure
The authors declare that they have no competing interests in this work.
References
1. Ofori-Asenso R, Agyeman AA. Irrational use of medicines-a summary of key concepts. Pharmacy. 2016;4(4). doi:10.3390/pharmacy4040035
2. World Health Organization. The rational use of drugs and WHO. Dev Dialogue. 1985;2:1–4.
3. Ofori-Asenso R, Brhlikova P, Pollock AM. Prescribing indicators at primary health care centers within the WHO African region: a systematic analysis (1995–2015). BMC Public Health. 2016;16(1):724. doi:10.1186/s12889-016-3428-8
4. Mao W, Vu H, Xie Z, Chen W, Tang S. Systematic review on irrational use of medicines in China and Vietnam. PLoS One. 2015;10(3):e0117710. doi:10.1371/journal.pone.0117710
5. Hogerzeil HV. Promoting rational prescribing: an international perspective. Br J Clin Pharmacol. 1995;39(1):1–6. doi:10.1111/j.1365-2125.1995.tb04402.x
6. Mahmood A, Elnour AA, Ali AAA, Hassan NA, Shehab A, Bhagavathula AS. Evaluation of rational use of medicines (RUM) in four government hospitals in UAE. Saudi Pharm J. 2016;24(2):189–196. doi:10.1016/j.jsps.2015.03.003
7. Toska A, Geitona M. Antibiotic resistance and irrational prescribing in paediatric clinics in Greece. Br j nurs. 2015;24(1):28–33. doi:10.12968/bjon.2015.24.1.28
8. Joseph F, Oladele O, Oludare O, Olatunde O. Drug prescribing pattern for under-fives in a paediatric clinic in South-Western Nigeria. Ethiopian Journal of Health Sciences. 2015;25(1):73–78. doi:10.4314/ejhs.v25i1.10
9. Kumar VPN, Antony LJ, Maharani B, Jaikumar S, Somasundaram G. Prescription pattern of drugs used in pediatric patients of a tertiary care hospital in Puducherry. Natl J Physiol Pharm Pharmacol. 2021;11(4):380–384.
10. Mukattash T, Nuseir K, Jarab A, Alzoubi K, Al-Azzam S, Shara M. Sources of Information used when prescribing for children, a survey of hospital based pediatricians. Curr Clin Pharmacol. 2014;9(4):395–398. doi:10.2174/1574884708666131111205339
11. World Health Organization. How to investigate drug use in health facilities: selected drug use indicators; 1993.
12. World Health Organization. Using indicators to measure country pharmaceutical situations: fact book on WHO level I and level II monitoring indicators; 2006.
13. World Medical A. World medical association declaration of Helsinki: ethical principles for medical research involving human subjects. JAMA. 2013;310(20):2191–2194.
14. Clavenna A, Berti A, Gualandi L, Rossi E, De Rosa M, Bonati M. Drug utilisation profile in the Italian paediatric population. Eur J Pediatr. 2009;168(2):173–180. doi:10.1007/s00431-008-0725-y
15. Jose J, Devassykutty D. Paediatric prescription analysis in a primary health care institution. JCDR. 2016;10(11):FC05. doi:10.7860/JCDR/2016/22350.8797
16. Al-Maqbali KS, Haridass S, Hassali MA, Nouri AI. Analysis of pediatric outpatient prescriptions in a polyclinic of Oman. Glob J Med Res. 2019;3:45.
17. Halli-Tierney AD, Scarbrough C, Carroll D. Polypharmacy: evaluating risks and deprescribing. Am Fam Physician. 2019;100(1):32–38.
18. Horace AE, Ahmed F. Polypharmacy in pediatric patients and opportunities for pharmacists’ involvement. Integr Pharm Res Pract. 2015;4:113. doi:10.2147/IPRP.S64535
19. Alabbadi I, Abbott R, Jaber D. Jordanian stakeholder attitudes toward generic substitution. J Generic Med. 2014;11(1–2):24–34. doi:10.1177/1741134314560289
20. Soubra L, Karout S. Dispensing errors in Lebanese community pharmacies: incidence, types, underlying causes, and associated factors. Pharm Pract (Granada). 2021;19(1):2170. doi:10.18549/PharmPract.2021.1.2170
21. Jain S, Jain P, Moghe V, et al. A systematic review of prescription pattern monitoring studies and their effectiveness in promoting rational use of medicines. Perspect Clin Res. 2015;6(2):86–90. doi:10.4103/2229-3485.154005
22. Corrick F, Conroy S, Sammons H, Choonara I. Paediatric rational prescribing: a systematic review of assessment tools. Int J Environ Res Public Health. 2020;17(5):1473.
23. Sharma A, Shweta O. Assessment of drug prescription pattern in children: a descriptive study. Natl J Physiol Pharm Pharmacol. 2016;6(1):74–80. doi:10.5455/njppp.2015.5.1110201581
24. Bassoum O, Ba MF, Sougou NM, Fall D, Faye A. Evaluation of prescribing indicators in a paediatric population seen in an outpatient consultation at the Gaspard Kamara Health Centre in 2019 (Senegal). Pharmacy. 2021;9(2):113. doi:10.3390/pharmacy9020113
25. Ahmed AM, Awad AI. Drug use practices at pediatric hospitals of Khartoum State, Sudan. Ann Pharmacother. 2010;44(12):1986–1993. doi:10.1345/aph.1P423
26. Ambetsa MO, Oluka MN, Okalebo FA, Mulwa NC, Fadare J, Godman B. One-day out-patient prescribing patterns at a national referral hospital in Kenya. Afr J Pharmacol Ther. 2017;6(2):45.
27. Sharma S, Bowman C, Alladin-Karan B, Singh N. Antibiotic prescribing patterns in the pediatric emergency department at Georgetown Public Hospital Corporation: a retrospective chart review. BMC Infect Dis. 2016;16(1):1–6. doi:10.1186/s12879-016-1512-4
28. Pandey AA, Thakre SB, Bhatkule PR. Prescription analysis of pediatric outpatient practice in Nagpur city. Indian J Community Med. 2010;35(1):70. doi:10.4103/0970-0218.62564
29. Atif M, Sarwar MR, Azeem M, Naz M, Amir S, Nazir K. Assessment of core drug use indicators using WHO/INRUD methodology at primary healthcare centers in Bahawalpur, Pakistan. BMC Health Serv Res. 2016;16(1):684. doi:10.1186/s12913-016-1932-2
30. Al Balushi K, Al-Sawafi F, Al-Ghafri F, Al-Zakwani I. Drug utilization pattern in an Omani pediatric population. J Basic Clin Pharm. 2013;4(3):68. doi:10.4103/0976-0105.118808
31. Awodele O, Adewoye AA, Oparah AC. Assessment of medical waste management in seven hospitals in Lagos, Nigeria. BMC Public Health. 2016;16(1):1–11. doi:10.1186/s12889-016-2916-1
32. Hayashi T, Hutin YJ-F, Bulterys M, Altaf A, Allegranzi B. Injection practices in 2011–2015: a review using data from the demographic and health surveys (DHS). BMC Health Serv Res. 2019;19(1):1–10. doi:10.1186/s12913-019-4366-9
33. Sharif S, Nassar A, Al-Hamami F, Hassanein M, Elmi A, Sharif R. Trends of pediatric outpatients prescribing in Umm Al Quwain, United Arab Emirates. Pharmacol Pharm. 2015;06:9–16. doi:10.4236/pp.2015.61002
34. Taglione MS, Ahmad H, Slater M, et al. Development of a preliminary essential medicines list for Canada. CMAJ Open. 2017;5(1):E137. doi:10.9778/cmajo.20160122
35. Gustafsson LL, Wettermark B, Godman B, et al. The “wise list”–a comprehensive concept to select, communicate and achieve adherence to recommendations of essential drugs in ambulatory care in Stockholm. Basic Clin Pharmacol Toxicol. 2011;108(4):224–233. doi:10.1111/j.1742-7843.2011.00682.x
36. Sturkenboom MCJM, Verhamme KMC, Nicolosi A, et al. Drug use in children: cohort study in three European countries. BMJ (Clinical Research Ed.). 2008;337:337. doi:10.1136/bmj.a2245
37. NAP. National Action Plan to combat antimicrobial resistance in Hashemite Kingdom of Jordan (2018–2022); 2018.
38. Nazer LH, Tuffaha H. Health care and pharmacy practice in Jordan. Can J Hosp Pharm. 2017;70(2):150. doi:10.4212/cjhp.v70i2.1649
 © 2022 The Author(s). This work is published and licensed by Dove Medical Press Limited. The
full terms of this license are available at https://www.dovepress.com/terms.php
and incorporate the Creative Commons Attribution
- Non Commercial (unported, v3.0) License.
By accessing the work you hereby accept the Terms. Non-commercial uses of the work are permitted
without any further permission from Dove Medical Press Limited, provided the work is properly
attributed. For permission for commercial use of this work, please see paragraphs 4.2 and 5 of our Terms.
© 2022 The Author(s). This work is published and licensed by Dove Medical Press Limited. The
full terms of this license are available at https://www.dovepress.com/terms.php
and incorporate the Creative Commons Attribution
- Non Commercial (unported, v3.0) License.
By accessing the work you hereby accept the Terms. Non-commercial uses of the work are permitted
without any further permission from Dove Medical Press Limited, provided the work is properly
attributed. For permission for commercial use of this work, please see paragraphs 4.2 and 5 of our Terms.