Back to Archived Journals » Integrated Blood Pressure Control » Volume 14
Evaluation of Anthropometric Indices for Screening Hypertension Among Employees of Mizan Tepi University, Southwestern Ethiopia
Authors Dereje R, Hassen K ![]() , Gizaw G
, Gizaw G ![]()
Received 22 April 2021
Accepted for publication 7 July 2021
Published 16 July 2021 Volume 2021:14 Pages 99—111
DOI https://doi.org/10.2147/IBPC.S317018
Checked for plagiarism Yes
Review by Single anonymous peer review
Peer reviewer comments 3
Editor who approved publication: Professor Turgay Celik
Rahel Dereje,1,2 Kalkidan Hassen,1 Getu Gizaw1
1Department of Nutrition and Dietetics, Institute of Health Science, Faculty of Public Health, Jimma University, Jimma, Ethiopia; 2School of Public Health, College of Medicine and Health Science, Mizan Tepi University, Mizan Aman, Ethiopia
Correspondence: Rahel Dereje Email [email protected]
Background: Globally, hypertension is becoming a serious problem affecting the health and wellbeing of the adult population. Anthropometric indices like body mass index (BMI), waist circumference (WC), and waist-to-hip ratio (WHR) have long been utilized to screen hypertension; in contrast, other evidence indicates the superior utility of waist-to-height ratio (WHtR) to screen hypertension. There are inconclusive results from different studies done in different settings regarding the best screening index for hypertension. In addition, there is a paucity of information on the evaluation of anthropometric indices for screening hypertension in the study area. Therefore, this study evaluates the utility of anthropometric indices for screening hypertension among Mizan Tepi University employees, southwestern Ethiopia.
Methods: An institution-based cross-sectional study was conducted among Mizan Tepi University employees. A gender-based stratified simple random sampling technique was used to select 585 employees. Logistic regression analysis was conducted to assess the association between anthropometric indices and hypertension. Receiver operating characteristic curve (ROC) was employed to evaluate anthropometric indices for screening hypertension, and optimal cutoff points were also developed based on Youden index (sensitivity + specificity – 1) and presented with sensitivity, specificity, positive predictive value (PPV), and negative predictive values (NPV).
Results: The overall prevalence of hypertension was 20.9%, which was 22.5% in males and 18.7% in females. Among males, WHtR, WHR, and BMI were significantly associated with hypertension, while, in females, only BMI was associated with hypertension. WHtR had a higher screening ability for hypertension followed by WC in both sexes. For males, the cutoff point for WHR, WC, BMI, and WHtR for screening hypertension was 0.897, 85.17cm, 24.6kg/m2, and 0.51, respectively. In females, the cutoff point developed for screening hypertension for WHR, WC, BMI, and WHtR were 0.92, 85.67cm, 24.8kg/m2, and 0.52, respectively.
Conclusion: The waist-to-height ratio was found to be the best obesity index to screen hypertension than BMI, WC, and WHR. The finding supports the use of WHtR for screening hypertension in resource-limited settings.
Keywords: obesity, WHtR, BMI, WHR, WC
Introduction
Hypertension is a clinical condition of having elevated systolic blood pressure (SBP) and/or diastolic blood pressure (DBP).1 It is a major public health problem globally, 1.13 billion adult populations were hypertensive in 2015.2 The worldwide prevalence of overweight or obesity, which is the major risk factor for hypertension, was tripled from 1975 to 2016.3 Nowadays, low- and middle-income countries are facing challenges from non-communicable diseases (NCD) in addition to undernutrition and communicable disease.3 In 2015, the prevalence of hypertension in sub-Saharan Africa was 30% among these, 73% of them were unaware of their hypertensive status before the survey.4 The prevalence of hypertension is also increasing in Ethiopia, which was 19.6% in 20155 and it was responsible for 12% of deaths that occurred due to NCDs in Addis Ababa.6,7 The prevalence of hypertension was 13.9% in Gondar city, 22% in Bahirdar, 12.5% in Debre Markos town, 32.3% Addis Ababa, 30.8% in Kombolcha town, 21.8% in Bonsa district, and 23% in Mizan Aman town.8–14
Hypertension and related complications are very expensive for diagnosis and treatment, leading to under-diagnosis which may result in increased prevalence of the disease in society.15 Therefore, in resource-limited settings, like Ethiopia, prevention and early identification are very important to control hypertension. Anthropometric indices like body mass index (BMI), waist circumference (WC), waist-to-height ratio (WHtR), and waist-to-hip ratio (WHR) are very important for early identification of obesity, which may lead to hypertension.16,17 However, there is inconclusive evidence from different kinds of literature regarding the best anthropometric index to screen hypertension.18 BMI was traditionally chosen and used as the main index and it was indicated as a better index to predict hypertension than WHtR and WC.19,20 However, body fat assessment using BMI could be incorrect since it measures total adiposity in the body and predicts the distribution of total body fat. This may result in overestimation of adiposity in a healthy individual that has more muscle mass and underestimation of adiposity in an at-risk individual that has more fat mass.21,22
Measures of abdominal fat distribution, including WC, WHtR, and WHR were studied in different settings giving different results regarding their predictive ability of hypertension. In some literature, WC was indicated to have better screening ability than WHtR, BMI, and WHR.15,23–27 However, it fails to consider the height of an individual; taller people have larger WC relative to their height.28 Other studies found WHR as the best anthropometric index to screen hypertension than WC, BMI, and WHtR.15,29 WHR is important for risk assessment but not for risk management, and it misclassified the risk of disease among individuals with the same WC but different hip circumference (HC).30,31
The waist-to-height ratio is another central obesity index that has recently gained attention. Recent systematic reviews propose WHtR as a better predictor of hypertension than WHR, BMI, and WC in both sexes.32–34 It was also found to be a better predictor of morbidity and mortality than other indices.35–37 Even if the prevalence of hypertension is rising in low-income countries including Ethiopia, there is a paucity of information on the evaluation of anthropometric indices for screening hypertension in the study area. Therefore, the aim of this study was to evaluate the utility of anthropometric indices for screening hypertension among employees of Mizan Tepi University, southwestern Ethiopia.
Materials and Methods
Study Setting and Period
The institution-based cross-sectional study design was employed to conduct this study among employees of Mizan Tepi University, South-Western Ethiopia. Mizan Tepi University has four colleges and one school. The university has a total of 2478 employees, of which 1028 were administrative staff, 792 academic staff, and 658 hospital staff. Among the academic staff, 248 employees are on study leave and 544 employees are on duty. The study was conducted from February 21 to March 20, 2020.
Source and Study Population
The source population was all employees of Mizan Tepi University. And the study population was those representatively randomly selected employees.
Sample Size and Sampling Procedure
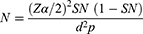
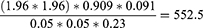
The sample size of this study was calculated by using sensitivity estimation formula38 (n= (Zα/2)2SN (1-SN)/d2p) by considering 95% confidence interval, 5% margin of error, the sensitivity of 90.9%25 and prevalence of hypertension in Mizan Aman, which was 23%.14 After adding a 10% non-response rate the final sample size was 608.
A gender-based Stratified sampling technique was employed to select the study participants. Among the total of 2230 employees, 544, 1028, 658 were academic, administrative, and hospital staff, respectively. First, employees were stratified by gender 1299 males and 931 females. Then, from 608 samples calculated from the sensitivity estimation formula considering allocation ratio, we have got 354 males and 254 female participants. The sampling frame was prepared separately by using the payroll obtained from Mizan Tepi University’s human resource management. Finally, random numbers were generated to select participants by using a computer-generated simple random sampling technique.
Inclusion and Exclusion Criteria
All employees who were found actively working during the data collection period were included in this study. Self-declared hypertensive patients and self-declared pregnant women were excluded from the study.
Data Collection Tools and Procedures
Interviewer administered structured questionnaire was used to collect data. The questionnaire was adapted from the WHO Stepwise approach to chronic disease risk factor surveillance (STEPS) to the local context.39 Four degree nurses were recruited for data collection and one health officer was assigned as a supervisor.
Anthropometric Measurements
Height was measured by using a portable stadiometer (Seca) with precision nearest to 0.1 cm. Before measurements, the stadiometer was checked using calibration rods. During measurements, the individual stood at the Frankfurt plane; the shoulder, buttocks, calf, heel, and back of the head were touching the vertical stand of the stadiometer, and participants were asked to take off their shoes. Bodyweight was measured by using a digital scale (UNICEF SECA) having a precision of 0.1 kg. Every morning, the validity of the scale was checked by weighing an object of well-known weight. Then, BMI was calculated by dividing body weight in kilogram by height in meters square, and the cutoff point was 25 kg/m2 for both females and males.40 The WC was measured by fixed tension tape with the precision of 0.1cm midway between the lowest costal margin at the mid-clavicular line and the anterior superior iliac spine and the cutoff points used was 94cm for males and 80 cm for females.41 Hip circumference (HC) was measured at the level parallel to the floor, at the largest circumference of the buttock with both hands open widely. Then WHR is calculated by dividing WC to HC in centimeter. The cutoff point used for WHR was 0.9 for males and 0.85 for females.41 WHtR calculated by dividing WC by height and the optimal cutoff point for both sexes was 0.5.34 All anthropometric measurements were measured three times and the average was taken for analysis. The standardization exercise was done to reduce inter-observer error.
Blood Pressure Measurement
Blood Pressure was measured by an automatic blood pressure monitor (Digital Omron, HEM/7111). Before the measurement of blood pressure, the participants were seated on a chair, took rest for fifteen minutes while their backs were supported and their feet touched the ground and right arm supported, the cubital fossa was at heart level, with a palm facing upward.42 The second blood pressure measurement was taken after 5 minutes of the first measurement and the third measurement was taken 3 minutes of the second measurement. Then, the average of three measurements was taken as blood pressure values.
Data Processing and Analysis
First, data were checked for completeness and consistency and double entered to Epi data version 3.1 and then the data files were exported to SPSS version 22 for analysis. The data were cleaned by correcting missing values and checking outlier. For continuous variables, normality was checked for by the Kolmogorov–Smirnov test. Descriptive statistic was reported as mean and standard deviation among the hypertensive and non-hypertensive employees and categorical data were expressed as proportions among the hypertensive and non-hypertensive participants. The association between anthropometric indices, including BMI, WHtR, WC and WHR, and blood pressure was assessed by logistic regression after adjusting for covariates like age, smoking status, khat chewing, coffee drinking, alcohol intake, physical activity, and main work status. First bivariate analysis was conducted and those variables with p-value <0.25 were selected as candidate variables and entered a multivariate logistic regression analysis. Then, statistically significance was declared at a p-value <0.05. To evaluate the utility of anthropometric indices for screening hypertension, the area under the curve was calculated from the receiver operating characteristic curve (ROC) based on hypertensive status classifying as yes (SBP≥140mmHg and/or DBP≥90mmHg) and no (SBP<140mmHg and/or DBP<90). Optimal cutoff points were selected based on maximum Youden index (sensitivity + specificity – 1) and presented with Sensitivity, specificity, positive predictive value (PPV), and negative predictive values (NPV).
Ethical Consideration
Before the study begins, ethical clearance was obtained from the ethical review committee of Jimma University Institute of Health, and the support letter was obtained from the Department of Human Nutrition and Dietetics. The official written permission letter was obtained from Mizan Tepi University, and participants were provided with written informed consent before the interview. Privacy and confidentiality were ensured, and the participants were told that they have the right to refuse participation. The study was conducted according to the declaration of Helsinki. The ethical approval number was IRB00065/2020. During the data collection period, face masks, hand gloves, and sanitizer were provided to the data collection team to protect the data collectors and participants from coronavirus infection. During the assessment, when higher blood pressure was found, then they were linked to the nearby health center for further diagnosis and treatment.
Results
Among 585 study participants, 252 of them were females and 333 were males. Among hypertensive participants, around 38.66% of male and 40.42% of female employees were Bench by ethnicity. And among the non-hypertensive, 36.43% of males and 37.07 of females employees were bench by ethnicity. Among the hypertensive participants, 50.7% of males and 63.82% of females were administrative staffs (Table 1). The mean (standard deviation) age of the total participants was 32.3 (6.6) years.
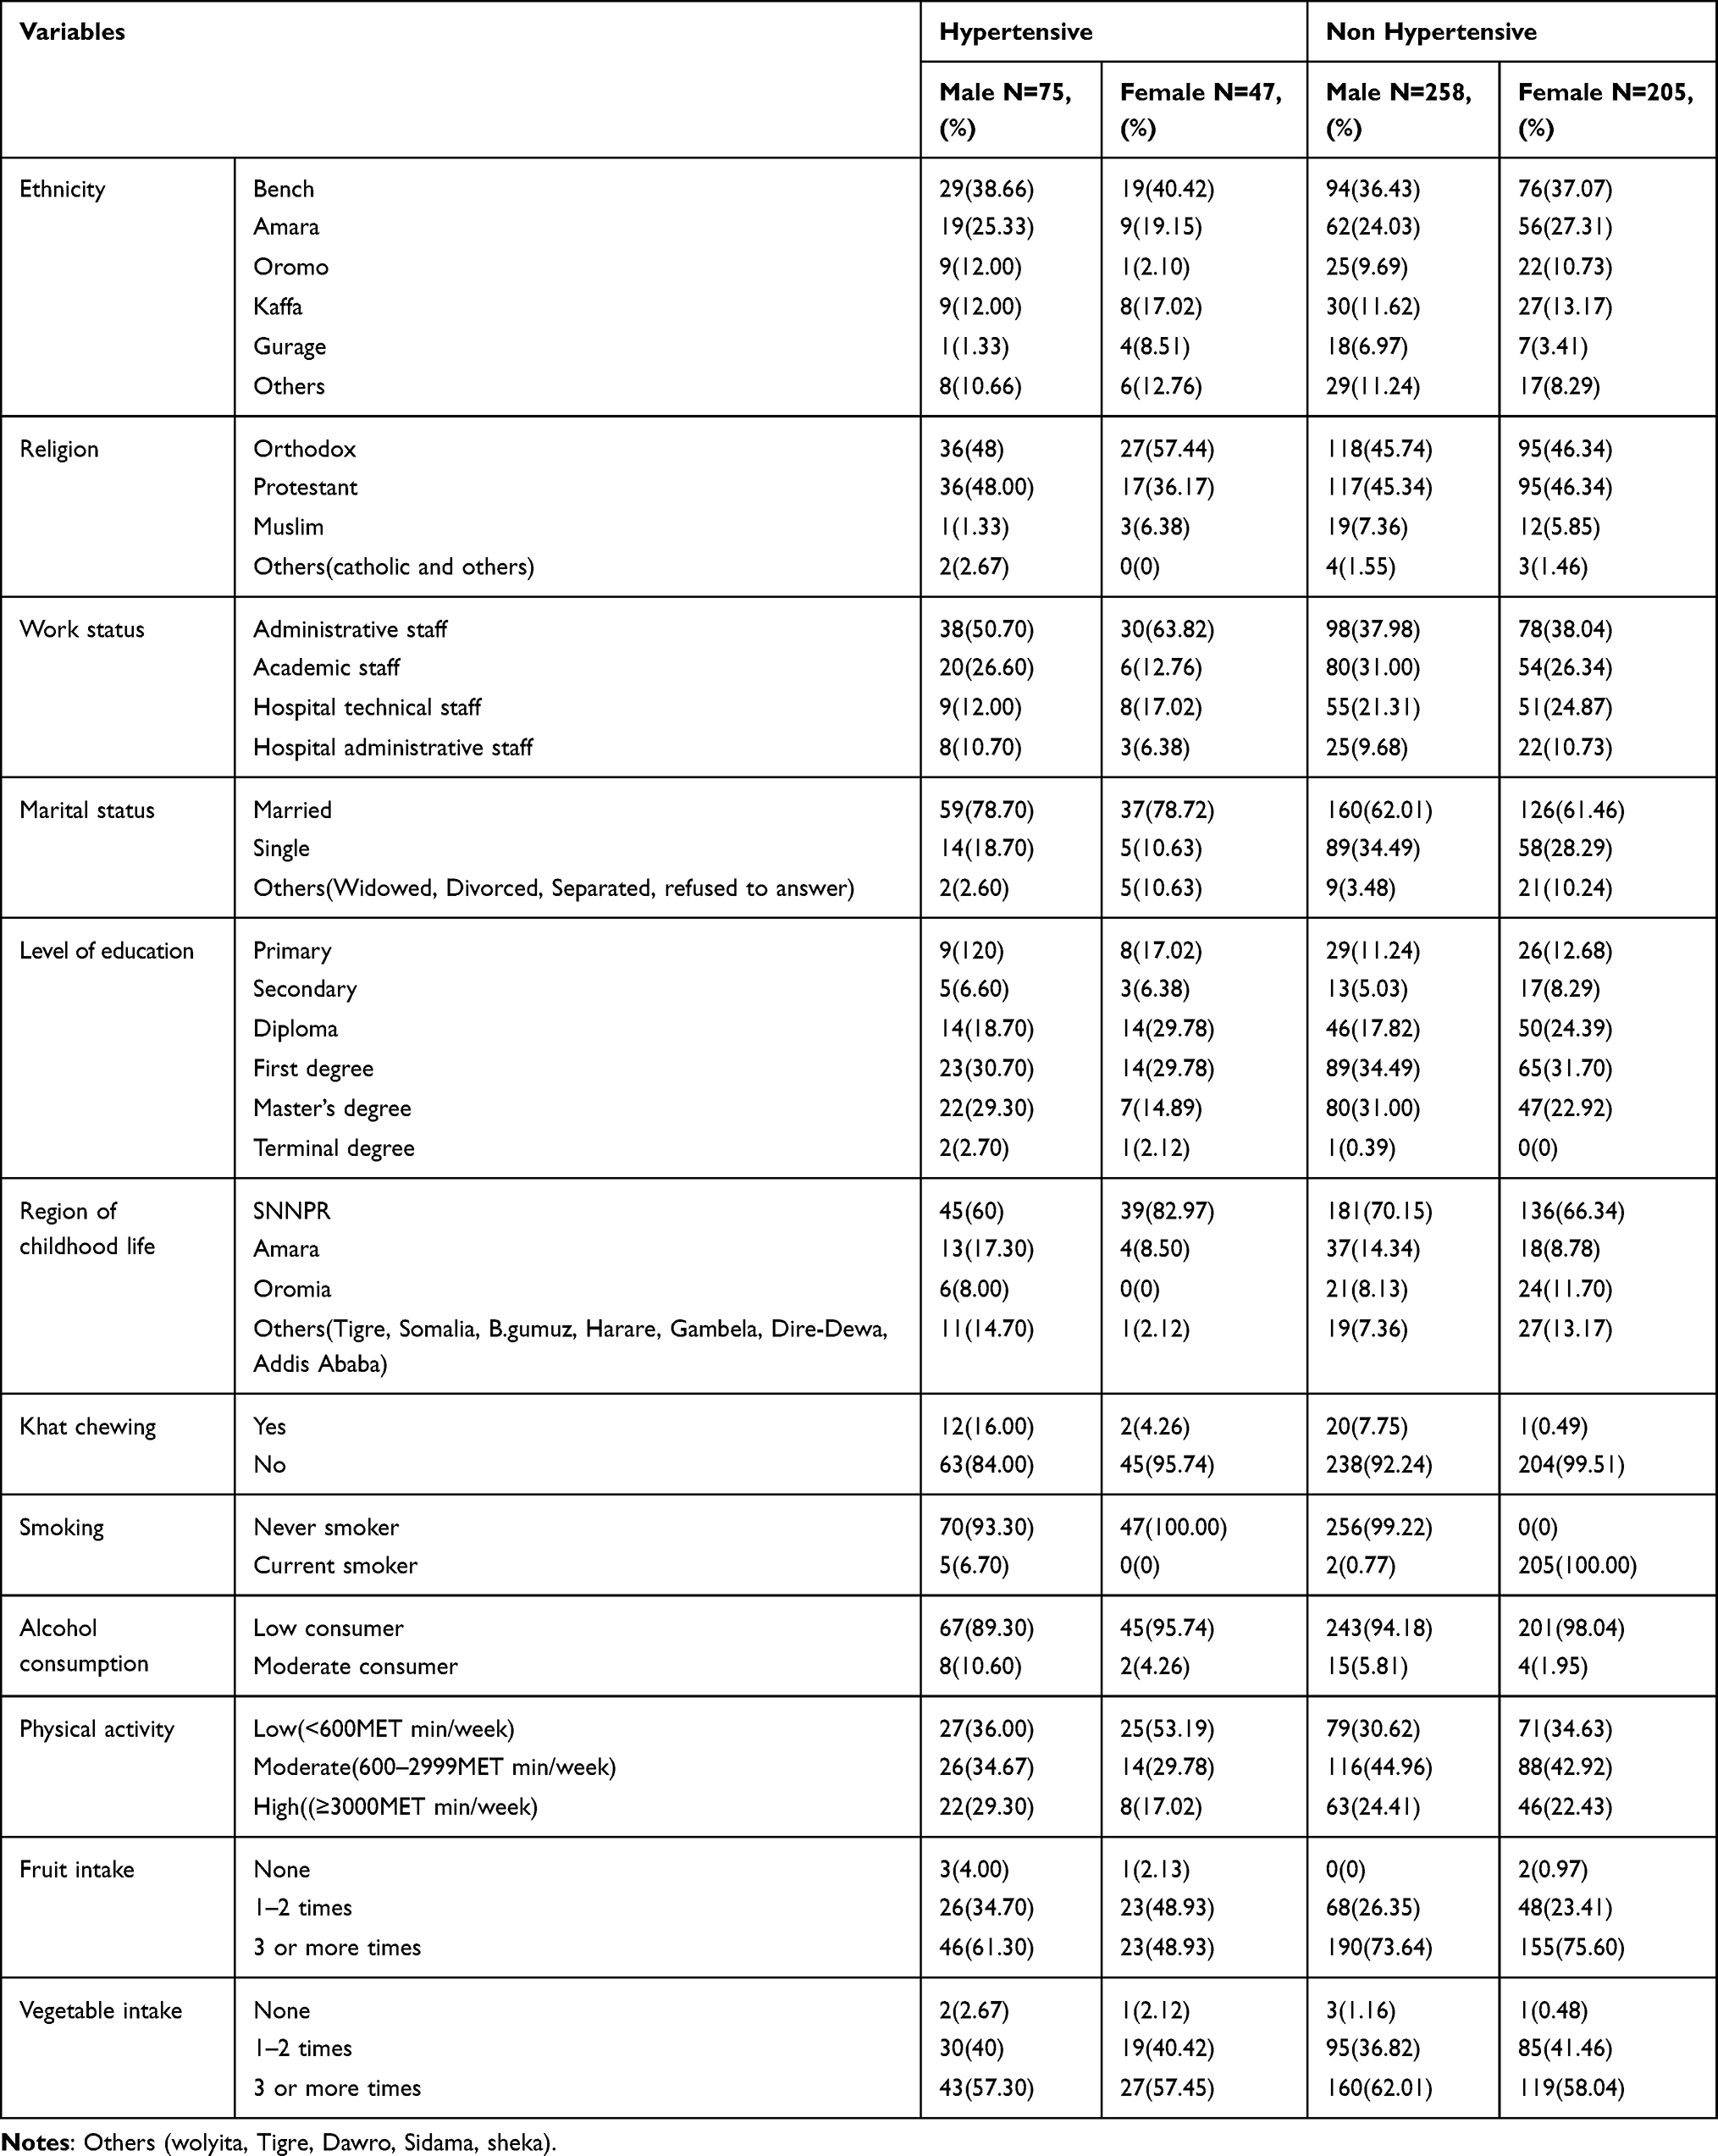 |
Table 1 Socio-Demographic and Lifestyle Characteristics for Evaluation of Anthropometric Indices for Screening Hypertension Among Mizan Tepi University Employees Southwest of Ethiopia, 2020 |
The mean (SD) values of blood pressure and anthropometric measurements in female and male participants among the hypertensives and non-hypertensive are described in Table 2. Among the hypertensive employees, male participants were found to have higher SBP, DBP, height, and weight, WHR, HC, and WC than females. But females had higher BMI and WHtR than males. Among the non-hypertensive employees, male and female participants were found to have approximately equal mean for SBP, DBP, WC, and BMI. Females were found to have higher HC and WHtR than males. Male employees had higher height, weight and WHR than females.
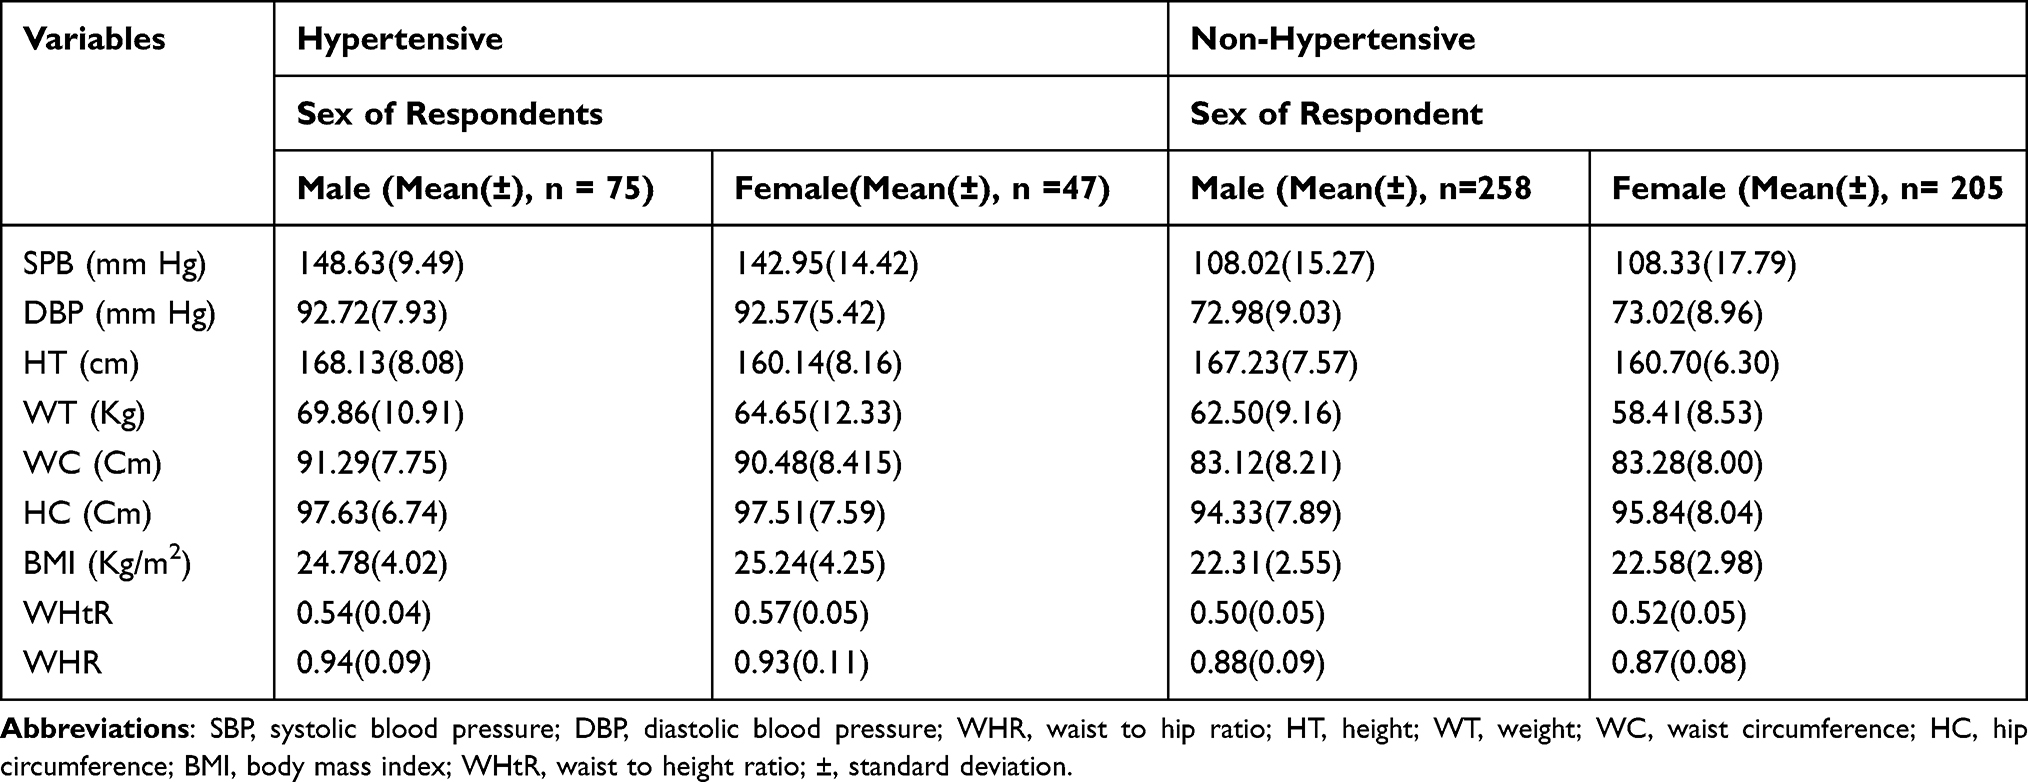 |
Table 2 The Mean and Standard Deviations of Blood Pressure and Anthropometric Measurements for Evaluation of Anthropometric Indices for Screening Hypertension Among Mizan Tepi University Employees, Southwest of Ethiopia, 2020 |
Prevalence of Hypertension and Obesity Indices
The overall prevalence of hypertension was 20.9%, which was 22.5% in males and 18.7% in females. According to BMI, 16.8% of male participants were overweight and 4.2% were obese. On the other hand, 19.8% of female participants were overweight and 5.6% were obese. As presented in Figures 1 and 2, it was found that 69% of females and 19.5% of males had increased WC. About 63.5% of females and 42% of males had substantially increased WHR; on the other hand, WHtR was increased in 51.1% and 67.5% of male and female participants, respectively.
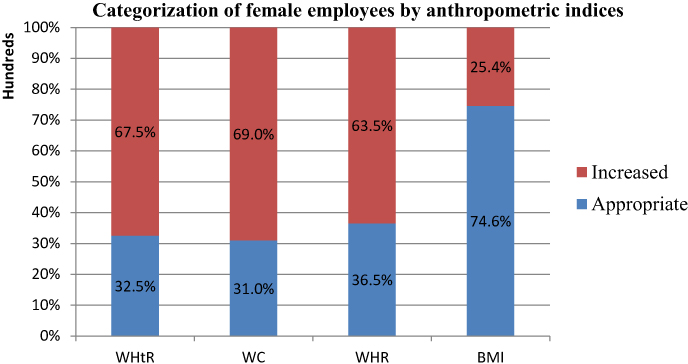 |
Figure 1 Categorization of female employees by appropriate for waist to height ratio <0.5 and increased WHtR≥0.5, appropriate for waist circumference <80 and increased for WC≥80, appropriate for waist to hip WHR<0.85 and increased for WHR≥0.85 and for body mass index, appropriate for body mass index <25 and increased for BMI≥25. |
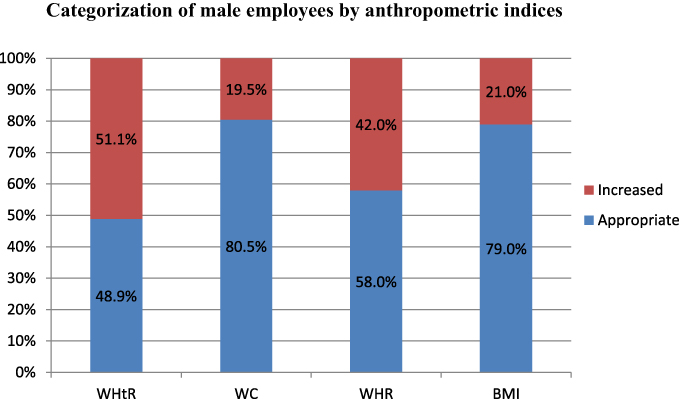 |
Figure 2 Categorization of male employees by appropriate for waist to height ratio <0.5 and increased ≥0.5, appropriate for waist circumference <94 and increased WC≥94, appropriate for waist to hip WHR<9 and substantially increased WHR≥0.9 and for normal weight body mass index <25 and for overweight or obese body mass index ≥25. |
Association Between Anthropometric Indices and Hypertension
Multivariable Logistic regression analysis was employed to see the association between anthropometric indices and hypertension by controlling the possible confounders like age, smoking status, khat chewing, coffee drinking, alcohol intake, physical activity, and main work status (Table 3). The effect of multicollinearity was checked by a variance inflation factor (VIF<10) and model fitness was checked by Hosmer and Lemeshow test. After adjusting for confounders, WHtR, WHR, and BMI were found to be significantly associated with hypertension among males at p-value <0.05, whereas, among females, only BMI was found to be significantly associated with hypertension at p-value <0.05.
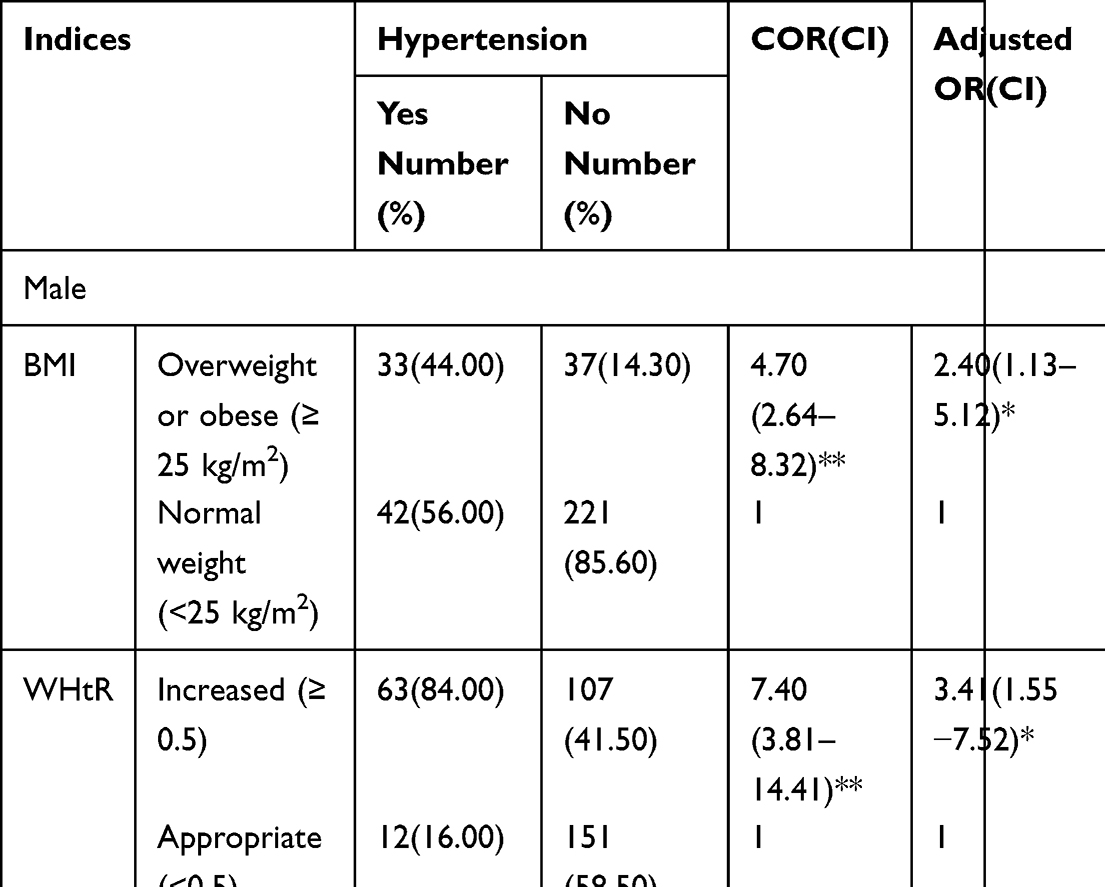 |
Table 3 Bivariate and Multivariable Logistic Regression Model for Evaluation of Anthropometric Indices for Screening of Hypertension Among Employees of Mizan Tepi University, 2020 |
Among men, WHtR was found to be the strongest predictor of hypertension than BMI and WC, those males who had increased WHtR were 3.4 times (AOR=3.41: 95% CI: 1.55–7.52, P-value<0.002) more likely to be hypertensive than those with appropriate WHtR. Regarding WHR, the odd of males with substantially increased WHR to be hypertensive is 3.2 times that of those with appropriate WHR. However, both WHtR and WHR were not found to be statistically significant predictors of hypertension among females.
Our result indicated that BMI was a statistically significant predictor of hypertension in both sexes. Those males who were overweight or obese had 2.4 times (AOR=2.4, 95% CI: 1.13–5.12, P-value<0.023) higher chance to be hypertensive than those who had normal weight, whereas overweight or obese females were 2.9times (AOR=2.89, 95% CI: 1.25–6.62, P-value<0.013) more likely to be hypertensive than those with normal weight. In both sexes, WC was not a statistically significant predictor of hypertension.
Receiver Operating Characteristics Curve Analysis for Anthropometric Indices as Screening Indices for Hypertension
The receiver operating characteristics curve (ROC) (Figures 3 and 4) showed that, except for BMI, all anthropometric indices had better performance to screen hypertension among males than females. Table 4 shows an area under the curve (AUC), Youden index (YI), sensitivity, specificity, positive and negative predictive values for both male and female participants. Among males, WHtR showed highest discriminatory ability for hypertension having fair accuracy (AUC=0.769; 95% CI 0.711–0.827, p <0.001), followed by WC (AUC=0.767; 95% CI, 0.709–0.825, P<0.001) and WHR (AUC=0.696; CI, 0.626–0.766, P<0.001), while BMI showed the lowest screening ability with poor accuracy (AUC= 0.676; CI, 0.601–0.752, P<0.001).
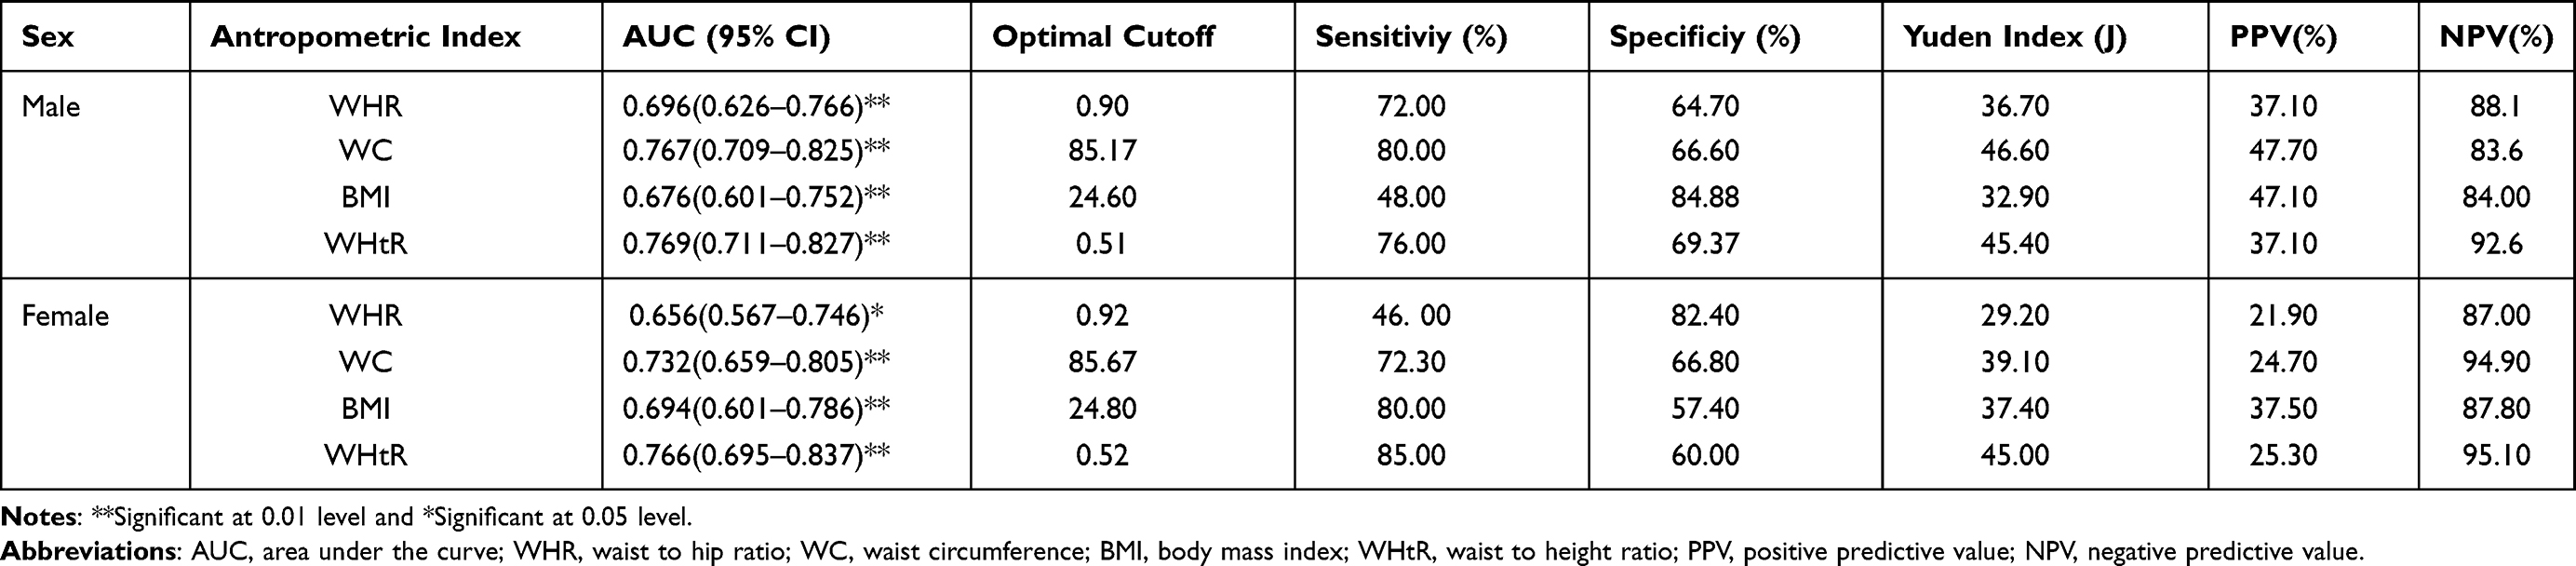 |
Table 4 Area Under Curve (AUC), Sensitivity, Specificity, and Youden Index, Positive and Negative Predictive Values for Evaluation of Anthropometric Indices for Screening Hypertension Among Employees of Mizan Tepi University 2020 |
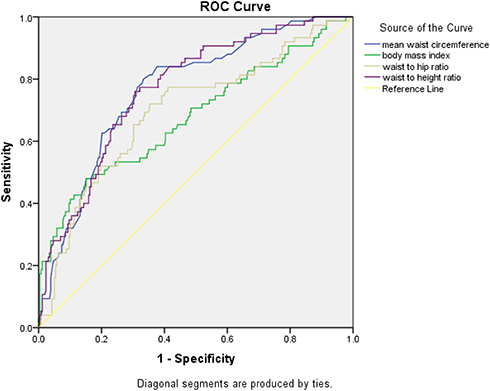 |
Figure 3 ROC curve for evaluation of anthropometric indices for screening hypertension for male employees of Mizan Tepi University, 2020. |
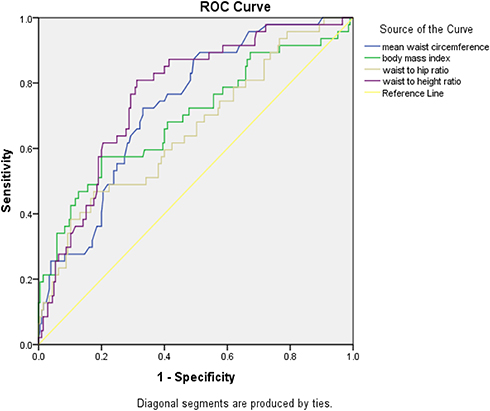 |
Figure 4 ROC curve for evaluation of anthropometric indices for screening of hypertension among female employees of Mizan Tepi University, 2020. |
Among females, WHtR showed the best discriminatory ability for hypertension with fair accuracy (AUC=0.766; CI, 0.695–0.837, p<0.001), followed by WC, that also had fair accuracy (AUC=0.732; CI, 0.659–0.805, P<0.001) and BMI with poor accuracy (AUC=0.694; CI, 0.601–0.786, P<0.001). In females, WHR showed the least screening ability for hypertension with poor accuracy (AUC=656; CI, 0.567–0.746, P<0.001).
The optimal cutoff value for screening hypertension was developed for males and females with maximum Youden index. The optimal cutoff points were developed for WHR (0.90 for male and 0.92 for female), WC (85.17cm for male and 85.67cm for female), BMI (24.6kg/m2 for male 24.8kg/m2 for female) and WHtR (0.51 for males and 0.52 for female) (Table 4).
Discussion
The study evaluated the utility of anthropometric indices including WC, BMI, WHR, and WHtR for screening hypertension among Mizan Tepi University employees. Meanwhile, we also determined the prevalence of hypertension and the association between anthropometric indices and hypertension. The overall prevalence of hypertension was 20.9%, which was 22.5% in males and 18.7% in females.
In our result, among male participants, WHtR, WHR, and BMI were found to be statistically significant predictors of hypertension. WHtR was a better predictor of hypertension, those male participants who had increased WHtR (≥0.5) were 3.4 times more likely to be hypertensive than those with appropriate WHtR (<0.5). This finding is in agreement with a cross-sectional study conducted in Malaysia.15 This could be due to the fact that this extra accumulation of fat leads to a decreased level of high-density lipoprotein and an increased level of low-density lipoprotein and triglyceride43 and the increased level of low-density lipoprotein is a risk factor for hypertension.44
In the current study, those males with substantially increased WHR (≥0.9) were 3.2 times more likely to be hypertensive than those with appropriate WHR (<0.9). However, WHR was not found to be a significant predictor of hypertension in females, this could be due to males tend to accumulate fat centrally more than females.45 In our study, males had a higher mean WHR than females.
Our study showed that BMI was a statistically significant predictor of hypertension in both sexes. Those males and females who were overweight or obese had 2.4 times and 2.9 times higher odds of being hypertensive than those who were normal weight, respectively. A similar finding was obtained from a study conducted in Iran.24 This could be due to the fact that an increased level of BMI is indicative of accumulation of fat tissue, which is a risk factor for hypertension.46
Our study found that, according to ROC analysis, abdominal obesity indices including WHtR, WC, and WHR showed better screening ability for hypertension than BMI. This is because fat accumulated around our abdomen increases the hemodynamic changes that occur due to obesity. Visceral fat predisposes to higher health risks than subcutaneous fat due to its vascular anatomical and metabolic activity. Visceral fat drained directly by the portal vein, therefore free fatty acid will get direct access to the liver. Abdominal fat cells have active biological metabolism and a higher affinity for releasing a larger quantity of pro-inflammatory adipokines and free fatty acid. The entrance of free fatty acids to the liver results in reduced extraction of insulin by the liver, which leads to systematic hyperinsulinemia and inhibition of suppression of glucose production by insulin. This condition will exacerbate insulin resistance, dysregulation of hepatic metabolism, and finally, leading to cardiovascular disease. Additionally, intra-abdominal fat is highly linked to a low level of high-density lipoprotein and a high level of hepatic glyceride lipase.31,47
The waist-to-height ratio had the highest discriminatory ability for screening hypertension in both sexes than the other indices in the study. This finding was in line with cross-sectional studies conducted in Saudi Arabia, China, Brazil, and Jimma.25,35,48,49 The possible reason for WHtR to be a better tool for screening hypertension could be due to its consideration of both height and WC of an individual. The height could affect the fat distribution; resulting in short people having a higher chance of accumulating fat centrally, and they also have a higher level of blood cholesterol and SBP than tall people.50 This is supported by a cross-sectional study that reported the inverse relationship between cardiovascular risk factors and height.51
The waist-to-height ratio is a sensitive and inexpensive index, which was found to be best correlated with fat mass than other obesity indexes.52 In addition, waist and height are measured simply by using only tape meters; self-assessment is easy and easily calculated than BMI. It also identifies health risks early; predicts cardio metabolic risk factors, illness, and death better than other obesity indexes. Similar cutoff points were suggested for males and females, different ethnic groups, and age ranges.19,34,53,54
In contrast to our finding, some cross-sectional studies revealed that WHtR is not a better predictor of hypertension than other obesity indices. For example, a cross-sectional study done among Japanese males stated that WHtR is not better screening index by itself, it is only because it is highly correlated with WC.55 Another cross-sectional study conducted among Filipino participants reported that BMI, WC, and WHtR had comparable ability to screen hypertension.56 This discrepancy could be due to the difference in sex and age of participants and method of statistical analysis. For example, a study in Japan only conducted Pearson correlation coefficient, unlike our study, which conducted ROC curve analysis. The mean age of Filipino participants was higher (53±7) than our participants (32.3±6.6). BMI and WC were reported to be notable indicators of hypertension risk in middle age groups.57
Our finding revealed that WC and WHR were significant discriminators of hypertension having fair accuracy in both males and females. A similar finding was obtained in a study conducted in Malaysia.15 However, evidence suggests that WC has shortcomings due to its collinearity with BMI and weight; the limited ability to predict mortality and morbidity.58 Unlike WHtR, WC does not account for the height of an individual during risk assessment. Individuals with the same WC but different height may not have a similar quantity of fat and risk for cardio metabolic disease including hypertension.59
The finding of the present study suggests that, for both males and females, BMI had lower and poor discriminatory ability for screening hypertension than central obesity indexes. This result agreed with cross-sectional studies conducted in Brazil, Saudi Arabia and Korea.29,48,60 The decreased power of BMI to screen hypertension could be due to its incapability to differentiate fat mass and muscle mass which might lead to under screening of health risks.21 This is supported by a result from the Britain study, which indicated that more than one in 7 normal weight males and more than one in 3 normal weight females could be at increased health risk according to their abdominal fat distribution.30
It was explained that utilizing only weight and height to screen health risk without considering fat distribution is becoming outmoded since health risk is associated with central fat distribution.42 In addition, BMI was found to be a poor predictor of health risk and death.54 BMI is an insensitive index to give response to lifestyle change than other obesity indices; a person may be losing weight and gaining muscle while doing physical activity. This may lead to decreased abdominal obesity but will show little change or no change in BMI.61
In the present study, the optimal cutoff points were developed for WHtR, WHR, WC and BMI based on Youden index. The cutoff points developed for WHtR to screen hypertension were 0.51 for males and 0.52 for females. This finding was consistent with cross-sectional studies done in Singapore, Korea, China, Brazil and Jimma.18,25,29,35,60 The study in China suggested that having a similar cutoff point to screen hypertension indicates WHtR offset gender difference that occurs due to steroids that control both weight and height. This small difference of WHtR cutoff point in different settings made it more likely to be utilized widely.
The waist-to-height ratio having a cutoff value of 0.5 was suggested as a proxy to screen hypertension to be utilized by all ethnic groups worldwide. This will be helpful to nations with poor resource settings for the prevention and early detection of hypertension. This simple cutoff value will be an input for a national strategy to prevent NCD by giving simple behavioral change in communication. There is also a possibility of transferring one message from childhood to adulthood which says “Keep your waist circumference to less than half your height”.34
The optimal cutoff point for WC was developed to screen hypertension for male (85.17cm) and female participants (85.67cm). This cutoff point was consistent with a study conducted in Singapore18 but was lower than a study conducted in Jimma and the international cutoff points.25,62 Cross-sectional studies done in Malaysia, Canada and Korea had higher WC cutoff values than our study.15,26,60
The optimal cutoff point developed for WHR to screen hypertension was 0.90 in males and 0.92 in females. This cutoff point was higher than the cross-sectional study conducted in Jimma (0.86 for males and 0.89 for females),25 while was lower than the cutoff value from a study conducted in Brazil.29
The optimal cutoff point for BMI to screen hypertension was developed for both males (24.6Kg/m2) and females (24.8kg/m2). A similar finding was seen from a cross-sectional study done in Korea60 and Jimma.25 But the BMI cutoff point developed in our study was lower than the cutoff point obtained in the Singapore study.18 The possible reason for these differences could be due to racial differences. It was stated that there is an underestimation of obesity in Ethiopians while utilizing the Caucasians cutoff point.63
The finding of this study has implications in developing countries like Ethiopia since there is urbanization-related lifestyle change, which may lead to the nutritional and demographic transition. This condition is responsible for the unexpected rise in the prevalence of NCD like hypertension, diabetes mellitus, and cardiovascular disease, which results in the country facing a double burden of disease, from both communicable and non-communicable diseases.16 So the finding of our study may be used as an input for future programs that aim for the prevention of NCD like hypertension. The following limitations are forwarded for future researchers to address them. Due to the cross-sectional nature of the study, we were not able to evaluate the cause–effect relationship between the obesity indices and hypertension. This cross-sectional nature of our study unables us to establish the temporal relationship between the anthropometric indices and hypertension. The other limitation is measurement error. We tried to reduce the measurement error by doing a standardization exercise but still, measurement error could be there.
Conclusion
The prevalence of hypertension is high in the study area. The waist-to-height ratio was found to have better screening ability for hypertension than other obesity indices among Mizan Tepi University employees. The developed optimal cutoff point for WHtR was 0.51 for males and 0.52 for females. This implies that WHtR can be utilized to screen hypertension in resource-limited settings like Ethiopia.
Abbreviations
AOR, adjusted odds ratio; AUC, area under curve; BMI, body mass index; COR, crude odds ratio; DBP, diastolic blood pressure; HC, hip circumference; mmHg, millimeter mercury; NCD, non communicable disease; ROC, receiver operating characteristics curve; SBP, systolic blood pressure; SD, standard deviation; WC, waist circumference; WHO, World Health Organization; WHR, waist to hip ratio; WHtR, waist to height ratio.
Data Sharing Statement
The data used for this study are available and can be shared from corresponding author on reasonable request.
Acknowledgments
First of all, I would like to thank Jimma University; Institute of Health Science, Department of Nutrition and Dietetics, for giving a chance to conduct this research. I would like to express my deepest gratitude to Mizan Tepi University for allowing me to conduct this research on the university and for providing me all the necessary equipment for data collection. Finally, my thanks goes to my study participants, Mizan Tepi university employees for voluntarily participating in this research work.
Author Contributions
All of the three authors contributed to study conception, data analysis, drafting or revising the article, have agreed on the journal to which the article will be submitted, gave final approval of the version to be published, and agreed to be accountable for all aspects of the work.
Funding
The authors received no financial support for the research for the article.
Disclosure
The authors declare that they have no conflicts of interest for this work.
References
1. Foëx P, Sear J. Hypertension: pathophysiology and treatment. Cont Educ Anaesth Crit Care Pain. 2004;4(3):71–75. doi:10.1093/bjaceaccp/mkh020
2. World Health Organization. Hypertension fact sheets WHO 2019.
3. World Health Organization. Obesity and overweight. 2021.
4. Ataklte F, Erqou S, Kaptoge S, et al. Burden of undiagnosed hypertension in Sub-Saharan Africa a systematic review and meta-analysis. Hypertension. 2015;65:291–298.
5. Kibret KT, Mesfin YM. Prevalence of hypertension in Ethiopia: a systematic meta-analysis. Public Health Rev. 2015;36(1):1–12. doi:10.1186/s40985-015-0014-z
6. Misganaw A, Mariam DH, Araya T. The double mortality burden among adults in Addis Ababa, Ethiopia, 2006–2009. Prev Chronic Dis. 2012;9:E84.doi:10.5888/pcd9.110142
7. Misganaw A, Mariam D, Ali A, et al. Epidemiology of major non-communicable diseases in Ethiopia: a systematic review. J Health Popul Nutr. 2014;32(1):1–13.
8. Janakiraman B, Abebe SM, Chala MB, et al. Epidemiology of general, central obesity and associated cardio-metabolic risks among university employees, Ethiopia: a cross-sectional study. Diabetes Metab Syndr Obes. 2020;13:343–353. doi:10.2147/DMSO.S235981
9. Anteneh Z, Yalew W, Abitew D. Prevalence and correlation of hypertension among adult population in Bahir Dar city, northwest Ethiopia: a community based cross-sectional study. Int J Gen Med. 2015;8:175–185. doi:10.2147/IJGM.S81513
10. Kiber M, Wube M, Temesgen H, et al. Prevalence of hypertension and its associated factors among adults in Debre Markos Town, Northwest Ethiopia: community based cross‑sectional study. BMC Res Notes. 2019;12:1–6. doi:10.1186/s13104-019-4431-9
11. Bekele GE, Tadesse T, Negaw R, et al. Magnitude and associated factors of hypertension in Addis Ababa public health facilities, Ethiopia. MOJ Public Health. 2018;7(6):280–286. doi:10.15406/mojph.2018.07.00252
12. Hassen B, Mamo H. Prevalence and associated anthropometric and lifestyle predictors of hypertension among adults in Kombolcha town and suburbs, Northeast Ethiopia: a community based cross-sectional study. BMC Cardiovasc Disord. 2019;19:1–10. doi:10.1186/s12872-019-1225-x
13. Zekewos A, Egeno T, Loha E. The magnitude of hypertension and its risk factors in southern Ethiopia: a community based study. PLoS One. 2019;14(8):e0221726. doi:10.1371/journal.pone.0221726
14. Edris MM, Shikur A, Sintayew S, Mara AM. Magnitude of hypertension among adult residents in Mizan-Aman Town, Bench Maji zone, Southwest Ethiopia – a descriptive cross-sectional study. MOJ Curr Res Rev. 2018;1(4).
15. Chua E, Zalilah M, Haemamalar K, et al. Obesity indices predict hypertension among indigenous adults in Krau Wildlife Reserve, Peninsular Malaysia. J Health Popul Nutr. 2017;36(24). doi:10.1186/s41043-017-0102-4
16. Vijver S, Akinyi H, Oti S, et al. Status report on hypertension in Africa - consultative review for the 6th session of the African Union Conference of Ministers of Health on NCD’s. Pan African Med J. 2013;16:Article 38. doi:10.11604/pamj.2013.16.38.3100
17. Khadaee H, Saeidi M. Increases of obesity and overweight in children: an alarm for parents and policymakers. Int J Pediatr. 2016;4(4):1591–1601.
18. Lam B, Koh G, Chen C, et al. Comparison of body mass index (BMI), body adiposity index (BAI), waist circumference (WC), waist-to-hip ratio (WHR) and waist- to-height ratio (WHtR) as predictors of cardiovascular disease risk factors in an adult population in Singapore. PLoS One. 2015;10:e0122985. doi:10.1371/journal.pone.0122985
19. Kim HS. Simple universal cutoff point of waist-height ratio for metabolic risk in Korean children and adolescents. Korean J Pediatr. 2019;62(7):257–258. doi:10.3345/kjp.2019.00045
20. Li N, Yang T, Yu WQ, Liu H. Is waist-to-height ratio superior to body mass index and waist circumference in predicting the incidence of hypertension? Ann Nutr Metab. 2019;74(3):215–223. doi:10.1159/000499073
21. Buss J. Limitations of body mass index to assess body fat. Workplace Health Safety. 2014;62:264.
22. Corral AR, Somers VK, Johnson J, et al. Accuracy of body mass index in diagnosing obesity in the adult general population. Int J Obes. 2008;32(6):959–966. doi:10.1038/ijo.2008.11
23. Nyangasa MA, Buck C, Kelm S, Sheikh MA, Brackmann KL, Hebestreit A. Association between cardiometabolic risk factors and body mass index, waist circumferences and body fat in a Zanzibari cross-sectional study. BMJ Open. 2019;9(7):e025397. doi:10.1136/bmjopen-2018-025397
24. Esmaillzadeh A, Mirmiran P, Azizi F, et al. Comparative evaluation of anthropometric measures to predict cardiovascular risk factors in Tehranian adult women. Public Health Nutr. 2005;9(1):61–69. doi:10.1079/PHN2005833
25. Sinaga M, Worku M, Yemane T, et al. Optimal cut-off for obesity and markers of metabolic syndrome for Ethiopian adults. Nutr J. 2018;17:1–12. doi:10.1186/s12937-018-0416-0
26. Dobbelsteyn C, Joffres M, MacLean D, et al. A comparative evaluation of waist circumference, waist-to-hip ratio and body mass index as indicators of cardiovascular risk factors. The Canadian Heart Health Surveys. Int J Obes. 2001;25:652–661.
27. Wai WS, Dhami RS, Gelaye B, et al. Comparison of measures of adiposity in identifying cardiovascular disease risk among Ethiopian adults. Obesity. 2012;20:1887–1895. doi:10.1038/oby.2011.103
28. Hwaung P, Heo M, Kennedy S, et al. Optimum waist circumference‐height indices for evaluating adult adiposity: an analytic review. Obes Rev. 2020;21:e12947. doi:10.1111/obr.12947
29. Dutra M, Reis D, Martins K, et al. Comparative evaluation of adiposity indices as predictors of hypertension among Brazilian adults. Int J Hypertens. 2018;2018. doi:10.1155/2018/8396570
30. Ashwell M, Gibson S. Waist to height ratio is a simple and effective obesity screening tool for cardiovascular risk factors: analysis of data from the British national diet and nutrition survey of adults aged 19–64 years. Obes Facts. 2009;2:97–103. doi:10.1159/000203363
31. Despres J, Moorjani S, Lupien P, et al. Regional distribution of body fat, plasma lipoproteins, and cardiovascular disease. Arteriosclerosis. 1990;10(4):497–511. doi:10.1161/01.atv.10.4.497
32. Deng G, Yin L, Liu W, et al. Associations of anthropometric adiposity indexes with hypertension risk: a systematic review and meta-analysis including PURE-China. Medicine. 2018;97(48):e13262. doi:10.1097/MD.0000000000013262
33. Ashwell M, Gunn P, Gibson S, et al. Waist-to-height ratio is a better screening tool than waist circumference and BMI for adult cardiometabolic risk factors: systematic review and meta-analysis. Obes Rev. 2012;13:275–286. doi:10.1111/j.1467-789X.2011.00952.x
34. Ashwell M, Gibson S. A proposal for a primary screening tool: ‘Keep your waist circumference to less than half your height’. BMC Med. 2014;12(1). doi:10.1186/s12916-014-0207-1
35. Yang H, Xin Z, Feng J, Yang JK. Waist-to-height ratio is better than body mass index and waist circumference as a screening criterion for metabolic syndrome in Han Chinese adults. Medicine (Baltimore). 2017;96(39):e8192. doi:10.1097/MD.0000000000008192
36. Ashwell M, Hsieh D. Six reasons why the waist-to-height ratio is a rapid and effective global indicator for health risks of obesity and how its use could simplify the international public health message on obesity. Int J Food Sci Nutr. 2005;56(5):303–307. doi:10.1080/09637480500195066
37. Ashwell M, Mayhew L, Richardson J, et al. Waist-to-height ratio is more predictive of years of life lost than body mass index. PLoS One. 2014;9(9):e103483. doi:10.1371/journal.pone.0103483
38. Zaidi M, Ansari MA, Waseem H, et al. Sample size estimation of diagnostic test studies in health sciences.
39. World Health Organization. WHO STEPS instrument question-by-question guide: theWHO STEPwise approach to chronic disease risk factor surveillance (STEPS). Geneva, Switzerland: WHO; 2009.
40. Cashin K, Oot L. Guide to anthropometry a practical tool for program planners, managers, and implementers. 2018.
41. World Health Organization. Waist circumference and waist-hip ratio report of a WHO expert consultation. Geneva; 2008.
42. National Institutes of Health National Heart L, and Blood Institute. The four report on the diagnosis, evaluation, and treatment of high blood pressure in children and adolescents. 2005.
43. Ebbert J, Jensen M. Fat depots, free fatty acids, and dyslipidemia. Nutrients. 2013;5:498–508. doi:10.3390/nu5020498
44. Simone D, Devereux R, Chinali M, et al. Risk factors for arterial hypertension in adults with initial optimal blood pressure the strong heart study. Hypertension. 2006;47:162–167. doi:10.1161/01.HYP.0000199103.40105.b5
45. Ouliot MC, Després J-P, Lemieux S, et al. Waist circumference and abdominal sagittal diameter: best simple anthropometric indexes of abdominal visceral adipose tissue accumulation and related cardiovascular risk in men and women. Am J Cardiol. 1994;73:460–468. doi:10.1016/0002-9149(94)90676-9
46. Shihab H, Meoni L, Chu AY, et al. Body mass index and risk of incident hypertension over the life course the Johns Hopkins precursors study. Circulation. 2012;126:2983–2989. doi:10.1161/CIRCULATIONAHA.112.117333
47. Menke A, Muntner P, Wildman RP, et al. Measures of adiposity and cardiovascular disease risk factors. OBESITY. 2007;15(3):785–795. doi:10.1038/oby.2007.593
48. Alzeidan R, Fayed A, Rabiee F, et al. Diagnostic performance of waist-to-height ratio in identifying cardiovascular risk factors and metabolic syndrome among adult Saudis. Saudi Med J. 2020;41(3):253–260. doi:10.15537/smj.2020.3.24915
49. Caminha TC, Ferreira HS, Costa NS, et al. Waist-to-height ratio is the best anthropometric predictor of hypertension: a population-based study with women from a state of northeast of Brazil. Medicine. 2017;96(2):e5874. doi:10.1097/MD.0000000000005874
50. Stefan N, Häring HU, Bh F, et al. Divergent associations of height with cardiometabolic disease and cancer: epidemiology, pathophysiology, and global implications. Lancet Diabetes Endocrinol. 2016;4(5):457–467. doi:10.1016/S2213-8587(15)00474-X
51. Nelson CP, Hamby SE, Saleheen D, et al. Genetically determined height and coronary artery disease. N Engl J Med. 2015;372(17):1608–1618. doi:10.1056/NEJMoa1404881
52. Larky D, Daneghian S, Alipour M, et al. Waist circumference to height ratio: better correlation with fat mass than other anthropometric indices during dietary weight loss in different rates. Int J Endocrinol Metab. 2018;16(4):e55023. doi:10.5812/ijem.55023
53. Yoo E. Waist-to-height ratio as a screening tool for obesity and cardiometabolic risk. Korean J Pediatr. 2016;59(11):425–431. doi:10.3345/kjp.2016.59.11.425
54. Schneider HJ, Friedrich N, Klotsche J, et al. The Predictive value of different measures of obesity for incident cardiovascular events and mortality. J Clin Endocrinol Metab. 2010;95(4):1777–1785. doi:10.1210/jc.2009-1584
55. Kawada T. Waist-height ratio, indicator of central obesity, is strongly related to waist circumference but there is poor additional information regarding waist circumference. Circ J. 2010;74(11):2501. doi:10.1253/circj.CJ-10-0583
56. Battie CA, Borja-Hart N, Ancheta IB, et al. Comparison of body mass index, waist circumference, and waist to height ratio in the prediction of hypertension and diabetes mellitus: Filipino-American women cardiovascular study. Prev Med Rep. 2016;4:608–613.
57. Wu X, Li B, Lin W-Q, et al. The association between obesity indices and hypertension: which index is the most notable indicator of hypertension in different age groups stratified by sex? Clin Exp Hypertens. 2019;41:373–380.
58. Chung W, Park C, Ryu OH. Association of a new measure of obesity with hypertension and health-related quality of life. PLoS One. 2016;11(5):e0155399.
59. Hsieh S, Yoshinaga H. Do people with similar waist circumference share the same risks irrespective of height? Tohoku J Exp Med. 1999;188:55–60. doi:10.1620/tjem.188.55
60. Park SH, Choi SJ, Lee KS, et al. Waist circumference and waist-to-height ratio as predictors of cardiovascular disease risk in Korean adults. Circ J. 2009;73:1643–1650. doi:10.1253/circj.CJ-09-0161
61. Despre´s JP, Lemieux I, Bergeron J, et al. Abdominal obesity and the metabolic syndrome: contribution to global cardiometabolic risk. Arterioscler Thromb Vasc Biol. 2007;27:2276–2283. doi:10.1161/ATVBAHA.107.147835
62. World Health Organization. Waist circumference and waist–hip ratio: report of a WHO expert consultation. Geneva; 2008:8–11.
63. Deurenberg P, Yap M, van Staveren WA. Body mass index and percent body fat: a meta analysis among different ethnic groups. Int J Obes Relat Metab Disord. 1998;22(12):1164–1171. doi:10.1038/sj.ijo.0800741
 © 2021 The Author(s). This work is published and licensed by Dove Medical Press Limited. The
full terms of this license are available at https://www.dovepress.com/terms
and incorporate the Creative Commons Attribution
- Non Commercial (unported, 3.0) License.
By accessing the work you hereby accept the Terms. Non-commercial uses of the work are permitted
without any further permission from Dove Medical Press Limited, provided the work is properly
attributed. For permission for commercial use of this work, please see paragraphs 4.2 and 5 of our Terms.
© 2021 The Author(s). This work is published and licensed by Dove Medical Press Limited. The
full terms of this license are available at https://www.dovepress.com/terms
and incorporate the Creative Commons Attribution
- Non Commercial (unported, 3.0) License.
By accessing the work you hereby accept the Terms. Non-commercial uses of the work are permitted
without any further permission from Dove Medical Press Limited, provided the work is properly
attributed. For permission for commercial use of this work, please see paragraphs 4.2 and 5 of our Terms.