Back to Journals » ClinicoEconomics and Outcomes Research » Volume 15
Evaluating the Clinical and Economic Outcomes Associated with Poor Glycemic Control in People with Type 1 Diabetes in the Netherlands
Authors Moes RGJ, Huisman EL, Malkin SJP, Hunt B ![]()
Received 11 October 2022
Accepted for publication 24 January 2023
Published 5 February 2023 Volume 2023:15 Pages 87—96
DOI https://doi.org/10.2147/CEOR.S391626
Checked for plagiarism Yes
Review by Single anonymous peer review
Peer reviewer comments 3
Editor who approved publication: Prof. Dr. Dean Smith
Robert Gerald Jan Moes,1 Eline L Huisman,1 Samuel JP Malkin,2 Barnaby Hunt2
1Novo Nordisk BV, Alphen aan den Rijn, Netherlands; 2Ossian Health Economics and Communications, Basel, Switzerland
Correspondence: Barnaby Hunt, Ossian Health Economics and Communications GmbH, Bäumleingasse 20, Basel, 4051, Switzerland, Tel +41 61 271 6214, Email [email protected]
Introduction: Achieving and maintaining glycemic control is the cornerstone of type 1 diabetes management, with the aim of reducing the incidence of diabetes-related complications over the long term. However, many individuals fail to reach glycemic targets. The present study evaluated the clinical and economic burden associated with poor glycemic control in people with type 1 diabetes in the Netherlands, and the improvements in outcomes that can be achieved by improving treatment.
Methods: Immediate glycemic control, defined as achieving a glycated hemoglobin (HbA1c) target of 7.0% at the start of the analysis, was compared with delays in achieving control of 1, 3 and 7 years, with outcomes projected using the IQVIA CORE Diabetes Model. Projections of life expectancy, quality-adjusted life expectancy, and direct and indirect costs (expressed in 2021 euros [EUR]) were made at a patient level and extrapolated to the population level.
Results: Improving HbA1c from 8.0% to 7.0% and 9.0% to 7.0% resulted in gains of up to 0.66 and 1.37 quality-adjusted life years (QALYs) per patient over a lifetime, respectively. At a population level, achieving immediate glycemic control was associated with gains of 9438, 27,171 and 72,717 QALYs and cost savings of up to EUR 224 million, EUR 556 million and EUR 1.3 billion compared with remaining in poor control for 1, 3 and 7 years, respectively.
Conclusion: The clinical and economic burden of poor glycemic control in people with type 1 diabetes in the Netherlands was projected to be substantial, but considerable gains in quality-adjusted life expectancy and cost savings could be achieved through early and effective treatment.
Keywords: diabetes complications, glycemic control, health economics, Netherlands, type 1 diabetes
Introduction
Type 1 diabetes mellitus is a chronic autoimmune condition characterized by insulin deficiency from the loss of pancreatic beta-cell function, and it requires lifelong treatment and management to reduce the risk of diabetes-related complications and associated premature mortality. The clinical and economic burden of type 1 diabetes is substantial, with a global prevalence of approximately 53.6 million people.1 In the Netherlands, an estimated 104,678 people were living with type 1 diabetes in 2020, while total expenditure relating to type 1 diabetes surpassed EUR 870 million in 2016.2,3 The majority of this expenditure was associated with direct costs of treating diabetes-related complications and indirect costs relating to lost workplace productivity and welfare coverage, which accounted for approximately 19% and 46% of total type 1 diabetes expenditure, respectively.3 Early and effective reduction of the incidence of diabetes-related complications, thereby reducing direct treatment costs, lost productivity and welfare payments, therefore represents the best strategy for minimizing diabetes-related burden on both individuals with the disease and healthcare systems that are coming under increasing budgetary strain worldwide.4
Ensuring consistent glycemic control with blood glucose levels under defined targets is crucial for reducing the incidence of complications over patient lifetimes, as shown by the landmark Diabetes Control and Complications Trial (DCCT) and the Epidemiology of Diabetes Interventions and Complications (EDIC) study, and this remains the key goal of treatment for people with type 1 diabetes.5–8 A glycemic control target of glycated hemoglobin (HbA1c) level of 7.0% is commonly used for individuals with type 1 diabetes, provided this can be achieved without resulting in a significant risk of hypoglycemic events.9,10 However, recent estimates indicate that a large proportion of individuals do not achieve this glycemic target internationally, with approximately 68% of people with type 1 diabetes with an HbA1c above 7.5%.11 Therefore, there is considerable scope for reducing the burden of type 1 diabetes by bringing people to glycemic targets that are within reach for many patients. Indeed, McKnight et al noted that natural life transitions in early adulthood, such as leaving the family home and starting a career, can have a negative impact on ongoing diabetes management.11 Improved education and monitoring of people with type 1 diabetes could therefore improve individual health outcomes while reducing the costs to society. Improvements in type 1 diabetes therapies, such as development of modern insulin preparations with lower rates of hypoglycemia, could also lead to improved outcomes and better glycemic control in individuals with type 1 diabetes who exhibit fear of hypoglycemic events, and consequent poor adherence to treatments.12–14
It is clear that there is scope for improvement in the treatment of patients with type 1 diabetes, but the clinical and economic burden of poor glycemic are currently unknown. Therefore, the aim of the present analysis was to evaluate the burden associated with poor glycemic control in people with type 1 diabetes in the Netherlands over both short- and long-term time horizons, and to estimate the potential gains in clinical and cost outcomes should glycemic control be achieved in this population.
Materials and Methods
Modeling Approach
The analysis used an equivalent modeling approach to that used previously to evaluate the burden of poor glycemic control associated with therapeutic inertia in patients with type 2 diabetes in the United Kingdom (UK) setting, by conducting a patient-level cost-utility analysis, with extrapolation to a population level.15 The impact of poor glycemic control in patients with type 1 diabetes in the Netherlands was evaluated by comparing immediate control (bringing HbA1c to 7.0%) with delays in achieving control of 1, 3 and 7 years (Figure 1) in patients with type 1 diabetes. In the delayed control scenarios, patients remained at HbA1c values of 8% or 9% for the applied time period, before achieving a glycemic control target of 7.0%. Outcomes were projected over time horizons of 10 years and individuals’ lifetimes using the IQVIA CORE Diabetes Model (version 9.0). The model is a non-product-specific, diabetes policy analysis tool, and the architecture, assumptions, features and capabilities have been previously published.16 The model is based on a series of inter-dependent sub-models that simulate non-specific mortality and the complications of diabetes (angina, myocardial infarction, congestive heart failure, stroke, peripheral vascular disease, diabetic retinopathy, macular edema, cataract, hypoglycemia, ketoacidosis, lactic acidosis, nephropathy and end-stage renal disease, neuropathy, foot ulcer and amputation). Each sub-model has a semi-Markov structure and uses time, state, time-in-state and diabetes type-dependent probabilities derived from published sources. Monte Carlo simulation using tracker variables overcomes the memory-less properties of the standard Markov model, and allows interconnectivity and interaction between individual complication sub-models. A detailed description of the model calculation engine and the structure of each sub-model has been previously published.16 The model has been validated against real-life data on original publication in 2004 and more recently in 2014.17,18 Model outcomes include cumulative incidence and time to onset of complications, life expectancy (expressed in years), quality-adjusted life expectancy (expressed in quality-adjusted life years [QALYs]), direct costs arising from treatment of diabetes-related complications and indirect costs arising from lost workplace productivity. All analyses were performed using a first-order Monte Carlo approach. The analyses captured mortality due to diabetes-related complications, and background mortality captured through use of Netherlands-specific life tables published by the World Health Organization.19 Projected clinical and cost outcomes were discounted at 1.5% and 4.0% per annum, respectively, in line with pharmacoeconomic guidance for the Dutch setting.20 Model inputs are described briefly below and provided in detail in the Appendix.
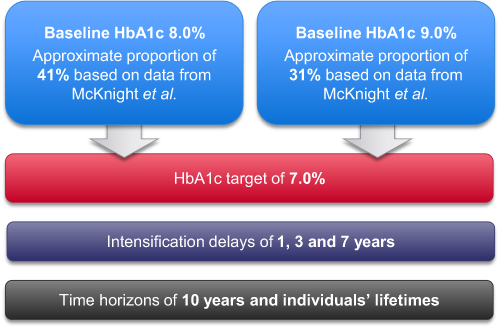 |
Figure 1 Overview of modeled scenarios. Abbreviation: HbA1c, glycated hemoglobin. |
Cohort Characteristics
A literature review was conducted to identify published cohorts with type 1 diabetes in the Netherlands. The aim was to identify a cohort representative of the population with type 1 diabetes in the Netherlands, capturing the inputs required for an analysis using the IQVIA CORE Diabetes Model. A total of 477 publications were screened by title and abstract, with 28 publications taken forward for full-text review. Baseline cohort characteristics were primarily based on a prospective cohort study published by van Dijk et al (n = 216), as this represented the study with the most comprehensive set of data, with other sources having significant data gaps, allowing modeling based on a homogenous set of cohort characteristics.21 Modeled patients were had a baseline mean age of 45.1 years, mean duration of diabetes of 22.1 years, mean systolic blood pressure of 130.4 mmHg, mean total cholesterol of 177.9 mg/dL, and mean body mass index (BMI) of 25.4 kg/m2 (Table 1). Where data were not reported in the publication by van Dijk et al, such as proportion smokers (19.0%), alcohol consumption (5.64 oz/week) and racial characteristics, Netherlands-specific sources were used.22–24 Where Netherlands-specific data could not be found, parameters were either set to IQVIA CORE Diabetes Model default values (hemoglobin, white blood cell count, heart rate, waist: hip ratio, urinary albumin excretion rate) or to zero (history of heart failure, atrial fibrillation, end-stage renal disease, proliferative diabetic retinopathy, severe vision loss, macular edema, cataract, ulcer, and amputation), to ensure these parameters did not drive outcomes. Baseline HbA1c was varied in the analyses, with values of 8.0% and 9.0% evaluated (the mean HbA1c reported by van Dijk et al was 7.6%, demonstrating that average HbA1c levels are above the target of 7.0% in the Netherlands). To ensure that only differences in glycemic control were driving outcomes, other physiological parameters, such as blood pressure, serum lipid levels and body mass index, were assumed to remain constant over the duration of the analyses, and did not vary depending on the baseline HbA1c value assessed.
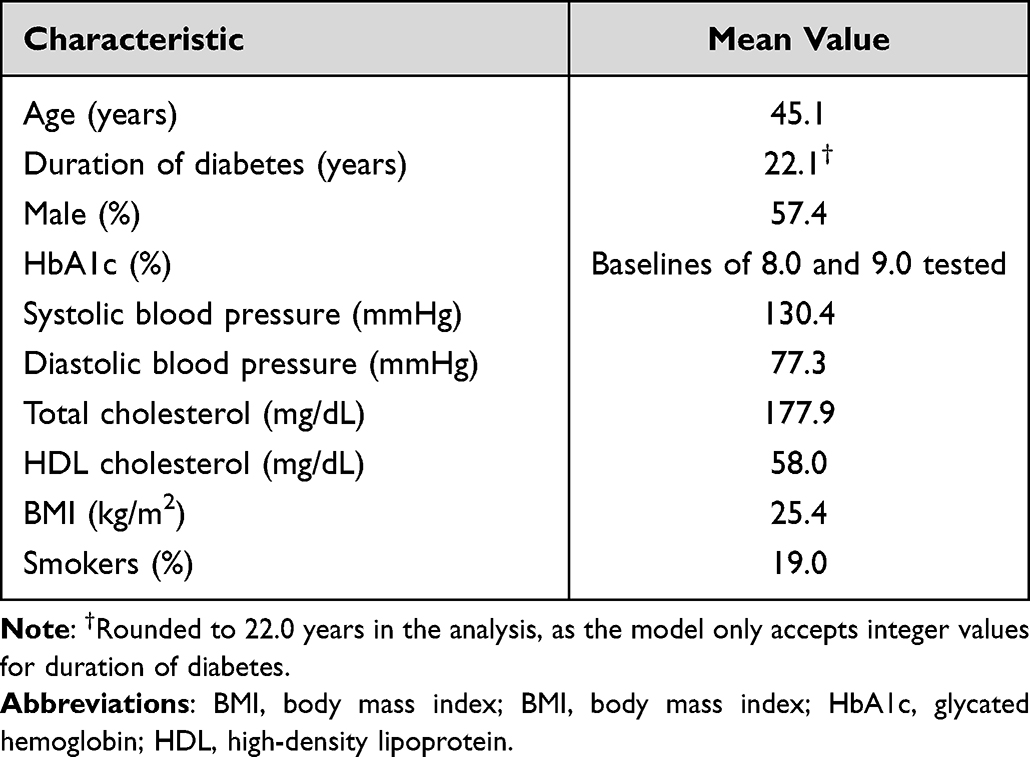 |
Table 1 Baseline Cohort Characteristics Applied in the Analyses |
Estimation of Population-Level Burden
The population-level burden associated with poor glycemic control was calculated as the product of the individual-level results from the model and the prevalence of individuals at HbA1c levels of 7.0%, 8.0% and 9.0%. These prevalence estimates were based on the total number of people with type 1 diabetes in the Netherlands (estimated to be 104,678) and the proportions of individuals with HbA1c levels <7.5%, between 7.5% and 8.9%, and ≥9.0% reported by McKnight et al.2,11 The study by McKnight et al included 324,498 people with type 1 diabetes, including 1819 from the Netherlands, and represents the most comprehensive study of glycemic control in people with type 1 diabetes. The review of registry data found that 27.9% of patients had an HbA1c <7.5%, 41% of patients had an HbA1c between 7.5% and 8.9%, and 31.1% of patients had an HbA1c >9%. People with HbA1c levels <7.5%, between 7.5% and 8.9% and ≥9.0% in the study by McKnight et al were assumed to be equivalent to modeled patients with mean HbA1c levels of 7.0%, 8.0% and 9.0%, respectively.
Costs and Utilities
Costs were accounted from a societal perspective, in line with health economic guidance in the Netherlands, and expressed in 2021 euros (EUR).20 Direct costs captured the costs of treating diabetes-related complications and the costs of patient management (screening programs and non-diabetes medications), which were identified in a literature review and inflated to 2021 EUR where necessary (see Appendix for all values and associated references). Indirect costs arising from lost workplace productivity were based on annual days off work estimates published by Sørenson and Ploug for chronic complications and de Groot et al for hypoglycemia, and the most recent annual salary data available in the Netherlands.25,26 Costs of lost workplace productivity were calculated by multiplying the days off work associated with complications by the annual salary divided by the number of working days per year. A friction period of 3 months was applied, reflecting the pharmacoeconomic guidelines for the Netherlands.20 No pharmacy or consumable costs relating to type 1 diabetes were included in the analyses. These costs were excluded, as there are numerous ways of improving glycemic control, each appropriate for different individuals and with different costs. By excluding these costs, the analysis aims to identify the budget available to improve care without increasing overall healthcare expenditure (ie, an intervention that could bring patients to glycemic control targets at a lower cost than the cost savings calculated in this study would achieve overall cost savings for the healthcare system [direct costs] or society [direct and indirect costs]). Indirect costs were accrued only while simulated individuals remained below the set retirement age (67 years). Utilities relating to quality of life were sourced from a literature review specific to type 1 diabetes published by Smith-Palmer et al.27 Event utilities were applied in the year that diabetes-related complications occurred, with state utilities applied in following years. While pharmacoeconomic guidelines for the Netherlands state that quality of life should be assessed using the EQ-5D-5L instrument and valued using the Netherlands reference values, a comprehensive data set covering all inputs required for an analysis using the IQVIA CORE Diabetes Model using this approach has not been published. Therefore, values from other settings were used. Utilities were combined using the “CORE Default Method”, which involves taking the lowest state utility associated with existing complications and adding event disutilities for any events that occur in that year to create annual utility scores for each simulated patient.16
Results
Patient-Level Outcomes
Projected model outcomes indicated that delays in achieving glycemic control were associated with substantial reductions in life expectancy and quality-adjusted life expectancy, and increases in direct and indirect costs in people with type 1 diabetes, over both 10-years and patient lifetime time horizons (Table 2). Benefits with immediate glycemic control were due to reduced incidence and increased times to onset of diabetes-related complications (Figure 2) and were more pronounced versus longer delays in achieving control. Benefits were observed across all chronic complications included in the IQVIA CORE Diabetes Model (angina, myocardial infarction, congestive heart failure, stroke, peripheral vascular disease, diabetic retinopathy, macular edema, cataract, nephropathy and end-stage renal disease, neuropathy, foot ulcer and amputation).
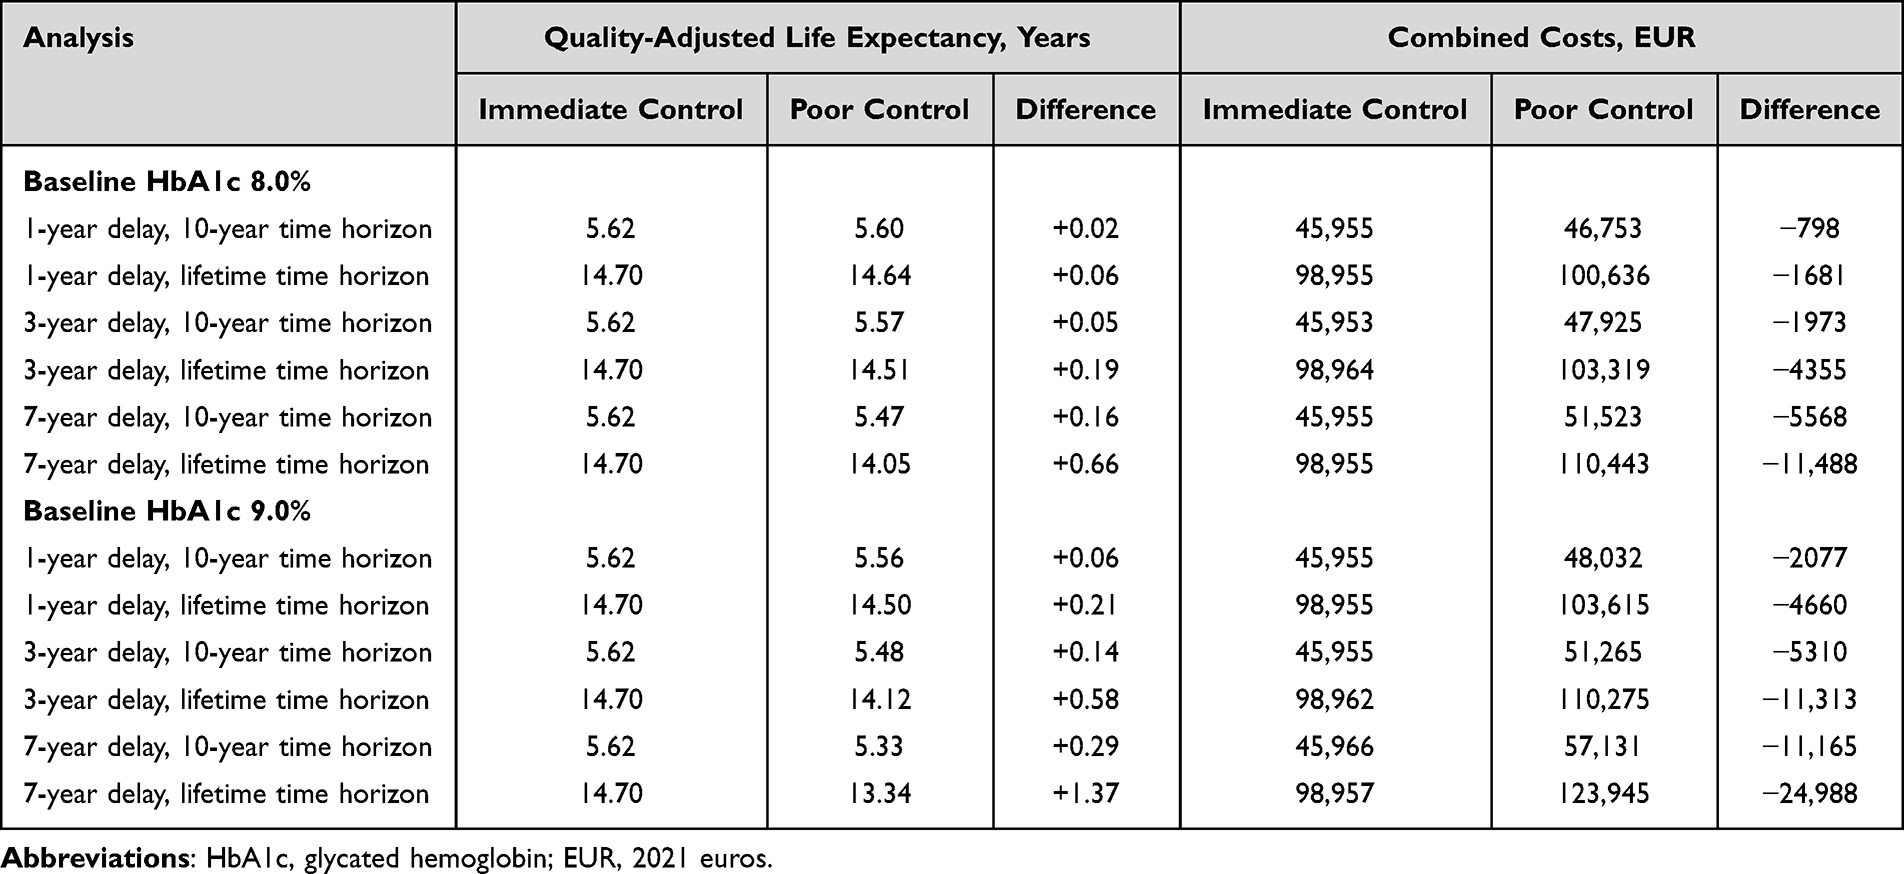 |
Table 2 Patient-Level Outcomes for All Analyses |
 |
Figure 2 Time to onset of any diabetes-related complication in the analyses. Improved glycemic control in the immediate control arm drove a delayed time to onset of complications compared with remaining in poor control. This was more pronounced versus longer delays in achieving control and over the longer time horizon. Abbreviation: HbA1c, glycated hemoglobin. |
Over a lifetime time horizon, improving HbA1c from 8.0% to 7.0% resulted in gains of 0.06, 0.19 and 0.66 QALYs per patient compared with remaining in poor control for 1, 3 and 7 years, respectively. Direct cost savings of EUR 788, EUR 2052 and EUR 4196 per patient were identified with achieving a glycemic control target of 7% compared with remaining at an HbA1c of 8.0% for 1, 3 and 7 years, respectively. Similarly, indirect cost savings of EUR 893, EUR 2303, and EUR 7292 per patient were projected for those achieving a glycemic control target of 7% compared with remaining at an HbA1c of 8.0% for 1, 3 and 7 years, respectively. Combined (direct and indirect) costs were estimated to be EUR 1681, EUR 2052 and EUR 11,488 lower per patient with immediate glycemic control from a baseline HbA1c of 8.0% versus delays of 1, 3 and 7 years in achieving control, respectively.
The clinical benefits with immediate glycemic control were greater when compared with remaining at a baseline HbA1c of 9.0%, with gains of 0.21, 0.58 and 1.37 QALYs per patient compared with remaining in poor control for 1, 3 and 7 years, respectively. Cost savings were also larger, with direct cost savings of EUR 2340, EUR 5333 and EUR 11,112 per patient versus poor control for 1, 3 and 7 years, respectively, indirect cost savings of EUR 2320, EUR 5980 and EUR 13,876 per patient versus remaining in poor control for 1, 3 and 7 years, respectively, and combined cost savings of EUR 4660, EUR 11,313 and EUR 24,988 per patient versus 1-, 3- and 7-year delays in achieving control, respectively.
Over a 10-year time horizon, benefits with immediate glycemic control were smaller than over patient lifetimes, but still sizeable. From a baseline HbA1c of 8.0%, gains of 0.02, 0.05 and 0.16 QALYs per patient were projected with immediate glycemic control versus delays of 1, 3 and 7 years, respectively. Direct cost savings were estimated to be EUR 223, EUR 493, and EUR 1153, indirect cost savings were estimated to be EUR 575, EUR 1480 and EUR 4415, and combined cost savings were estimated to be EUR 798, EUR 1973 and EUR 5568 per patient versus delays in achieving glycemic control of 1, 3 and 7 years, respectively.
When achieving a glycemic target of 7.0% was compared with remaining at a baseline HbA1c of 9.0%, immediate control was projected to gain 0.06, 0.14 and 0.29 QALYs versus delays of 1, 3 and 7 years, respectively. Direct cost savings of EUR 568, EUR 1335 and EUR 2415 were projected compared with delays of 1, 3 and 7 years in achieving glycemic control targets, respectively. Similarly, projected per patient indirect cost savings versus delays of 1, 3 and 7 years in achieving glycemic control targets were EUR 1509, EUR 3976 and EUR 8750, respectively. Combined cost savings of EUR 2077, EUR 5310 and EUR 11,165 per patient versus 1-, 3- and 7-year delays, respectively, were identified.
Population-Level Outcomes
Over individuals’ lifetimes, estimation of the clinical and economic burden at the population level, based on the percentages of people with poor glycemic control reported by McKnight et al, indicated that bringing all individuals to an HbA1c of 7.0% resulted in gains of 9438 QALYs, direct cost savings of EUR 110 million, indirect cost savings of EUR 114 million, and combined cost savings of EUR 224 million, compared with remaining in poor glycemic control for 1 year (Table 3). When immediately achieving glycemic control was compared with longer times in poor control, clinical benefits and cost savings were greater. When achieving glycemic control was compared with remaining in poor control for 3 years, increases in quality-adjusted life expectancy by 27,171 QALYs, direct cost savings of EUR 262 million, indirect cost savings of EUR 294 million, and combined cost savings of EUR 556 million were projected. Compared with remaining in poor control for 7 years, bringing all patients to an HbA1c of 7.0% was associated with improvements in quality-adjusted life expectancy of 72,717 QALYs, direct cost savings of EUR 543 million, indirect cost savings of EUR 765 million, and combined cost savings of EUR 1.3 billion.
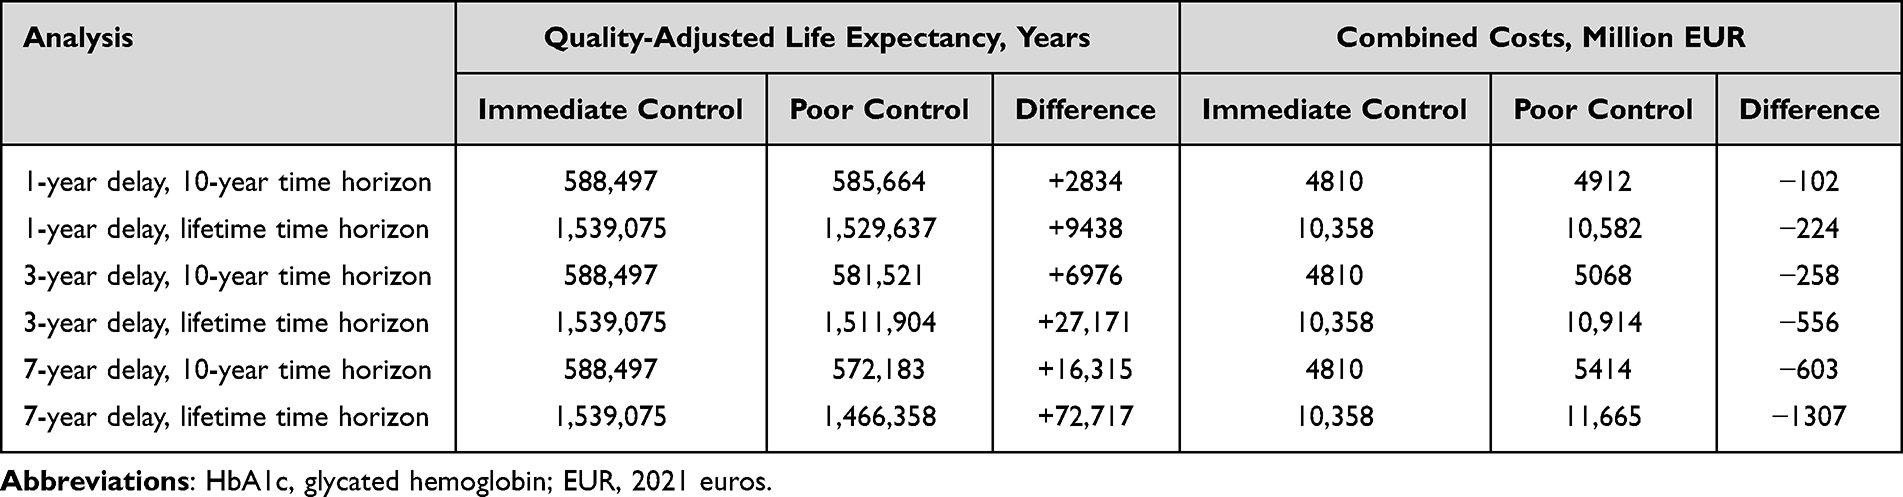 |
Table 3 Population-Level Outcomes |
Over 10 years, population-level clinical burden was expected to be improved by 2834 QALYs, 6976 QALYs and 16,315 QALYs when bringing patients to an HbA1c target of 7.0% was compared with 1, 3 and 7 years in poor control, respectively. Direct cost savings versus 1, 3 and 7 years in poor control were projected to be EUR 28 million, EUR 65 million and EUR 128 million, respectively. Similarly, indirect cost savings of EUR 74 million, EUR 193 million and EUR 475 million were estimated compared with 1, 3 and 7 years in poor control, respectively. From a societal perspective, bringing patients to a glycemic control target resulted in combined cost savings of EUR 102 million, EUR 258 million, and EUR 603 million compared with remaining in poor glycemic control for 1, 3 and 7 years, respectively.
Results generated were robust to changes in the proportion of patients in each glycemic control category. Immediate glycemic control remained associated with cost savings and improved clinical outcomes when any fraction of the people with type 1 diabetes were above glycemic control target.
Discussion
The present analysis demonstrates that delays in achieving glycemic control in people with type 1 diabetes are likely to result in a substantial clinical and economic burden in the Netherlands. At a patient level, bringing patients to glycemic control targets could result in improvements in quality-adjusted life expectancy of up to 1.37 QALYs over a patient’s lifetime for those with an HbA1c of 9.0% at baseline compared with remaining in poor control for 7 years. Smaller, but still important gains in duration and quality of life were made when outcomes were assessed over shorter time horizons, versus shorter delays in intensification, and when compared with lower HbA1c values at baseline. At a population level, even versus a delay of 1 year, immediate glycemic control was associated with gains of 9438 QALYs over individuals’ lifetimes across the population with type 1 diabetes in the Netherlands, and these gains were projected to increase to 72,717 QALYs versus longer delays. Population-level cost savings with immediate control were found to be EUR 1.3 billion versus a 7-year delay over individuals’ lifetimes. These results indicate that even short delays in achieving glycemic control can have a substantial impact on the burden related to type 1 diabetes, and that bringing individuals to glycemic targets as early as possible is crucial to maximizing health for the population with type 1 diabetes in the Netherlands.
The analysis found that improving glycemic control resulted in important direct and indirect cost savings. While indirect costs due to lost workplace productivity made the most significant contribution to the overall combined cost savings, direct cost savings were also considerable at both the individual and population level. The proportions of savings attributable to direct and indirect costs in the present analysis were in line with those estimated for total diabetes-related expenditure by Peters et al.3 Moreover, use of a societal perspective is recommended in the guidelines for health economic analyses in the Netherlands.20 The approach to indirect costs in the present analysis is likely to be conservative. The structure of the IQVIA CORE Diabetes Model captures the cost of lost productivity based on days of work associated with diabetes-related complications and average salary. Other aspects of indirect costs, such as travel expenses, informal care, and other municipal services, cannot be captured. While this is a limitation of the analysis, it is likely that the cost savings associated with improved, immediate glycemic control would be larger, as these costs would all increase with an increased incidence of complications.
The present analysis did not capture the costs of bringing patients to the glycemic control target of 7.0%. The opportunities for improving care are diverse, including use of modern insulins, the increased interest in using oral medications previously used in type 2 diabetes, continuous glucose monitoring with or without an integrated insulin pump, flash glucose monitoring, and education programs focusing on appropriate dosing based on food intake and energy expenditure.28 It is likely that different approaches will be required for different individuals, and that a combination of these methods would achieve the best results at a population level. The present analysis identified the potential cost savings as a result of improving glycemic control, and therefore the budget available to improve care without increasing overall healthcare expenditure.
To extrapolate to a population level, data on the proportion of patients with type 1 diabetes in poor glycemic control were taken from an international study.11 While that review of registry data captured patients treated in Rotterdam, the proportion of patients in poor control was not based exclusively on Netherlands-specific data and this could be considered a limitation of the analysis. To date, data on the proportions of patients with type 1 diabetes achieving glycemic control targets in the Netherlands have not been routinely collected and published. However, this is now starting to occur more frequently, with data now being collected based on electronic medical records and an initiative to start a Netherlands-wide national database.29,30 Expanding this data collection across the Netherlands represents a key target, allowing a detailed review of current care and identification of opportunities to improve treatment, thereby actualizing the clinical benefits and cost savings identified in the present analysis. A further consideration is that the HbA1c levels of <7.5%, between 7.5% and 8.9% and ≥9.0% in the study by McKnight et al were assumed to be equivalent to modeled patients with mean HbA1c levels of 7.0%, 8.0% and 9.0%, respectively.11 This simplification is likely to be conservative, as the improvements in quality-adjusted life expectancy and cost savings would be greater than those identified in the modeling analysis in patients with HbA1c values ≥9.0%, where all patients were assumed to be on the lower limit of the glycemic control range.
The present analysis used an HbA1c target for all patients in line with a number of treatment guidelines, and this guideline-based approach represents a key strength of the present analysis.9,10 However, it should be noted that individualized treatment targets are being increasingly used, taking into account patient characteristics such as age, presence of comorbidities, and risk of hypoglycemia. For some patients, an HbA1c target of 7.0% may not be appropriate, and a higher treatment target may be used. For other patients, bringing HbA1c lower may be possible. For example, the National Institute for Health and Care Excellence (NICE) in the UK recommends a glycemic control target of 6.5%.31 Greater reductions in HbA1c would lead to further clinical benefits and cost savings, as a result of the lower risk of diabetes-related complications. However, any reductions in HbA1c below 7.0% should be weighed against the increased risk of hypoglycemia. Data suggest that hypoglycemia risk increases as HbA1c is reduced, but that different insulin formulations are associated with different risks at equivalent HbA1c values.32 Hypoglycemic events represent a key concern for patients with type 1 diabetes, with fear of hypoglycemia shown to have a marked impact on quality of life.12–14 Moreover, hypoglycemia has been described as the limiting factor in improving glycemic control.33 The present analysis used a simplified approach with an HbA1c target of 7.0% for all patients. Individualized patient targets may be both above or below this, and therefore the analysis is likely to provide pertinent data to healthcare decision makers in terms of the clinical benefits and cost savings that can be achieved by improving glycemic control.
The present analysis is the first to assess the clinical and economic burden of poor glycemic control in people with type 1 diabetes in the Netherlands. Previous studies have examined a similar research question in people with type 2 diabetes in the UK, the United States of America, and Sweden.15,34,35 While the previous analyses assessed type 2 rather than type 1 diabetes and were in different country settings, the results of the analyses are similar, with improved glycemic control associated with improvements in clinical outcomes and cost savings. The magnitude of the benefits varied depending on a number of country-specific factors, including the age of the cohort (benefits are greater in younger cohorts), the current glycemic control levels (benefits are greater in cohorts with poorer baseline glycemic control), and the costs of treating diabetes-related complications (benefits are greater in countries where treating complications is more costly).
As with any long-term modeling analysis, it is important to note the inherent uncertainty associated with projection of outcomes. The present study aimed to mitigate uncertainty and provide reliable and robust results by using a widely accepted, published and validated model of type 1 diabetes (the IQVIA CORE Diabetes Model), with the last validation published in 2014.16,17 While much has changed in the management of type 1 diabetes since 2014, with increased use of technologies such as insulin pumps and continuous glucose monitors, it is likely that the relationships between risk factors and the incidence of diabetes-related complications remain unchanged. Future published validation of the IQVIA CORE Diabetes Model is required in order for projected results to continue to be considered robust. A further consideration is how representative the baseline cohort published by van Dijk et al is of the population with type 1 diabetes, as the sample size was relatively small.21 This is difficult to judge definitively, but the cohort characteristics reported by van Dijk et al were similar to those reported in other studies identified in the literature review. Moreover, while the analysis used assumptions around HbA1c and other physiological parameter progressions that are likely a simplification of reality, this eliminated uncertainty around differences between the two modeled arms and allowed only the differences in glycemic control to be assessed. The inclusion of indirect costs was a strength, but Netherlands-specific days off work estimates were not available for the majority of complications. Therefore, inputs were taken from a Danish analysis.25 The impact of this on the analysis is hard to quantify, but it is likely that the days off work associated with complications would not vary significantly between these Northern European countries. Limitations inherent to the IQVIA CORE Diabetes Model meant that the impact of diabetes-related complications leading to early retirement were not captured in the present analysis, as the model captures mean days off work associated with each complication in the year of the event and in subsequent years, rather than those that retire early.
Conclusions
The clinical and economic burden of poor glycemic control in people with type 1 diabetes in the Netherlands was projected to be substantial, over both the short and long term. Considerable gains in quality-adjusted life expectancy and significant cost savings could be achieved through early and effective treatment to reach and maintain glycemic targets. The present analysis suggests that introduction of interventions (such as new insulin formulations, use of type 2 diabetes medications, new technologies, or education programs) to improve glycemic control in people with type 1 diabetes should be a priority in the Netherlands. While new interventions are likely to be associated with increased costs, the present analysis identified that significant cost offsets, from both a healthcare payer and societal perspective, could be expected.
Abbreviations
DCCT, Diabetes Control and Complications Trial; EDIC, Epidemiology of Diabetes Interventions and Complications; EUR, euros; HbA1c, glycated hemoglobin; QALY, quality-adjusted life year.
Data Sharing Statement
All data generated or analyzed during this study are included in this published article.
Ethics Approval and Informed Consent
The presented study did not involve research on human subjects or animals, and therefore no ethical approval was required.
Author Contributions
All authors made a significant contribution to the work reported, whether that is in the conception, study design, execution, acquisition of data, analysis and interpretation, or in all these areas; took part in drafting, revising or critically reviewing the article; gave final approval of the version to be published; have agreed on the journal to which the article has been submitted; and agree to be accountable for all aspects of the work.
Funding
This study was supported by funding from Novo Nordisk BV, Alphen aan den Rijn, Netherlands.
Disclosure
RGJM and ELH are employees of Novo Nordisk BV. SJPM and BH are employees of Ossian Health Economics and Communications, which received consulting fees from Novo Nordisk BV to support preparation of the analysis.
References
1. International Diabetes Federation. Diabetes Atlas – 10th Edition; 2021. Available from: https://diabetesatlas.org/data/en/.
2. Volksgezondheidenzorg.info. Prevalentie diabetes in huisartsenpraktijk naar leeftijd en geslacht [Prevalence of diabetes in general practice by age and gender]; 2020. Available from: https://www.volksgezondheidenzorg.info/onderwerp/diabetes-mellitus/cijfers-context/huidige-situatie#node-prevalentie-diabetes-huisartsenpraktijk-naar-leeftijd-en-geslacht.
3. Peters ML, Huisman EL, Schoonen M, Wolffenbuttel BHR. The current total economic burden of diabetes mellitus in the Netherlands. Neth J Med. 2017;75(7):281–297.
4. Liaropoulos L, Goranitis I. Health care financing and the sustainability of health systems. Int J Equity Health. 2015;14:80. doi:10.1186/s12939-015-0208-5
5. The Diabetes Control and Complications Trial Research Group. The effect of intensive treatment of diabetes on the development and progression of long-term complications in insulin-dependent diabetes mellitus. N Engl J Med. 1993;329:977–986. doi:10.1056/NEJM199309303291401
6. Nathan DM. The diabetes control and complications trial/epidemiology of diabetes interventions and complications study at 30 years: overview. Diabetes Care. 2014;37(1):9–16. doi:10.2337/dc13-2112
7. The DCCT/EDIC Research Group. Intensive diabetes treatment and cardiovascular outcomes in type 1 diabetes: the DCCT/EDIC study 30-year follow-up NIH external link. Diabetes Care. 2016;39(5):686–693. doi:10.2337/dc15-1990
8. Stettler C, Allemann S, Jüni P, et al. Glycemic control and macrovascular disease in types 1 and 2 diabetes mellitus: meta-analysis of randomized trials. Am Heart J. 2006;152(1):27–38. doi:10.1016/j.ahj.2005.09.015
9. Smith A, Harris C. Type 1 diabetes: management strategies. Am Fam Physician. 2018;98(3):154–162.
10. American Diabetes Association. 6. glycemic targets: standards of medical care in diabetes-2020. Diabetes Care. 2020;43(Suppl 1):S66–S76.
11. McKnight JA, Wild SH, Lamb MJE, et al. Glycaemic control of type 1 diabetes in clinical practice early in the 21st century: an international comparison. Diabet Med. 2015;32(8):1036–1050. doi:10.1111/dme.12676
12. McCrimmon RJ, Frier BM. Hypoglycaemia, the most feared complication of insulin therapy. Diabete Metab. 1994;20(6):503–512.
13. McCrimmon RJ, Frier BM, Deary IJ. Appraisal of mood and personality during hypoglycaemia in human subjects. Physiol Behav. 1999;67(1):27–33. doi:10.1016/S0031-9384(99)00035-9
14. McCrimmon RJ, Sherwin RS. Hypoglycemia in Type 1 Diabetes. Diabetes. 2010;59(10):2333–2339. doi:10.2337/db10-0103
15. Bain SC, Bekker Hansen B, Hunt B, Chubb B, Valentine WJ. Evaluating the burden of poor glycemic control associated with therapeutic inertia in patients with type 2 diabetes in the UK. J Med Econ. 2020;23(1):98–105. doi:10.1080/13696998.2019.1645018
16. Palmer AJ, Roze S, Valentine WJ, et al. The CORE diabetes model: projecting long-term clinical outcomes, costs and cost-effectiveness of interventions in diabetes mellitus (types 1 and 2) to support clinical and reimbursement decision-making. Curr Med Res Opin. 2004;20(Suppl 1):S5–26. doi:10.1185/030079904X1980
17. Palmer AJ, Roze S, Valentine WJ, et al. Validation of the CORE diabetes model against epidemiological and clinical studies. Curr Med Res Opin. 2004;20(Suppl 1):S27–40. doi:10.1185/030079904X2006
18. McEwan P, Foos V, Palmer JL, Lamotte M, Lloyd A, Grant D. Validation of the IMS CORE diabetes model. Value Health. 2014;17:14–24. doi:10.1016/j.jval.2014.07.007
19. World Health Organization. Global health observatory data repository: life tables by country (Netherlands); 2020. Available from: http://apps.who.int/gho/data/view.main.61160?lang=en.
20. Zorginstituut Nederland. Guideline for economic evaluations in healthcare; 2016. Available from: https://english.zorginstituutnederland.nl/publications/reports/2016/06/16/guideline-for-economic-evaluations-in-healthcare.
21. van Dijk PR, Pasch A, van Ockenburg-Brunet SL, et al. Thiols as markers of redox status in type 1 diabetes mellitus. Ther Adv Endocrinol Metab. 2020;11:2042018820903641. doi:10.1177/2042018820903641
22. Special Eurobarometer. Attitudes of Europeans towards tobacco and electronic cigarettes; 2017. Available from: https://ec.europa.eu/commfrontoffice/publicopinion/index.cfm/ResultDoc/download/DocumentKy/79002.
23. World Health Organization. Global status report on alcohol and health; 2018. Available from: http://apps.who.int/iris/bitstream/handle/10665/274603/9789241565639-eng.pdf?ua=1.
24. Statistics Netherlands. Background migration data; 2022. Available from: https://www.cbs.nl/nl-nl/cijfers/detail/37325.
25. Sørensen J, Ploug UJ. The cost of diabetes-related complications: registry-based analysis of days absent from work. Econ Re Int. 2013;2013:618039.
26. de Groot S, Enters-Weijnen CF, Geelhoed-Duijvestijn PH, Kanters TA. A cost of illness study of hypoglycaemic events in insulin-treated diabetes in the Netherlands. BMJ Open. 2018;8:e019864. doi:10.1136/bmjopen-2017-019864
27. Smith-Palmer J, Bae JP, Boye KS, Norrbacka K, Hunt B, Valentine WJ. Evaluating health-related quality of life in type 1 diabetes: a systematic literature review of utilities for adults with type 1 diabetes. Clinicoecon Outcomes Res. 2016;8:559–571. doi:10.2147/CEOR.S114699
28. Pathak V, Pathak NM, O’Neill CL, Guduric-Fuchs J, Medina RJ. Therapies for type 1 diabetes: current scenario and future perspectives. Clin Med Insights Endocrinol Diabetes. 2019;12:1179551419844521. doi:10.1177/1179551419844521
29. van Eeghen S, Krul-Poel Y, Linger-Wever S, Stam F, Simsek S. Evaluating glycaemic control of patients with type 1 diabetes mellitus in a Dutch hospital: a cross-sectional real-world database study using electronic medical records. Abstract presented at Annual Dutch Diabetes Research Meeting; 2020. Available from: https://www.ncbi.nlm.nih.gov/pmc/articles/PMC7645912/pdf/12467_2020_Article_611.pdf/?tool=EBI.
30. Serné E, Mourits P, van Strien M. Nationale diabetes registratie: voor een toekomstbestendige en persoonsgerichte diabeteszorg in Nederland [National Diabetes Registry: For future-proof and person-oriented diabetes care in the Netherlands]. Nederlands Tijdschrift voor Diabetologie. 2020;18(2):27–31. doi:10.1007/s12467-020-0131-2
31. National Institute for Health and Care Excellence. Type 1 diabetes in adults: diagnosis and management – NICE guideline [NG17] 2015; 2022. Available from: https://www.nice.org.uk/guidance/ng17/chapter/1-Recommendations#blood-glucose-management-2.
32. Mullins P, Sharplin P, Yki-Jarvinen H, Riddle MC, Haring HU. Negative binomial meta-regression analysis of combined glycosylated hemoglobin and hypoglycemia outcomes across eleven Phase III and IV studies of insulin glargine compared with neutral protamine Hagedorn insulin in type 1 and type 2 diabetes mellitus. Clin Ther. 2007;29(8):1607–1619. doi:10.1016/j.clinthera.2007.08.020
33. Cryer PE. Hypoglycemia in type 1 diabetes mellitus. Endocrinol Metab Clin North Am. 2010;39(3):641–654. doi:10.1016/j.ecl.2010.05.003
34. Ali SN, Dang-Tan T, Valentine WJ, Hansen BB. Evaluation of the clinical and economic burden of poor glycemic control associated with therapeutic inertia in patients with type 2 diabetes in the United States. Adv Ther. 2020;37(2):869–882. doi:10.1007/s12325-019-01199-8
35. Hellgren M, Svensson AM, Franzén S, et al. The burden of poor glycaemic control in people with newly diagnosed type 2 diabetes in Sweden: a health economic modelling analysis based on nationwide data. Diabetes Obes Metab. 2021;23(7):1604–1613. doi:10.1111/dom.14376
 © 2023 The Author(s). This work is published and licensed by Dove Medical Press Limited. The
full terms of this license are available at https://www.dovepress.com/terms
and incorporate the Creative Commons Attribution
- Non Commercial (unported, 3.0) License.
By accessing the work you hereby accept the Terms. Non-commercial uses of the work are permitted
without any further permission from Dove Medical Press Limited, provided the work is properly
attributed. For permission for commercial use of this work, please see paragraphs 4.2 and 5 of our Terms.
© 2023 The Author(s). This work is published and licensed by Dove Medical Press Limited. The
full terms of this license are available at https://www.dovepress.com/terms
and incorporate the Creative Commons Attribution
- Non Commercial (unported, 3.0) License.
By accessing the work you hereby accept the Terms. Non-commercial uses of the work are permitted
without any further permission from Dove Medical Press Limited, provided the work is properly
attributed. For permission for commercial use of this work, please see paragraphs 4.2 and 5 of our Terms.