")
Back to Journals » International Journal of General Medicine » Volume 15
Evaluating Impact of Pulse Pressure on Indexes of Myocardial Work by Speckle-Tracking Echocardiography in Normotensive, Prehypertensive and Newly Diagnosed Hypertensive Patients
Authors Qin Z, Liu D, You X, Duan Q , Zhao Y
Received 6 December 2021
Accepted for publication 28 January 2022
Published 22 February 2022 Volume 2022:15 Pages 1933—1943
DOI https://doi.org/10.2147/IJGM.S351628
Checked for plagiarism Yes
Review by Single anonymous peer review
Peer reviewer comments 3
Editor who approved publication: Dr Scott Fraser
Zheng Qin,1 Dawei Liu,2 Xiaojun You,3 Qin Duan,3 Yu Zhao1
1Department of Vascular Surgery, The First Affiliated Hospital of Chongqing Medical University, Chongqing, 400016, People’s Republic of China; 2Department of Cardiovascular Medicine, The Bishan Hospital of Chongqing Medical University, Chongqing, 402760, People’s Republic of China; 3Department of Cardiovascular Medicine, The First Affiliated Hospital of Chongqing Medical University, Chongqing, 400016, People’s Republic of China
Correspondence: Qin Duan, Department of Cardiovascular Medicine, The First Affiliated Hospital of Chongqing Medical University, Chongqing, People’s Republic of China, Email [email protected] Yu Zhao, Department of Vascular Surgery, The First Affiliated Hospital of Chongqing Medical University, Chongqing, People’s Republic of China, Email [email protected]
Background: The impact of pulse pressure (PP) on indexes of myocardial work (MWIs). This study aims to explore the potential association of high PP with myocardial work (MW).
Hypothesis: PP had an association with four indexes of MW in a mixed population of normotensive, prehypertensive and newly diagnosed hypertensive individuals.
Methods: The study was a single-center, cross-sectional, observational study. A total of 204 participants (66 normotensive, 35 prehypertensive and 103 newly diagnosed hypertensive individuals) were evaluated by speckle-tracking echocardiography (STE) and blood pressure measurement. According to the PP tertiles, the participants were divided into three groups: Group I (< 44 mmHg, n=67), Group II (44– 52 mmHg, n=68) and Group III (≥ 52 mmHg, n=69).
Results: In Group II and Group III, the proportion of males was higher than that in Group I (median 46 vs 30 (P=0.002)). With increasing PP, the three indexes of MW, namely, GWI, GCW and GWW, increased, and the differences among the three groups were statistically significant (P< 0.001). PP was positively related to GWI, GCW and GWW and negatively correlated with GWE. After adjusting for E/e’, LVMI, LAVI and GLS, PP was still significantly correlated with the four MW indexes (both P< 0.001).
Conclusion: PP had a strong association with four indexes of MW in a mixed population of normotensive, prehypertensive and newly diagnosed hypertensive individuals. The evaluation of PP and MWIs might be valuable for identifying very early diastolic impairment of the heart.
Keywords: arterial stiffness, myocardial work, hypertension, speckle-tracking echocardiography, pulse pressure
Introduction
Pulse pressure (PP) is generally a convenient method to reflect potential adverse impacts on Cardiovascular function and obtain a rough estimate of arterial stiffness.1–4 Studies have demonstrated that PP provides valuable information on cardiovascular outcomes.5–7 The association between elevated PP and adverse Cardiovascular risks is independent of systolic or diastolic pressure in hypertensive patients.8,9 PP is also seen as a surrogate measurement of arterial stiffness,10 as it reflects the efficiency of heart contraction and the compliance of large arteries.11 In this context, PP could be regarded as an independent marker of preclinical cardiovascular damage.
Myocardial work (MW) is a novel, noninvasive, speckle tracking echocardiographic (STE)-based parameter that is measured by brachial artery blood pressure and LV global longitudinal strain (GLS), which is a promising way to evaluate LV performance.12 Recently, it was shown that GLS and myocardial deformation analysis indicated an impairment of systolic function in hypertensive at rest.13 Lembo et al reported that an elevated PP negatively influences GLS in a population of normotensive and untreated hypertensive individuals.14 Although GLS is a novel and well-validated method for clinical application in the assessment of cardiovascular disease, it is still limited by load dependency15,16 because the increased afterload may decrease GLS and lead to fallacious conclusions about LV contractility.17 However, the relationship between PP and indexes of myocardial work (MWIs) has not been explored in a population of normotensive, prehypertensive and hypertensive individuals.
The present study aims to investigate the relationship between PP and MWIs in a population of normotensive, prehypertensive and newly diagnosed hypertensive participants by evaluating various echocardiographic parameters and four indexes of MW, including global work index (GWI), global work efficiency (GWE), global constructed work (GCW) and global wasted work (GWW).
Patients and Methods
Study Design and Population
The present study was a single center, cross-sectional, observational study that recruited consecutive normotensive, prehypertensive and newly diagnosed hypertensive individuals from December 2020 to March 2021 in the Department of Cardiovascular Medicine of the First Affiliated Hospital of Chongqing Medical University. A total of 244 patients underwent a standard echocardiography examination including speckle-tracking echocardiography (STE) with three apical views.
The exclusion criteria were patients aged less than 18 or greater than 65 years, previous diagnosis of diabetes mellitus, coronary artery disease, valvular heart disease, primary cardiomyopathies, arterial fibrillation, left ventricular ejection fraction<50%, and inadequate echocardiographic imaging. Patients with diseases leading to low PP (≤30 mmHg) were specifically examined and excluded, including pericardial disease, severe mitral stenosis, aortic stenosis, severe chronic heart failure, blood loss and shock. A total of 40 patients were excluded from the study according to the preset criteria. Ultimately, 204 patients were recruited for this study, including 66 normotensive, 35 prehypertensive and 103 newly diagnosed hypertensive participants (Figure 1).
 |
Figure 1 Flow chart for the study population. Abbreviations: DM, diabetes mellitus; CAD, coronary artery disease; VHD, valvular heart disease; PC, primary cardiomyopathies; AF, arterial fibrillation; LVEF, left ventricular ejection fraction. |
The diagnostic criteria for hypertension were based on the 2018 version of the Chinese Hypertension Prevention Guide.18 Normal (SBP<120 mmHg and DBP<80 mmHg), prehypertension (SBP 120–139 mmHg and/or DBP 80–89 mmHg) and hypertension (SBP ≥140 mmHg and/or DBP ≥ 90 mmHg) are used to classify BP levels. Blood pressure was measured in the supine position with a cuff sphygmomanometer before the echocardiographic exam (average of three measurements), and this measurement was chosen for statistical analysis to evaluate echocardiographic parameters and left ventricular afterload almost simultaneously. PP used was calculated as the systolic minus the diastolic blood pressures. This study (NCT 05062811) was in accordance with the Declaration of Helsinki, and ethical approval was obtained from the local ethics committee (approval number 2018-035). All participants gave written informed consent.
Echocardiography Examination
Standard echo examinations were performed by 3 experienced sonographers using a GE E95 machine (GE, Vingmed Ultrasound, Horten, Norway) equipped with an M5S 3.5 mHz transthoracic transducer. All measurements and recordings fulfilled current American Society of Echocardiography recommendations.19 Patients were scanned in the left lateral decubitus position to obtain standard 2D images with an average of 3 measurements of consecutive cardiac cycles. LV volumes were calculated using the Simpson biplane method, LV mass was calculated by the linear method and normalized to body surface area, and sex-dependent cutoff values were applied to indicate LV hypertrophy (LVH).20
Myocardial Work Analysis
LV MWIs, namely, the global work index (GWI), global work efficiency (GWE), global constructed work (GCW) and global wasted work (GWW), reflect the stroke work of the LV (Figure 2). Peak systolic LV pressure and peak arterial pressure can be treated as equal in the absence of a gradient through the LV outflow tract and the aortic valve. MWIs are measured from brachial artery blood pressure and GLS of the LV, followed by the timing of mitral valve closure (MVC) and mitral valve opening (MVO) from a three-chamber apical view of the LV and by placing a corresponding cursor.12 GWI is the total work within the area of the LV pressure-strain loop, from mitral valve closure to mitral valve opening. GCW is the MW performed during LV shortening in systole. The GWW is the MW performed during LV lengthening in systole and LV shortening during the isovolumic relaxation phase. The GWE is calculated as the ratio of CW/(CW+WW).21 All these data were calculated automatically using commercially available Echopac software for assessment, and the methodology for the MWIs was validated in previous publications.
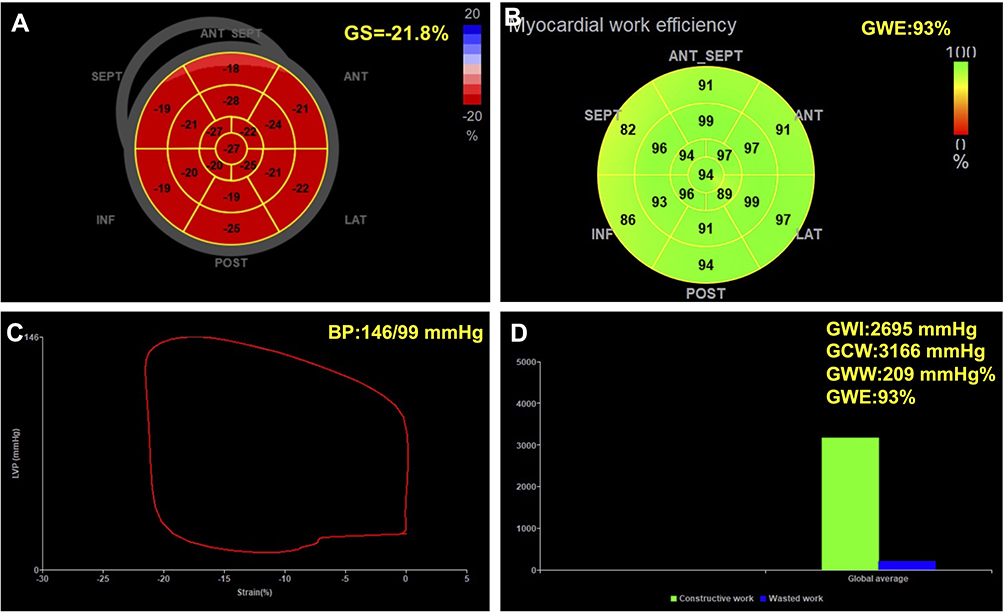 |
Figure 2 Measurement of MWIs derived from LV pressure and strain by echocardiography. (A) Bullseye diagram of GLS calculated at – 21.8%; (B) Bullseye diagram of GWE at a blood pressure of 146/99 mmHg; (C) LV pressure-strain loop; (D) Bar graph showing GCW and GWW and the resultant myocardial work indexes. |
Statistical Analysis
Continuous variables are presented as medians with upper and lower quartiles, interquartile ranges (IQRs) and means ± standard deviations (SDs). The Kruskal–Wallis H-test was used for comparisons between groups for continuous variables according to whether the distribution of the data was normal. Categorical variables are presented as frequencies (proportions) and were compared with the chi-square test. To further test the strength of the association of MW parameters with PP, multiple linear regression was performed, and confounding factors such as demographic characteristics and clinical indicators were identified from the baseline variables. All statistical analyses were performed with SPSS 25 (IBM, Armonk, New York, NY, USA). For all comparisons, the level of statistical significance was set at two-sided p<0.05.
Results
General Characteristics of the Participants
The study recruited 204 participants with normotension, prehypertension and newly diagnosed hypertension. The participants were divided into three groups according to the tertiles of PP: Group I, PP≤44 mmHg (n=67); Group II, 44<PP≤52 mmHg (n=68); and Group III PP>52 mmHg (n=69), respectively. Table 1 shows the overall baseline clinical and echocardiography data for the three groups. In Group II and Group III, the proportion of males was higher than that in Group I (median 46 vs 30 (P=0.002)). The same pattern was observed for the age range (median 50 vs 47, P=0.001). Significant differences in classification and indexes of BP, including SBP, DBP and PP (all P<0.001), were observed among the three groups. The number of patients with hypertension and LVH was also higher in Group III (both P<0.001). No significant differences in other echocardiographic indexes of left ventricular systolic function, including HR, FS, LVEF, CI, SI and E velocity, were detected among the three groups, while the diastolic parameters E/e’ ratio and e’ velocity were different among the three groups (both P<0.001). With increasing PP, the three indexes of MW, namely, GWI, GCW and GWW, increased, and the differences among the three groups were significant (P<0.001).
 |
Table 1 Comparison of Clinical and Echocardiographic Data According to the Tertiles of PP |
Spearman Correlation Analysis of MWIs
Univariate relations for four indexes of MW and other clinical and echocardiographic parameters were performed by Spearman correlation analysis. The results are shown in Table 2. We found that PP was positively related to GWI (r=0.540, P<0.001), GCW (r=0.626, P<0.001) and GWW (r=0.408, P<0.001). In addition, GWE (r=−0.310, P<0.001) was negatively correlated with PP. The trends of DBP, hypertension, LVH, IVST, PWT, E/e’ ratio, LVMI and GLS were identical to those of PP and strongly related to the four indexes of MW. The LVEDD was correlated with only GCW among the MWIs (r=0.181, P=0.010). SI, LAVI and PSD were partially associated with the four MW indexes.
 |
Table 2 Correlation Coefficients (Spearman’s Rho) for MWIs and Major Clinical Data and Echocardiographic Indexes |
Multiple Linear Regression Demonstrating the Relationship Between PP and MWIs
Using univariate linear regression analyses, Figure 3 illustrates the unadjusted associations between PP and MWIs. The GWI, GCW, and GWW exhibited an upward trend, and GWE displayed a downward trend as PP increased. The scatter plots showed that PP was widely associated with GWI (R=0.564, P<0.001), GWE (R=0.336, P<0.001), GCW (R=0.651, P<0.001) and GWW (R=0.447, P<0.001).
 |
Figure 3 Correlation of PP with MWIs. (A) Correlation between global work index (mmHg%) and pulse pressure (mmHg). (B) Correlation between global work efficiency (%) and pulse pressure (mmHg). (C) Correlation between global constructed work (mmHg%) and pulse pressure (mmHg). (D) Correlation between global wasted work (mmHg%) and pulse pressure (mmHg). |
To identify factors that are independently related to MWIs, given that many parameters influence MWIs, more variables for correction and analysis were included (Table 3). In model 1, after adjusting for age, sex and BMI, PP had a strong correlation with the four indexes of MW (all P<0.001). The same correlations were strong and significant after adjusting for DBP, hypertension and LVH in model 2 (all P<0.005). PP had a significant association with the four indexes of MW after adjustment for LVEDD, IVST and SV in model 3 (all P<0.001). After adjusting for E/e’, LVMI, LAVI and GLS, PP was still significantly correlated with the four indexes of MW, which indicated that PP was an independent predictor for GWI, GWE, GCW and GWW. Finally, we looked further into the relationship between PP and the effect of the three groups on MWIs, and the results showed that the highest value of PP in Group III corresponded most strongly to the four indexes of MW (Supplementary Table 1).
 |
Table 3 Multiple Linear Regression of the Potential Association of PP with MWIs |
Discussion
In a population of 204 participants including normotensive, prehypertensive and newly diagnosed hypertensive individuals, we found that the four MW indexes varied with increasing PP and demonstrated a close association between PP and MWIs. After adjusting for potential confounders, including age, sex, BMI, hypertension, LVH, LVMI, E/e’ ratio and GLS, elevated PP and MWIs remained independently associated. The higher the value of PP was, the stronger the correlation between PP and MWIs (Supplementary Table 1).
PP is associated with myocardial function. Our results showed that the MWIs were related to the PP increase and LV diastolic function, which in turn affected the MWIs. Lembo et al used global longitudinal strain (GLS) measured by speckle tracking to reflect left ventricular systolic function and reported that GLS was related to PP in normotensive and untreated hypertensive individuals.14 This result was partially consistent with our findings. As indexes of MW, GLS and MWIs might both be linked to PP. Generally, MW and GLS show similar trends, as they are based on the same speckle-tracking algorithm, and MW was computed by brachial artery blood pressure for GLS analysis.22 Therefore, MWIs increase in hypertensive states because higher blood pressure leads to an increased afterload. When GLS improves, MW also improves.23 In our study, we observed no significant change in GLS among the three groups, which suggested that the MWI values were defined by blood pressure instead of GLS, and the clear correlations detected between the MWIs and both PP and DBP supported this conclusion.
The change in MWIs may be related to an increase in PP induced by increased blood pressure. This study included normotensive, prehypertensive and hypertensive individuals. Participants were grouped according to PP based on tertile distributions, and PP gradually increased with the gradual increase in SBP from Groups I to III. Hypertension accounted for 32.8% of patients in Group I and 39% of patients in Group II, and 21.8% of patients in Group III did not have hypertension. The PP value was mainly derived from SBP variation, and PP was linearly correlated with MWIs, suggesting that an elevated value of BP along affected MW rather than the classification of BP.
Increasing PP is generally regarded as a raw indicator of arterial stiffness and cardiovascular risk factors,24 as it reflects problems in distending conduit arteries and the loss of arterial elasticity.25,26 Studies have shown an association of PP and arterial stiffness with LV diastolic dysfunction and a relationship between PP and the E/e’ ratio in hypertensive patients.27–29 In our study, a PP increase was an independent predictor of four indexes of MW after adjusting for confounders, which suggested that arterial stiffness may influence MW in the early stage of hypertension. There were some explanations for the MWI values being closely associated with LV diastolic dysfunction. Arterial stiffness and increased PP are clearly associated with ventricular stiffness.30,31 Arterial stiffness and increased PP may contribute to cardiac structural changes, possibly by increasing pulsatile load and the workload on the heart.32,33 PP is regarded as a factor that mediates arterial stiffness worsening, which contributes to abnormal MWI values.
The change in PP and MWI values may indicate an early change and remodeling, which has a prognostic role in hypertensive patients.34,35 More attention was focused on cardiac structure and systolic function, rather than diastolic dysfunction, when hypertensive patients underwent echocardiography. However, diastolic deficiency develops much earlier than systolic dysfunction.36 Vascular stiffness may prolong the cardiac preload increase. Then, pressure overload will inevitably affect cardiac diastolic function. PP was found to be altered when LV diastolic function deteriorated, and other parameters of LV systolic function remained normal in the individuals in our study. Given the strong correlation between PP and diastolic function, the increased PP might reflect early impairment of cardiac function in hypertensive populations.
There were several limitations of this study. First, the sample size was relatively small, and the participants were from a single center. Second, we included a population with newly diagnosed hypertension whose blood pressure did not meet the target blood pressure. It cannot be ruled out that this effect may disappear once the blood pressure is controlled well. Third, there are no well-established cutoff values for MWIs, and quantification of the relationship between PP and MWIs is challenging.
Conclusion
In conclusion, our study confirmed that PP was related to the four indexes of MW. This association was independent of the major confounders, including age, sex, BMI, hypertension, LVH, and left ventricular systolic and diastolic parameters. Participants with high PP could be recognized as individuals at high risk for a subsequent decline in diastolic heart function. The evaluation of PP and MWIs might be valuable for identifying very early diastolic impairment of the heart.
Data Sharing Statement
The datasets are not publicly available due to the privacy policy. The data that support the findings of this study are available from the corresponding author upon reasonable request.
Author Contributions
All authors made a significant contribution to the work reported, whether that is in the conception, study design, execution, acquisition of data, analysis and interpretation, or in all these areas; took part in drafting, revising or critically reviewing the article; gave final approval of the version to be published; have agreed on the journal to which the article has been submitted; and agree to be accountable for all aspects of the work. The authors take responsibility for all aspects of the reliability and freedom from bias of the data presented and their discussed interpretation.
Funding
This work was supported by study and popularization of the corrected method of echocardiography to measure pulmonary artery pressure (No.2-01-01-02-2020MSXM083) and application of soluble ST2 in chronic disease management and cardiac rehabilitation of elderly patients with heart failure (No.2019ZLXM003).
Disclosure
The authors have no conflicts of interest to disclose.
References
1. Tozawa M, Iseki K, Iseki C, Takishita S. Pulse pressure and risk of total mortality and cardiovascular events in patients on chronic hemodialysis. Kidney Int. 2002;61(2):717–726. doi:10.1046/j.1523-1755.2002.00173.x
2. Vaccarino V, Berger AK, Abramson J, et al. Pulse pressure and risk of cardiovascular events in the systolic hypertension in the elderly program. Am J Cardiol. 2001;88(9):980–986. doi:10.1016/S0002-9149(01)01974-9
3. Chugh A, Bakris GL. Pulse pressure and arterial stiffness: an emerging renal risk predictor? J Hypertens. 2007;25(9):1796–1797. doi:10.1097/HJH.0b013e32828cc8dd
4. Safar ME. Systolic blood pressure, pulse pressure and arterial stiffness as cardiovascular risk factors. Curr Opin Nephrol Hypertens. 2001;10(2):257–261. doi:10.1097/00041552-200103000-00015
5. Selvaraj S, Steg P, Elbez Y, et al. Pulse pressure and risk for cardiovascular events in patients with atherothrombosis. J Am Coll Cardiol. 2016;67(4):392–403. doi:10.1016/j.jacc.2015.10.084
6. Franklin SS, Khan SA, Wong ND, Larson MG, Levy D. Is pulse pressure useful in predicting risk for coronary heart disease?: The Framingham Heart Study. Circulation. 1999;100(4):354–360. doi:10.1161/01.CIR.100.4.354
7. Mosley WJ, Greenland P, Garside DB, Lloyd-Jones DM. Predictive utility of pulse pressure and other blood pressure measures for cardiovascular outcomes. Hypertension. 2007;49(6):1256–1264. doi:10.1161/HYPERTENSIONAHA.106.083592
8. Vaccarino V, Holford TR, Krumholz HM. Pulse pressure and risk for myocardial infarction and heart failure in the elderly. J Am Coll Cardiol. 2000;36(1):130–138. doi:10.1016/S0735-1097(00)00687-2
9. Viazzi F. Pulse pressure and subclinical cardiovascular damage in primary hypertension. Nephrol Dial Transplant. 2002;17(10):1779–1785. doi:10.1093/ndt/17.10.1779
10. Avolio AP, Kuznetsova T, Heyndrickx GR, Kerkhof PLM, Li JKJ. Arterial flow, pulse pressure and pulse wave velocity in men and women at various ages. In: Kerkhof PLM, Miller VM, editors. Sex-Specific Analysis of Cardiovascular Function. Advances in Experimental Medicine and Biology. Vol. 1065. Springer International Publishing; 2018:153–168. doi:10.1007/978-3-319-77932-4_10
11. Dart AM, Kingwell BA. Pulse pressure—a review of mechanisms and clinical relevance. J Am Coll Cardiol. 2001;37(4):975–984. doi:10.1016/S0735-1097(01)01108-1
12. Papadopoulos K, Özden Tok Ö, Mitrousi K, Ikonomidis I. Myocardial work: methodology and clinical applications. Diagnostics. 2021;11(3):573. doi:10.3390/diagnostics11030573
13. Pugliese NR, Mazzola M, Fabiani I, et al. Haemodynamic and metabolic phenotyping of hypertensive patients with and without heart failure by combining cardiopulmonary and echocardiographic stress test. Eur J Heart Fail. 2020;22(3):458–468. doi:10.1002/ejhf.1739
14. Lembo M, Esposito R, Lo Iudice F, et al. Impact of pulse pressure on left ventricular global longitudinal strain in normotensive and newly diagnosed, untreated hypertensive patients. J Hypertens. 2016;34(6):1201–1207. doi:10.1097/HJH.0000000000000906
15. Stanton T, Leano R, Marwick TH. Prediction of all-cause mortality from global longitudinal speckle strain: comparison with ejection fraction and wall motion scoring. Circ Cardiovasc Imaging. 2009;2(5):356–364. doi:10.1161/CIRCIMAGING.109.862334
16. Boe E, Skulstad H, Smiseth OA. Myocardial work by echocardiography: a novel method ready for clinical testing. Eur Heart J Cardiovasc Imaging. 2019;20(1):18–20. doi:10.1093/ehjci/jey156
17. Yingchoncharoen T, Agarwal S, Popović ZB, Marwick TH. Normal ranges of left ventricular strain: a meta-analysis. J Am Soc Echocardiogr. 2013;26(2):185–191. doi:10.1016/j.echo.2012.10.008
18. Joint Committee for Guideline Revision. 2018 Chinese guidelines for prevention and treatment of hypertension-a report of the revision committee of Chinese guidelines for prevention and treatment of hypertension. J Geriatr Cardiol. 2019;16(3):182–241. doi:10.11909/j.issn.1671-5411.2019.03.014
19. Lang RM, Badano LP, Mor-Avi V, et al. Recommendations for cardiac chamber quantification by echocardiography in adults: an update from the American society of echocardiography and the European association of cardiovascular imaging. J Am Soc Echocardiogr. 2015;28(1):1–39.e14. doi:10.1016/j.echo.2014.10.003
20. Nagueh SF, Smiseth OA, Appleton CP, et al. Recommendations for the evaluation of left ventricular diastolic function by echocardiography: an update from the American society of echocardiography and the European association of cardiovascular imaging. J Am Soc Echocardiogr. 2016;29(4):277–314. doi:10.1016/j.echo.2016.01.011
21. Li Q, Wang H, Feng H, et al. Afterload-related reference values for myocardial work indices. Cardiovasc Ultrasound. 2021;19(1):24. doi:10.1186/s12947-021-00253-2
22. Jain R, Bajwa T, Roemer S, et al. Myocardial work assessment in severe aortic stenosis undergoing transcatheter aortic valve replacement. Eur Heart J Cardiovasc Imaging. 2021;22(6):715–721. doi:10.1093/ehjci/jeaa257
23. Chan J, Edwards NFA, Khandheria BK, et al. A new approach to assess myocardial work by non-invasive left ventricular pressure–strain relations in hypertension and dilated cardiomyopathy. Eur Heart J Cardiovasc Imaging. 2019;20(1):31–39. doi:10.1093/ehjci/jey131
24. Laurent S, Boutouyrie P, Asmar R, et al. Aortic stiffness is an independent predictor of all-cause and cardiovascular mortality in hypertensive patients. Hypertension. 2001;37(5):1236–1241. doi:10.1161/01.HYP.37.5.1236
25. Safar ME. Arterial stiffness as a risk factor for clinical hypertension. Nat Rev Cardiol. 2018;15(2):97–105. doi:10.1038/nrcardio.2017.155
26. Mancusi C, Losi MA, Izzo R, et al. Higher pulse pressure and risk for cardiovascular events in patients with essential hypertension: the Campania Salute Network. Eur J Prev Cardiolog. 2018;25(3):235–243. doi:10.1177/2047487317747498
27. Jaroch J, Łoboz Grudzień K, Bociąga Z, et al. The relationship of carotid arterial stiffness to left ventricular diastolic dysfunction in untreated hypertension. Kardiol Pol. 2012;70(3):223–231.
28. Mizuguchi Y, Oishi Y, Tanaka H, et al. Arterial stiffness is associated with left ventricular diastolic function in patients with cardiovascular risk factors: early detection with the use of cardio-ankle vascular index and ultrasonic strain imaging. J Card Fail. 2007;13(9):744–751. doi:10.1016/j.cardfail.2007.05.010
29. Mottram PM. Relation of arterial stiffness to diastolic dysfunction in hypertensive heart disease. Heart. 2005;91(12):1551–1556. doi:10.1136/hrt.2004.046805
30. Puntmann VO, Arroyo Ucar E, Hinojar Baydes R, et al. Aortic stiffness and interstitial myocardial fibrosis by native T1 are independently associated with left ventricular remodeling in patients with dilated cardiomyopathy. Hypertension. 2014;64(4):762–768. doi:10.1161/HYPERTENSIONAHA.114.03928
31. Verger A, van der Gucht A, Guedj E, et al. Central pulse pressure is a determinant of heart and brain remodeling in the elderly: a quantitative MRI and PET pilot study. J Hypertens. 2015;33(7):1378–1385. doi:10.1097/HJH.0000000000000566
32. von Kleeck R, Roberts E, Castagnino P, et al. Arterial stiffness and cardiac dysfunction in Hutchinson–Gilford Progeria Syndrome corrected by inhibition of lysyl oxidase. Life Sci Alliance. 2021;4(5):e202000997. doi:10.26508/lsa.202000997
33. Boutouyrie P, Laurent S, Girerd X, et al. Common carotid artery stiffness and patterns of left ventricular hypertrophy in hypertensive patients. Hypertension. 1995;25(4 Pt 1):651–659. doi:10.1161/01.hyp.25.4.651
34. Fabiani I, Pugliese NR, La Carrubba S, et al. Incremental prognostic value of a complex left ventricular remodeling classification in asymptomatic for heart failure hypertensive patients. J Am Soc Hypertens. 2017;11(7):412–419. doi:10.1016/j.jash.2017.05.005
35. Pugliese NR, Fabiani I, La Carrubba S, et al. Classification and prognostic evaluation of left ventricular remodeling in patients with asymptomatic heart failure. Am J Cardiol. 2017;119(1):71–77. doi:10.1016/j.amjcard.2016.09.018
36. Russo C, Jin Z, Homma S, et al. Effect of diabetes and hypertension on left ventricular diastolic function in a high-risk population without evidence of heart disease. Eur J Heart Fail. 2010;12(5):454–461. doi:10.1093/eurjhf/hfq022
 © 2022 The Author(s). This work is published and licensed by Dove Medical Press Limited. The full terms of this license are available at https://www.dovepress.com/terms.php and incorporate the Creative Commons Attribution - Non Commercial (unported, v3.0) License.
By accessing the work you hereby accept the Terms. Non-commercial uses of the work are permitted without any further permission from Dove Medical Press Limited, provided the work is properly attributed. For permission for commercial use of this work, please see paragraphs 4.2 and 5 of our Terms.
© 2022 The Author(s). This work is published and licensed by Dove Medical Press Limited. The full terms of this license are available at https://www.dovepress.com/terms.php and incorporate the Creative Commons Attribution - Non Commercial (unported, v3.0) License.
By accessing the work you hereby accept the Terms. Non-commercial uses of the work are permitted without any further permission from Dove Medical Press Limited, provided the work is properly attributed. For permission for commercial use of this work, please see paragraphs 4.2 and 5 of our Terms.