Back to Journals » Clinical Ophthalmology » Volume 19
Evaluating Corneal Optical Density and Subbasal Nerve Fiber Metrics in Myopic Patients
Authors Wei Q, Ding X, Jiang R ![]() , Niu L
, Niu L ![]() , Yu Z
, Yu Z ![]()
Received 29 June 2025
Accepted for publication 6 October 2025
Published 13 October 2025 Volume 2025:19 Pages 3761—3771
DOI https://doi.org/10.2147/OPTH.S550446
Checked for plagiarism Yes
Review by Single anonymous peer review
Peer reviewer comments 4
Editor who approved publication: Dr Scott Fraser
Qiaoling Wei,1– 3,* Xuan Ding,1,2,* Rui Jiang,1– 3 Lingling Niu,1,2 Zhiqiang Yu1,2
1Eye Institute and Department of Ophthalmology, Eye & ENT Hospital, Fudan University, Shanghai, 200031, People’s Republic of China; 2Shanghai Key Laboratory of Visual Impairment and Restoration, Fudan University, Shanghai, 200031, People’s Republic of China; 3Ocular Trauma Center, Eye & ENT Hospital, Fudan University, Shanghai, 200031, People’s Republic of China
*These authors contributed equally to this work
Correspondence: Lingling Niu, Email [email protected] Zhiqiang Yu, Email [email protected]
Aim: To assess corneal metrics in myopic patients and investigate the relationship between myopia severity and corneal characteristics.
Methods: Consecutive myopic patients undergoing preoperative evaluations for refractive surgery were enrolled. Comprehensive clinical data, including age, gender, axial length (AL), and spherical equivalent refraction (SER) were collected. All enrolled patients completed the ocular surface disease index (OSDI) questionnaire. Myopia severity was categorized based on SER and AL. Detailed corneal optical density (COD) was measured using Pentacam HR imaging. In vivo confocal microscopy (IVCM) was performed to measure central corneal sub-basal nerve plexus (SNP) and dendritiform cell (DC) density. Correlations among metrics were analyzed, and differences across various levels of myopia severity were assessed.
Results: The study included 157 participants (308 eyes), predominantly female (118 females, 39 males), with a mean age of 28.0 ± 6.64 years (range 17– 52). The mean SER was − 6.85 ± 3.0 D (range − 18.00 to − 0.50 D), and the mean AL was 26.32 ± 1.4 mm (range 22.92– 30.42 mm). OSDI showed a positive correlation with corneal nerve branch density (CNBD). Age correlated significantly with COD in the 6– 10 mm zones of the anterior, middle, posterior and total layers (all P < 0.05), as well as in the 10– 12 mm zones of the middle (P = 0.020) and total layers (P = 0.023), but showed no impact on SNP metrics. DC density exhibited a correlation with SNP metrics. Central COD (0– 6 mm zone) increased with myopia severity, showing a negative correlation with SER and positive correlations with AL, with significant changes observed in the middle, posterior, and total corneal layers. No significant effects of myopia severity were observed on SNP metrics.
Conclusion: This study highlights complex relationships between corneal metrics in myopic patients. COD values in the central 0– 6 mm zone increased with higher myopia severity, while no significant relationships were found with SNP metrics.
Keywords: myopia, corneal optical density, sub-basal nerve plexus, dendritiform cell, confocal microscopy, refractive surgery, myopia correction
Introduction
Refractive surgeries (RS) for myopia are increasingly popular among patients seeking to reduce dependence on corrective lenses, enhance visual acuity, and improve quality of life. These procedures have evolved significantly, transitioning from early techniques such as Radial Keratotomy (RK) and Laser-Assisted Sub-Epithelial Keratectomy (LASEK) to contemporary methods like Laser-Assisted in Situ Keratomileusis (LASIK) and Small Incision Lenticule Extraction (SMILE). Such advancements effectively address a broad spectrum of ocular conditions and cater to the diverse needs of patients, offering tailored solutions that significantly enhance visual outcomes and patient satisfaction.1,2
As surgical options expand, ensuring safety, efficacy, and long-term satisfaction has become essential. Careful postoperative evaluation is particularly important to capture both structural and functional changes. Corneal optical density (COD), measured using Pentacam HR imaging, assesses the clarity and quality of the corneal tissue. Monitoring changes in COD allows clinicians to evaluate potential impacts on visual acuity and adjust treatment plans accordingly.3,4 The subjective experiences of patients, particularly symptoms like mild dryness post-surgery—a common initial indicator of dry eye syndrome—are increasingly recognized for their significant impact on postoperative satisfaction and visual function stability. These symptoms can escalate to more severe conditions such as burning, aching, and tenderness, indicative of ocular pain.5,6 Such developments highlight the importance of closely monitoring corneal neuropathy and central sensitivity, which are pivotal in managing prolonged ocular discomfort. Furthermore, the integrity of corneal nerve fibers, potentially compromised during surgery, is crucial for assessing the extent of surgical trauma and subsequent recovery.6 A comprehensive evaluation of both COD and corneal nerve health post-surgery is essential for providing a detailed overview of the surgical impact and for comparing the efficacy of different refractive surgery techniques.7,8
The application of Pentacam HR Imaging and in vivo confocal microscopy (IVCM) has grown significantly for the rapid, noninvasive clinical assessment of the cornea. These technologies are extensively utilized in clinical studies to describe corneal microstructures in both healthy and pathological states, addressing conditions such as diabetes, keratoconus, Fuchs endothelial dystrophy, and keratitis, and for investigating corneal changes pre- and post-refractive surgeries.7–17 Despite their extensive use, studies with adequately sized cohorts focusing on the baseline values of patients seeking refractive surgeries remain limited. By clarifying how myopia severity influences corneal characteristics, this work provides clinically relevant reference values that may enhance the accuracy of preoperative evaluations in refractive surgery candidates.
Method
Study Population
This retrospective analysis included 157 consecutive myopic patients who underwent RS for myopia correction at The Eye & ENT Hospital of Fudan University from September 2019 to June 2024. All participants provided informed consent, and the study complied with the Declaration of Helsinki, with ethical approval obtained from the institutional review board (No. 2023-YS-016). Eligibility criteria included an age range of 17 to 52 years and no prior corneal surgery, ocular trauma, significant corneal opacities, or contact lens use within one month. Exclusion criteria included prior vitrectomy or other ophthalmic interventions, use of medications such as antidepressants, poor IVCM image quality, pre-existing corneal disease, or systemic conditions known to affect sub-basal nerve plexus (SNP) integrity (eg, diabetes mellitus, multiple sclerosis).
Comprehensive Evaluation of Corneal Metrics in Myopic Patients
All participants underwent a comprehensive preoperative assessment, which included collecting clinical data on age, gender, axial length (AL; measured using the IOL Master, Carl Zeiss Meditec AG, Jena, Germany), spherical equivalent refraction (SER), and best-corrected visual acuity (BCVA). Non-contact intraocular pressure (NCT) was measured using the Canon Full Auto Tonometer TX-F. Pentacam HR (Oculus GmbH, Wetzlar, Germany) provided anterior and posterior corneal morphology as well as corneal optical density (COD). The measurements included anterior keratometry (K1 F, K2 F), which represents the flattest and steepest meridians of the anterior corneal surface, and posterior keratometry (K1 B, K2 B), representing the same parameters for the posterior surface. Axis measurements (Axis F and Axis B) determined the orientation of astigmatism for both anterior and posterior surfaces, while astigmatism values (Astig F and Astig B) indicated the curvature difference between the steepest and flattest meridians. Asphericity indices (Asph. Q F and Asph. Q B) quantified deviations from a perfect sphere, providing insight into how corneal shape impacts visual quality. Additional metrics included central corneal thickness (CCT), central corneal volume (CCV) within a 10 mm diameter, and posterior corneal elevations measured at the thinnest point (PTE), maximum elevation point (PME), and central point (PCE). COD was recorded for anterior (ACOD), middle (MCOD), posterior (PCOD), and total layers across multiple zones: 0–2 mm, 2–6 mm, 6–10 mm, 10–12 mm, and overall. A schematic of these zones is provided in Figure 1. All Pentacam examinations were performed by a single experienced examiner, with only images rated “OK” in quality included for analysis.
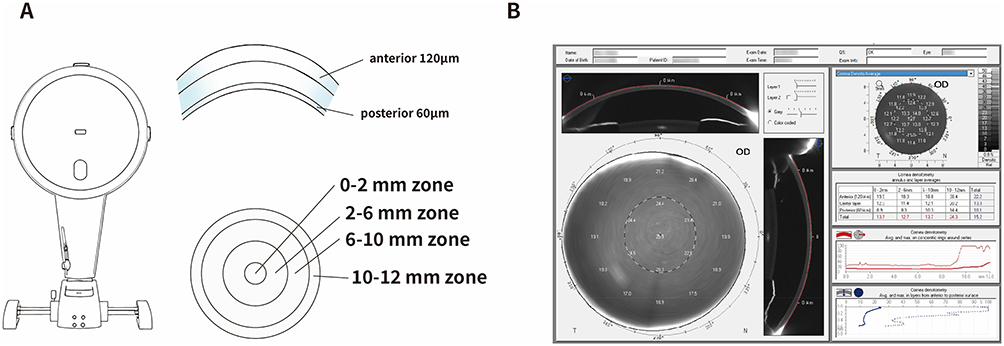 |
Figure 1 Measurement of corneal optical density (COD). (A) Schematic illustration of the Pentacam Scheimpflug imaging system and the corneal measurement zones. COD was quantified in three corneal layers: anterior (120 μm), middle, and posterior (60 μm). Each layer was divided into four concentric zones: 0–2 mm, 2–6 mm, 6–10 mm, and 10–12 mm, centered on the corneal apex. (B) Representative Pentacam output showing COD distribution maps and corresponding numeric values for each layer and zone. COD values were automatically generated in grayscale units (GSU), with higher values indicating greater optical density. |
Stratification of Patients Based on Spherical Equivalent Refraction and Axial Length
Participants were stratified by SER and AL. Myopia was classified as low (LM, −0.50 to −3.00 D), moderate (MM, > −3.00 to −6.00 D), high (HM, > −6.00 to −10.00 D), and extreme (EHM, < −10.00 D). Based on AL, groups were defined as normal (NAL, 22–24 mm), mildly elongated (MEAL, > 24–26 mm), elongated (EAL, > 26–28 mm), and extremely elongated (XEAL, > 28 mm).
Assessment of Ocular Surface Symptoms
To assess the relationship between ocular symptoms and corneal SNP and dendritiform cell (DC) densities, enrolled patients completed the Ocular Surface Disease Index (OSDI) questionnaire. The OSDI is a standardized tool used to quantify the severity of ocular discomfort, with higher scores indicating greater symptom severity, facilitating effective correlation between patient-reported symptoms and clinical findings.18 This 12-item instrument rates frequency of symptoms from 0 (none) to 4 (all of the time). The summed score (maximum 48) was normalized to a 0–100 scale, categorized as normal (0–12), mild (13–22), moderate (23–32), or severe (33–100). Higher scores indicated greater discomfort.
Confocal Microscopy and Image Analysis Techniques
IVCM was performed with the Heidelberg Retina Tomograph III (HRT; Heidelberg Engineering, Germany), targeting the central corneal SNP according to standardized protocols.19 An experienced technician (Q. Wei) conducted all scans, and two independent reviewers (Z.Q Yu and D. Xuan) selected three high-quality, non-overlapping images per participant.
DC density was quantified using the built-in cell count feature of the Heidelberg Retina Tomograph software. Further image analysis was conducted using ACCMetrics software V.2 (MA Dabbah, Imaging Science and Biomedical Engineering, Manchester, UK),20 which enabled automated computation of multiple nerve-related metrics. These metrics included corneal nerve fiber density (CNFD), reflecting the number of nerves per square millimeter; corneal nerve branch density (CNBD), indicating branch points per square millimeter; corneal nerve fiber length (CNFL), representing the total length of nerve fibers per square millimeter; total branch density (CTBD), counting all nerve branches; nerve fiber area (CNFA), assessing the area occupied by nerves; nerve fiber width (CNFW), measuring the average width of fibers; and nerve fractal dimension (CNFrD), which evaluates the geometric complexity of nerve distribution. The average values of these parameters were calculated from the three selected images.
To ensure true central SNP acquisition, two strategies were applied: (1) patients maintained steady fixation on an indicator light with the fellow eye, aided by verbal feedback and examiner monitoring; (2) only images showing bright, vertically oriented linear structures in a radial pattern toward the apex were accepted.
Statistical Analysis
Statistical analyses were conducted using SPSS software (version 23.0, SPSS Inc., Chicago, IL, USA). Continuous variables are presented as means ± standard deviations. Gender-based differences in ocular metrics were assessed using independent-sample t-tests, with statistical significance set at p < 0.05. Pearson’s correlation analysis was employed to explore relationships between patient age, ocular biometric parameters, and corneal SNP metrics. For variables potentially influenced by confounding factors, multiple linear regression was performed to control for these effects. Differences among myopia severity groups were evaluated using one-way analysis of variance (ANOVA), followed by Tukey’s HSD post hoc test. Statistical significance was defined as p < 0.05.
Patient and Public Involvement Statement
Patients and the public were not involved in the design and conduct of this study.
Results
Demographic and Clinical Characteristics of the Study Cohort
Comprehensive demographic and clinical data are summarized in Table 1. A total of 157 participants (308 eyes) were included, with a predominance of female participants (118 females, 39 males). High-quality SNP images were unavailable for one eye in six individuals, leaving 308 eyes (154 left, 154 right) for analysis. The mean age of participants was 28.0 ± 6.64 years, distributed across four age groups: 17–19 years (n = 20), 20–29 years (n = 79), 30–39 years (n = 50), and 40–52 years (n = 8). Most subjects presented with moderate myopia (AL: 24–28 mm). Best-corrected visual acuity (BCVA) was nearly normal (mean logMAR 0.008). Intraocular pressure and central corneal thickness were within physiological ranges.
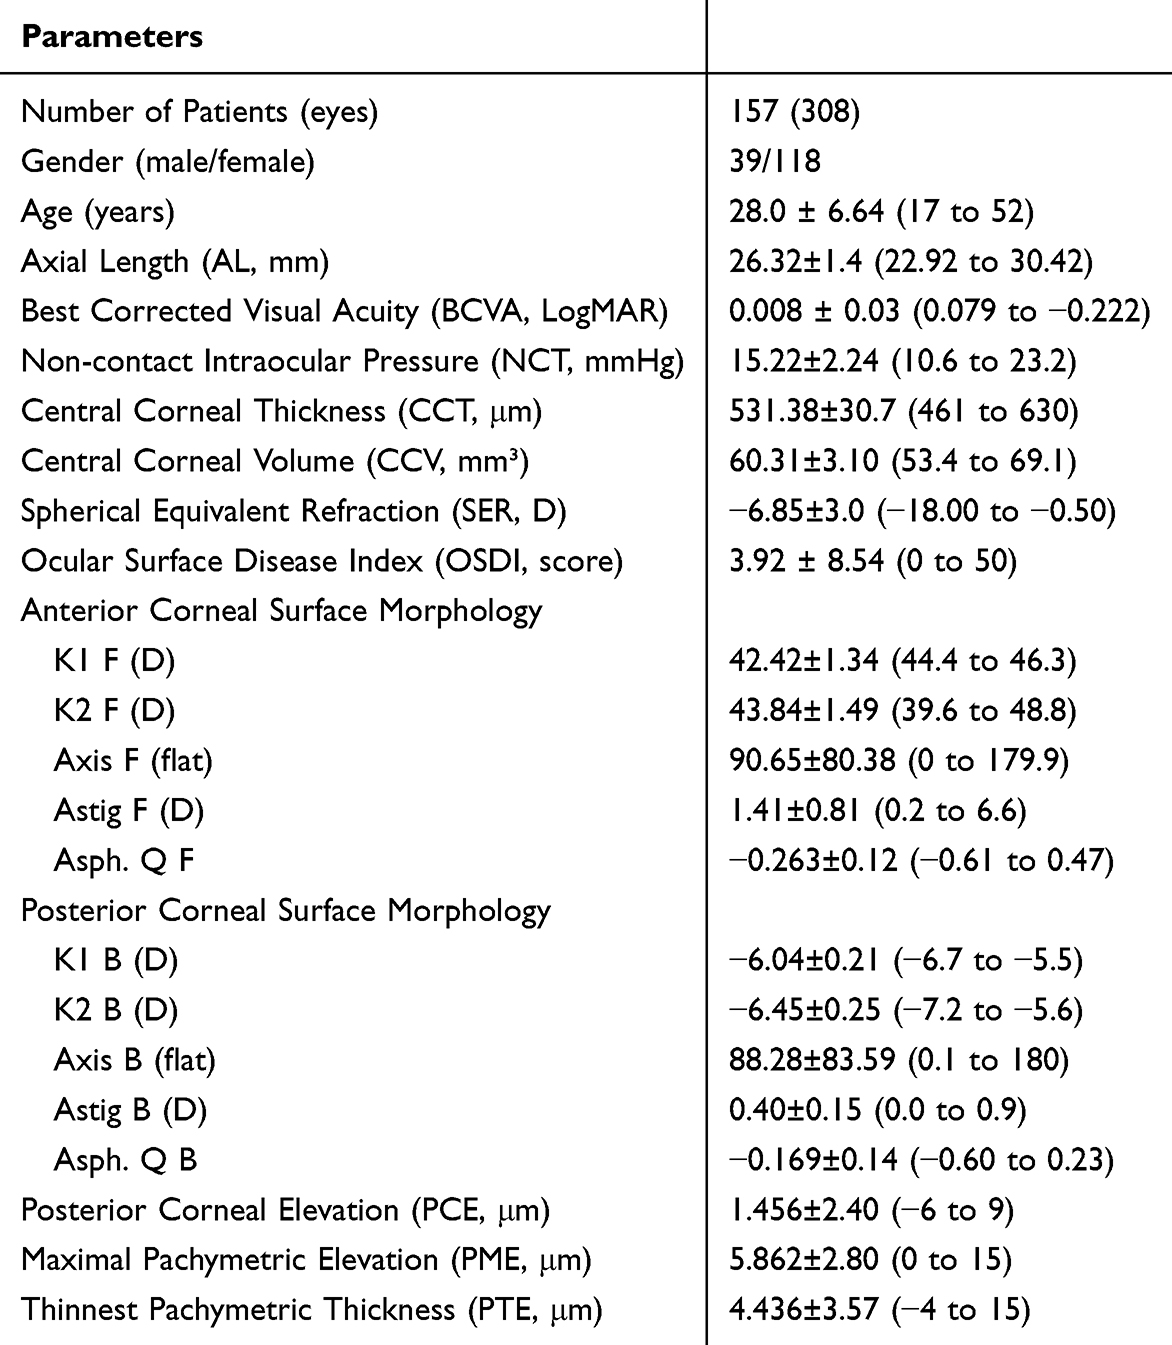 |
Table 1 Clinical and Demographic Profile of Myopia Surgery Patients |
Ocular discomfort was reported by 53 participants (33.76%), with an average OSDI score of 3.92 ± 8.54, ranging from 0 to 50. Based on OSDI severity classification, 142 patients were categorized as Normal, 6 as Mild, 6 as Moderate, and 3 as Severe. Additional ocular metrics, including SER, anterior and posterior corneal surface morphology, and pachymetric parameters, are detailed in Table 1. These measurements align with the typical profiles of patients preparing for myopia correction surgery.
Age- and Gender-Related Correlations in Ocular Metrics
To investigate the relationships between age, gender, and various clinical metrics, data from the right eye of each patient were selected for analysis. If right eye data were unavailable, left eye data were used, resulting in a dataset of 157 eyes from 157 patients for further analysis. Significant correlations were observed between age and multiple parameters, including the OSDI score (r = 0.167, P = 0.037), Asph.Q.F (r = 0.180, P = 0.036) and PME (r = −0.162, P = 0.047). Age was also significantly correlated with peripheral CODs, specifically with ACOD6-10 (r = 0.256, P = 0.002), MCOD6-10 (r = 0.408, P < 0.001), MCOD10-12 (r = 0.200, P = 0.018), total MCOD (r = 0.225, P = 0.008), PCOD6-10 (r = 0.273, P = 0.001), total COD6-10 (r = 0.318, P < 0.001), and total COD10-12 (r = 0.196, P = 0.021). However, age did not significantly affect SER, BCVA, NCT, AL, or CCT, nor was it associated with any of the seven SNP parameters analyzed.
Significant gender differences were also found in several metrics. On average, male participants were younger compared to female participants (25.49 ± 7.6 years vs 28.76 ± 6.2 years, P = 0.008). Additional differences were noted in AL (26.71 ± 1.64 mm vs 26.17 ± 1.27 mm, P = 0.020), CNFD (21.54 ± 7.32 fibers/mm² vs 24.63 ± 6.90 fibers/mm², P = 0.032), DC density (77.17 ± 71.73 /mm² vs 39.71 ± 60.13 /mm², P = 0.002), K1 F (41.76 ± 1.23 D vs 42.65 ± 1.30 D, P = 0.005) and K2 F (43.31 ± 1.50 D vs 44.01 ± 1.45 D, P = 0.047), and K1 B (−5.97 ± 0.19 D vs −6.09 ± 0.21 D, P = 0.005) and K2 B (−6.40 ± 0.22 D vs −6.49 ± 0.25 D, P = 0.047). Peripheral COD values, specifically MCOD10-12 (21.60 ± 4.34 GSUs vs 23.82 ± 5.54 GSUs, P = 0.037) and PCOD10-12 (15.95 ± 4.19 GSUs vs 17.82 ± 4.85 GSUs, P = 0.049), were significantly higher in females compared to males. This finding may be attributed to the younger age of the male participants, potentially impacting peripheral COD metrics. Detailed results on the correlations of age and gender with ocular metrics are provided in Supplementary Table 1.
Corneal Optical Density Findings and Its Correlations with Other Ocular Metrics
In this study, a total of 270 eyes underwent a comprehensive Pentacam examination, with average values reported in Table 2. Among 138 eyes from 138 patients undergoing Pentacam HR imaging, age- and gender-adjusted analyses revealed that COD was not significantly correlated with OSDI, BCVA, NCT, or any SNP metrics, except for CNFW and CNFrD. Additionally, COD showed no associations with DC density, Axis F, Axis B, Astig B, or PME. However, total COD demonstrated significant correlations with SER (r = −0.19, P = 0.023) and myopia severity (SER severity, r = 0.18, P = 0.039), particularly within the 0–6 mm zone, as shown in Supplementary Table 2. Total COD within this zone was also positively correlated with AL. Layer- and zone-specific analyses revealed significant correlations between SER, myopia severity, AL, and ACOD and MCOD within the 0–6 mm zone, as well as PCOD within 0–10 mm zone (Supplementary Table 2). In the 10–12 mm zone, CODs showed a positive correlation with K1 F, K2 F and a negative correlation with K1 B, K2 B. Furthermore, CODs in the anterior and middle layers were associated with Astig F, Asph.Q.F and Asph.Q, and PCE (Supplementary Table 2).
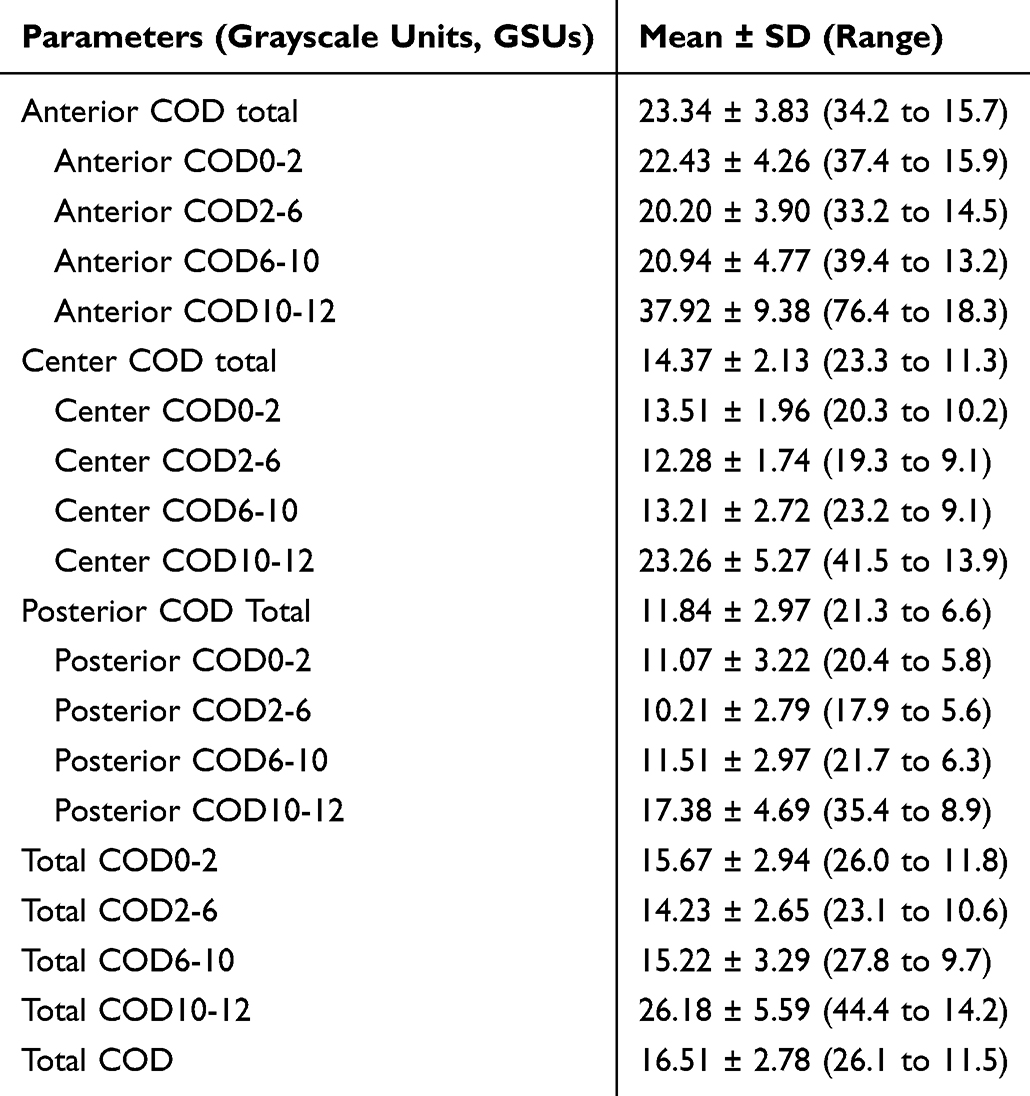 |
Table 2 Corneal Optical Density Values in the Study Population |
IVCM Findings in the Study Cohort
In our analysis of all 308 enrolled eyes using IVCM, the mean values for various SNP metrics were as follows: CNFD at 23.86 ± 7.16 nerves/mm², CNBD at 24.48 ± 14.67 branches/mm², CNFL at 14.60 ± 3.3 mm/mm², CTBD at 37.19 ± 16.9 branches/mm², CNFA at 0.006 ± 0.002 mm²/mm², CNFW at 0.021 ± 0.001 mm, and CNFrD at 1.472 ± 0.04. In the subset of 157 eyes selected for correlation analysis, DC density demonstrated negative correlations with CNFD (r = −0.338, P < 0.001), CNBD (r = −0.27, P =0.001), and CNFL (r = −0.264, P = 0.001), but positive correlations with CNFA (r = 0.205, P = 0.01) and CNFW (r = 0.221, P = 0.006).
Although age did not significantly impact the SNP metrics, gender differences were apparent. Male participants had a significantly lower CNFD than female participants (21.58 ± 5.91 vs 24.68 ± 5.79 nerves/mm², P = 0.032). Additionally, CNBD was positively correlated with OSDI (r = 0.21, P = 0.008), while CCT was negatively correlated with CNBD (r = −0.162, P = 0.043) but positively correlated with CNFW (r = 0.178, P = 0.026). No significant correlations were found between CCV and these metrics. Regarding correlations between COD and SNPs, CNFW showed a negative association with anterior COD in the 6–10 mm zone (ACOD6-10, r = −0.192, P = 0.024) and total COD in the 6–10 mm zone (total COD6-10, r = −0.174, P = 0.041). Additionally, all posterior COD metrics, including PCOD0-2 (r = 0.209, P = 0.014), PCOD2-6 (r = 0.213, P = 0.012), PCOD6-10 (r = 0.175, P = 0.040), and total PCOD (r = 0.298, P = 0.020), were positively correlated with CNFrD. No significant correlations were observed between SNP metrics and other clinical parameters, including age, SER, AL, SER severity, AL severity, BCVA, NCT, K1 F, K2 F, K1 B, K2 B, Axis F, Axis B, Astig F, Astig B, Asph.Q.F, Asph.Q.B, PCE, PME, or PTE (Table 3).
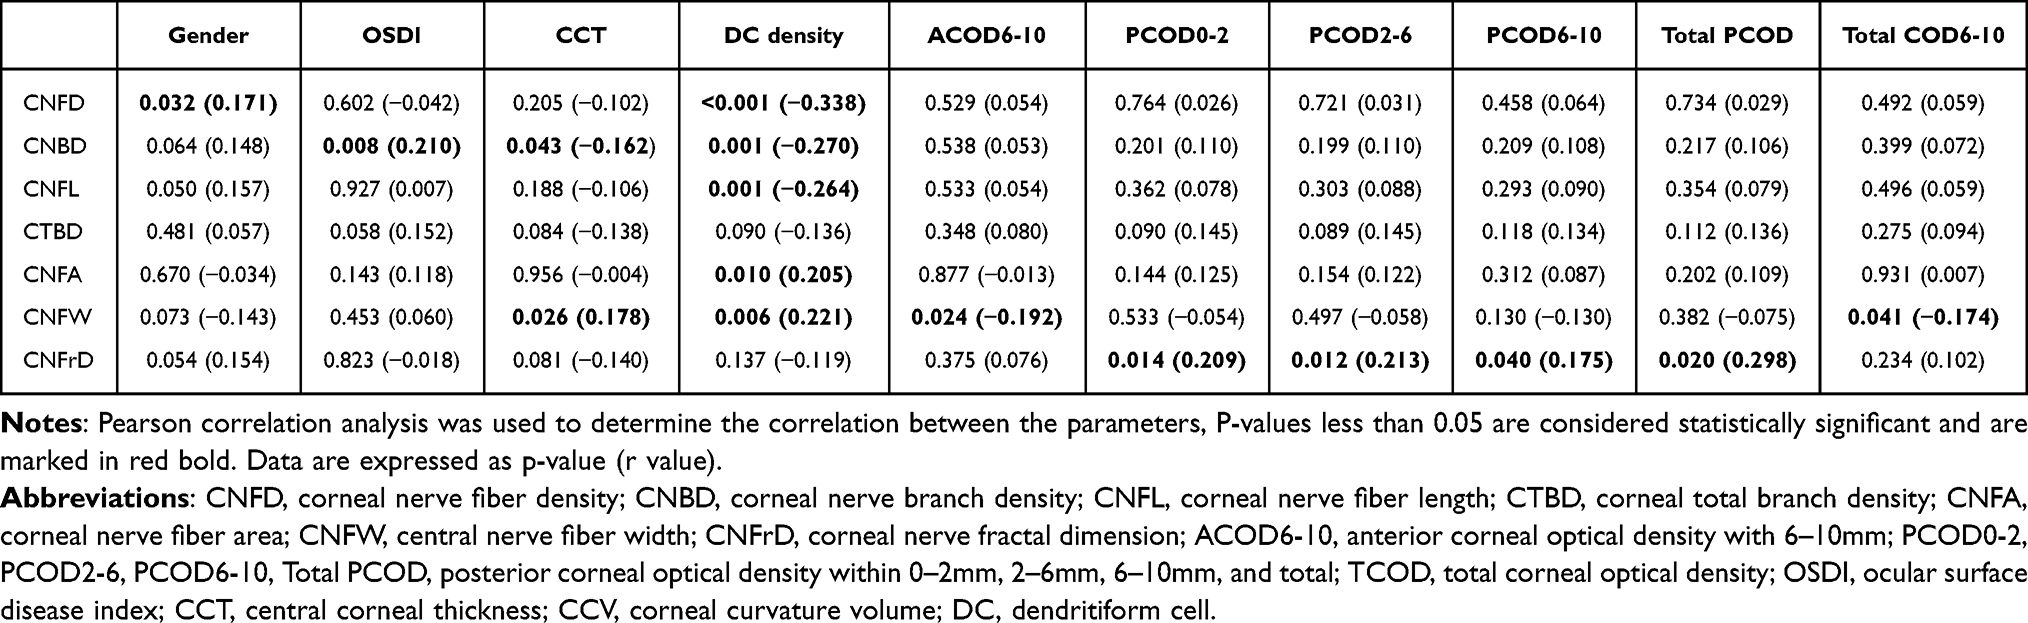 |
Table 3 Correlation Between Corneal Subbasal Nerve Fiber and Clinical Metrics |
Analysis of Myopia Severity and Its Association with Corneal SNP and COD
The mean SER of the 308 evaluated eyes in this study was −6.85 ± 3.0 diopters, with a range from −0.50 to −18.0 diopters. In a subset of 157 patients (one eye per patient), the mean SER was −7.13 ± 3.1 diopters, ranging from −2.25 to −18.0 diopters. Myopia severity among participants was classified into four categories based on SER: low (n = 11), moderate (n = 43), high (n = 62), and very high (n = 27). After adjusting for gender, no significant correlations were identified between myopia severity and any SNP parameters or DC density. AL was also categorized for further analysis: 2 eyes had an AL of 22–24 mm, 61 eyes ranged from 24–26 mm, 75 eyes from 26–28 mm, and 19 eyes exceeded 28 mm. No correlations were found between AL and SNP parameters or DC density, suggesting that neither AL nor SER significantly influenced SNP or DC density.
In a cohort of 138 patients, detailed COD measurements were obtained, with one eye per patient selected for analysis of correlations between COD and myopia severity. These eyes were categorized by SER into low myopia (11 eyes), moderate myopia (55 eyes), high myopia (50 eyes), and extremely high myopia (22 eyes). Based on AL, eyes were grouped as follows: 2 eyes had an AL of 22–24 mm, 58 eyes ranged from 24–26 mm, 61 eyes from 26–28 mm, and 17 eyes exceeded 28 mm. As shown in Table 4, no significant differences in age or gender were observed among groups. Central COD (0–6 mm zone) increased progressively with myopia severity, demonstrating a negative correlation with SER and positive correlations with AL. Significant differences were detected in the middle (MCOD0-2), posterior (PCOD0-2 and PCOD2-6), and total corneal layers (Total COD0-2 and Total COD2-6), whereas anterior COD showed no group differences. Post-hoc Tukey’s tests further confirmed that PCOD0–2 and PCOD2–6 values were significantly higher in the extreme myopia group compared with the low myopia group (P = 0.030 and P = 0.047, respectively).
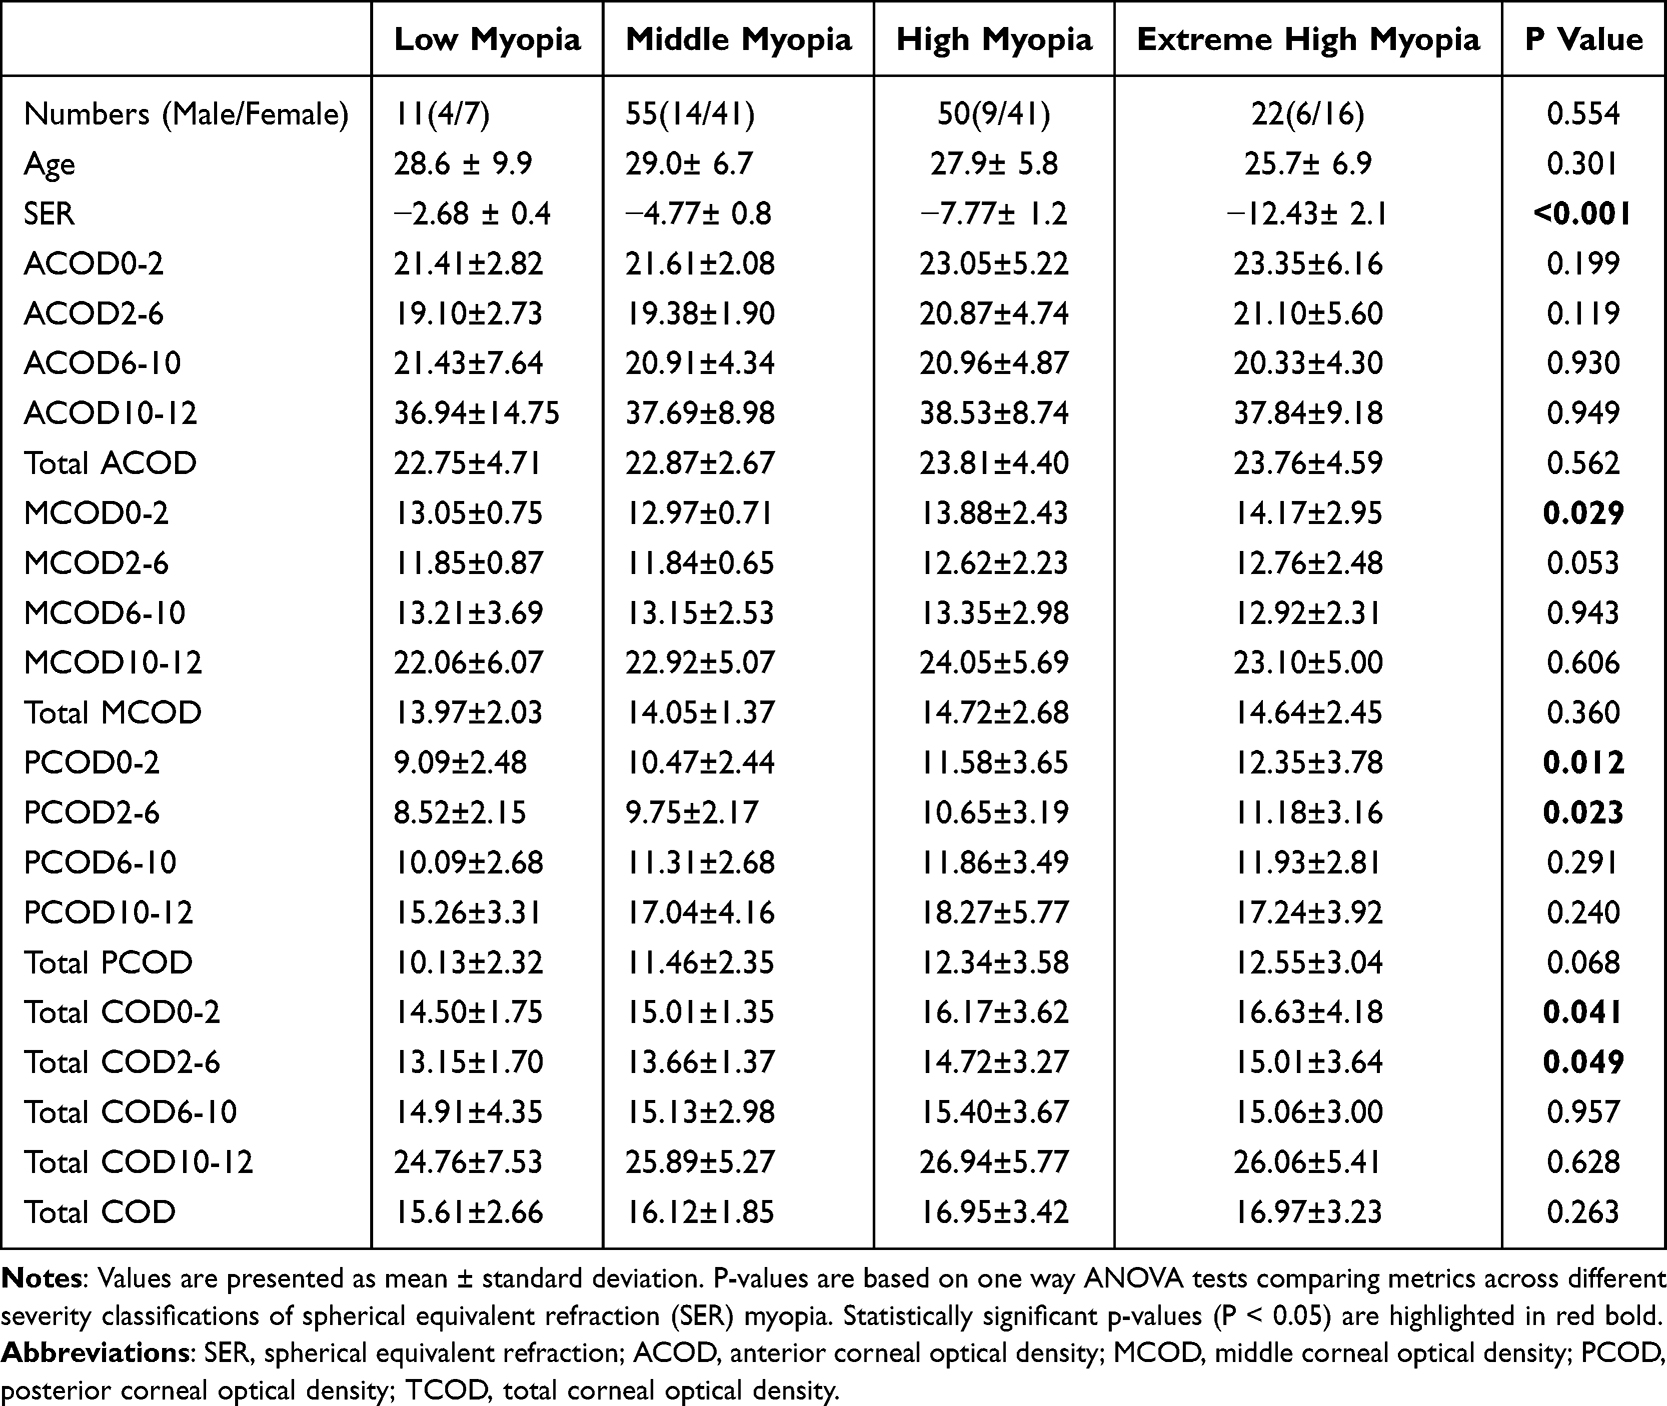 |
Table 4 Comparison of Corneal Optical Density Metrics Across Different Spherical Equivalent Refraction Myopia Severity Classifications |
Discussion
The use of Pentacam and IVCM in clinical studies has significantly expanded our understanding of COD and SNP characteristics in both healthy and pathological corneas.3,13 Much of the existing research encompasses broad age ranges and focuses on pre- and post- RS changes.21,22 However, few studies specifically characterize young myopic populations likely to undergo RS. In this study, we analyzed the corneal biomechanical properties across different severities of myopia, specifically aiming to identify the relationships between COD and SNP metrics in patients seeking myopia correction. By establishing correlations between COD and SNP densities and the severity of myopia, we aim to provide insights that can enhance treatment precision and improve understanding of corneal structural variations, especially in high myopia.
COD, as a sensitive indicator of corneal transparency, effectively detects both significant pathologies and subtle changes in corneal clarity.23 For example, even minor increases in COD among orthokeratology (OK) lens users have been documented, underscoring its broad utility in early diagnosis.24 In our study, age was positively correlated with COD in the 6–12 mm peripheral zone, a finding consistent with the results reported by Ni et al, whose study involved participants with a mean age of 23.88 ± 6.90 years.25 While the relationship between COD and corneal curvature metrics has been relatively underexplored, our analysis revealed distinct correlations across various corneal zones. Specifically, peripheral COD in the 10–12 mm zone demonstrated positive correlations with K1 F and K2 F, whereas COD in the 6–12 mm zone was negatively correlated with K1 B and K2 B. Additionally, COD values in the anterior and middle layers were significantly associated with AstigF, Asph.Q.F, Asph.Q, and PCE. These findings suggest potential links between corneal transparency, anterior curvature, and posterior elevation metrics. The complexity of these relationships highlights the importance of further investigation. Larger-scale studies encompassing a wider age range are essential to fully elucidate the implications of COD variations on corneal morphology. Understanding these relationships more comprehensively could lead to better patient outcomes, particularly for those undergoing myopia correction surgery.
The relationship between myopia and COD remains inconsistent across studies, particularly in the context of age-related variations. Pinar et al examined COD in 62 myopic eyes (ranging from −8.75 to −0.25 D), hyperopic eyes, and 61 emmetropic eyes in children aged 6–18 years.26 Their findings indicated that COD values were significantly lower in hyperopic eyes compared to myopic and emmetropic eyes, with slightly higher mean values of ACOD0-2, ACOD2-6, MCOD10-12, PCOD2-6, and PCOD10-12 in myopic eyes compared to other groups.26 Conversely, Dong et al reported that high myopia was associated with significantly lower COD values across central ACOD and all MCOD and PCOD parameters.27 Similarly, Garzón et al analyzed 338 patients (mean age 32.43 ± 6.66 years; SER range of 6.75 D to −8.00 D) and found no correlation between corneal densitometry and spherical equivalent refraction across different corneal zones.28
Our study appears to be the first to specifically investigate COD variations across different levels of myopia severity. After adjusting for age and gender, we found a negative correlation between SER and COD values in all corneal layers within the central 0–6 mm zone, as well as posterior COD within the 6–10 mm zone. COD parameters within the 0–6 mm zone were also positively correlated with AL. Using a detailed classification of myopia severity (low, middle, high, extreme high) based on SER and AL, our findings demonstrated that COD values increased with myopia severity according to SER grading, although no such correlation was observed with AL grading. ANOVA revealed significant differences in MCOD0-2, PCOD0-2, PCOD2-6, TCOD0-2, and TCOD2-6 among different myopia severity groups. Intergroup comparisons indicated that PCOD0-2 and PCOD2-6 values were significantly higher in the extreme myopia group compared with the low myopia group. Increased COD values suggest reduced corneal transparency, which can lead to diminished visual quality and degraded retinal image clarity.29 Various factors, such as tear film integrity, epithelial condition, stromal health, and endothelial function, contribute to COD. Elevated COD may result from structural disruptions, metabolic disturbances, or corneal dilation, all of which impair corneal transparency and increase light scattering, even in the absence of visible deposits.3 Notably, studies have shown that high myopia is associated with decreased corneal hysteresis (CH) and reduced endothelial cell density, supporting the notion that myopia can significantly impact corneal biomechanics.30,31 In our study, greater myopia severity correlated with higher COD values within the 0–6 mm zone, indicating distinct biomechanical properties of the cornea across varying degrees of refractive error. However, these findings contrast with those of Dong et al,27 who reported lower COD values in HM eyes compared to normal eyes, and Pinar et al,26 who observed significantly lower COD values in hyperopic eyes compared to myopic and emmetropic eyes in children.
Several factors may explain these discrepancies. First, differences in study populations are likely significant. Our study focused on relatively young adults (17 to 52 years, mean age 28.0±6.64) and excluded individuals with systemic diseases that might influence corneal transparency, thereby providing a more homogeneous cohort. In contrast, Dong et al’s study included an older population (20–87 years, mean age 65±10 for normals; 18–92 years, mean age 62±13 for high myopia),27 while Pinar et al examined children aged 6–18 years.26 Since age-related changes, including increased light scatter and collagen remodeling, are known to elevate COD, discrepancies between studies may partly reflect differences in the age distribution of the populations investigated.
Second, methodological variations in defining myopia severity are also critical. Dong et al27 classified high myopia using a single threshold of spherical equivalent refraction (SER) more negative than −6.00 D and axial length longer than 25 mm. By contrast, our study employed a more granular classification scheme for COD analysis: LM defined as −0.50 D to −3.00 D, MM as greater than −3.00 D to −6.00 D, HM as greater than −6.00 D to −10.00 D, and EHM as more negative than −10.00 D. In addition, eyes were stratified by axial length into 22–24 mm, 24–26 mm, 26–28 mm, and >28 mm groups. This refined approach enabled us to detect a graded association between COD and increasing myopia severity, particularly within the central 0–6 mm corneal zone, whereas a single dichotomous cutoff may obscure such relationships. Therefore, differences in age distribution and classification criteria likely account for the apparent discrepancies between our results and those of Dong et al. Further large-scale studies across different age groups and with standardized definitions of myopia severity are warranted to clarify the relationship between COD and high myopia.
In our study, no correlations were observed between the seven SNP metrics and factors such as age, SER, AL, myopia severity, or corneal curvature metrics. This suggests that refractive status and AL may not influence these SNP characteristics. However, we observed that CNFD was lower in males compared to females, possibly due to the higher DC density found in the male subgroup.
The relationship between age and SNP metrics remains controversial. For instance, Gambato et al reported no significant changes in sub-basal nerve plexus fiber count, density, or beadings with age.32 In contrast, Niederer et al found a 0.9% annual decline in sub-basal nerve fiber density (r = −0.423, p < 0.001).33 Harrison et al, using the CS4 confocal microscope, demonstrated a decrease in corneal nerve density in the sub-basal plexus with increasing myopia,34 and Roszkowska et al, employing the Confoscan 4 microscope, identified an inverse relationship between nerve fiber length and density with both age and myopic refractive error.35 These discrepancies between our findings and previous reports may be attributed to differences in study populations and measurement techniques. Our study focused on a younger, narrower age range, which may have limited the variability in age-related nerve changes, potentially explaining our lack of observed age correlations. Moreover, unlike other studies using manual or semi-automated analysis tools, we utilized ACCMetrics software for automated SNP analysis, which may have contributed to differences in fiber and density measurements. These methodological differences underscore the need for standardized SNP measurement techniques to improve comparability across studies. In our analysis, CNBD showed a positive correlation with OSDI scores (r = 0.210, p = 0.008), suggesting that increased nerve branching may be associated with greater symptom severity in ocular surface disease. Interestingly, the correlation between the CNFrD and PCOD metrics also emerged as significant, warranting further investigation into the mechanisms underlying this relationship.
Our study has several notable advantages. It uniquely focuses on a young patient population who are potential candidates for myopia correction surgery, providing valuable, targeted insights for this demographic. To our knowledge, it is the first study to examine the relationship between the severity of myopia and both corneal optical density (COD) and SNP metrics, filling an important knowledge gap regarding corneal changes associated with different degrees of myopia. However, the study’s relatively small sample size limits its ability to explore the underlying mechanisms driving these observed relationships. Additional research involving larger cohorts is necessary to validate these findings and further elucidate causal factors.
Conclusion
This study offers new insights into corneal metrics in myopic patients, specifically the relationships between myopia severity, COD, and SNP characteristics. Our findings suggest that increased myopia severity is positively correlated with COD values across all corneal layers within the central 0–6 mm zone, whereas no significant associations were found with SNP metrics. Further research with larger sample sizes is needed to confirm these findings and deepen our understanding of the underlying mechanisms.
Data Sharing Statement
The authors declare no financial or personal relationships that could have inappropriately influenced the research presented in this paper.
Ethics Approval
All participants provided informed consent. The study adhered to the Declaration of Helsinki and received ethical approval from the institutional review board of the Eye & ENT Hospital of Fudan University.
Acknowledgments
We thank Prof. Jianfeng Luo from Fudan University for providing assistance with data statistical analysis.
Author Contributions
All authors made a significant contribution to the work reported, whether that is in the conception, study design, execution, acquisition of data, analysis and interpretation, or in all these areas; took part in drafting, revising or critically reviewing the article; gave final approval of the version to be published; have agreed on the journal to which the article has been submitted; and agree to be accountable for all aspects of the work.
Funding
This research was supported by the National Natural Science Foundation of China (82401268), the Foundation for the Shanghai Key Laboratory of Visual Impairment and Restoration (12DZ2260500), and the Key NHC Key Laboratory of Myopia (Fudan University), Laboratory of Myopia, Chinese Academy of Medical Sciences.
Disclosure
The authors report there are no competing interests to declare in this work.
References
1. Kim TI, Alió Del Barrio JL, Wilkins M, Cochener B, Ang M. Refractive surgery. Lancet. 2019;393(10185):2085–2098. doi:10.1016/S0140-6736(18)33209-4
2. Wilson SE. Biology of keratorefractive surgery- PRK, PTK, LASIK, SMILE, inlays and other refractive procedures. Exp Eye Res. 2020;198:108136. doi:10.1016/j.exer.2020.108136
3. Yang Q, Ju G, He Y. Corneal densitometry: a new evaluation indicator for corneal diseases. Surv Ophthalmol. 2024;70(1):132–140. doi:10.1016/j.survophthal.2024.09.007
4. Aramberri J, Lauzirika G, Illarramendi I, Mendicute J. Comparison between a new transepithelial PRK vs. conventional alcohol-assisted PRK: corneal densitometry and aberrometry study. Eur J Ophthalmol. 2024;35(2):474–481. doi:10.1177/11206721241267360
5. Toda I. Dry Eye After LASIK. Investig Ophthalmol Vis Sci. 2018;59:DES109–DES115. doi:10.1167/iovs.17-23538
6. Toh CJL, Liu C, Lee IXY, Yu Lin MT, Tong L, Liu YC. Clinical associations of corneal neuromas with ocular surface diseases. Neural Regen Res. 2024;19(1):140–147. doi:10.4103/1673-5374.375308
7. Poyales F, Garzón N, Mendicute J, et al. Corneal densitometry after photorefractive keratectomy, laser-assisted in situ keratomileusis, and small-incision lenticule extraction. Eye. 2017;31(12):1647–1654. doi:10.1038/eye.2017.107
8. Kaufman SC, Kaufman HE. How has confocal microscopy helped us in refractive surgery? Curr Opin Ophthalmol. 2006;17(4):380–388. doi:10.1097/01.icu.0000233959.73262.99
9. Tavakoli M, Ferdousi M, Petropoulos IN, et al. Normative values for corneal nerve morphology assessed using corneal confocal microscopy: a multinational normative data set. Diabetes Care. 2015;38(5):838–843. doi:10.2337/dc14-2311
10. Rosenberg ME, Tervo TM, Immonen IJ, Müller LJ, Grönhagen-Riska C, Vesaluoma MH. Corneal structure and sensitivity in type 1 diabetes mellitus. Invest Ophthalmol Vis Sci. 2000;41(10):2915–2921.
11. Yilmaz YC, Hayat SC, Ipek SC. Analysis of corneal and lens densitometry changes in patients with type 1 diabetes mellitus. Am J Ophthalmol. 2023;254:23–30. doi:10.1016/j.ajo.2023.05.017
12. Gustafsson I, Bizios D, Ivarsen A, Hjortdal JØ. The intra- and inter-day repeatability of corneal densitometry measurements in subjects with keratoconus and in healthy controls. Sci Rep. 2023;13(1):5566. doi:10.1038/s41598-023-32822-y
13. Weed KH, MacEwen CJ, Cox A, McGhee CN. Quantitative analysis of corneal microstructure in keratoconus utilising in vivo confocal microscopy. Eye. 2007;21(5):614–623. doi:10.1038/sj.eye.6702286
14. Kaufman SC, Beuerman RW, Kaufman HE. Diagnosis of advanced Fuchs’ endothelial dystrophy with the confocal microscope. Am J Ophthalmol. 1993;116(5):652–653. doi:10.1016/S0002-9394(14)73217-9
15. Kai C, Oie Y, Nishida N, et al. Associations between visual functions and severity gradings, corneal scatter, or higher-order aberrations in Fuchs endothelial corneal dystrophy. Invest Ophthalmol Vis Sci. 2024;65(6):15. doi:10.1167/iovs.65.6.15
16. Vaddavalli PK, Garg P, Sharma S, Sangwan VS, Rao GN, Thomas R. Role of confocal microscopy in the diagnosis of fungal and acanthamoeba keratitis. Ophthalmology. 2011;118(1):29–35. doi:10.1016/j.ophtha.2010.05.018
17. Otri AM, Fares U, Al-Aqaba MA, Dua HS. Corneal densitometry as an indicator of corneal health. Ophthalmology. 2012;119(3):501–508. doi:10.1016/j.ophtha.2011.08.024
18. Schiffman RM, Christianson MD, Jacobsen G, Hirsch JD, Reis BL. Reliability and validity of the ocular surface disease index. Arch Ophthalmol. 2000;118(5):615–621. doi:10.1001/archopht.118.5.615
19. Patel DV, McGhee CN. Mapping of the normal human corneal sub-Basal nerve plexus by in vivo laser scanning confocal microscopy. Invest Ophthalmol Vis Sci. 2005;46(12):4485–4488. doi:10.1167/iovs.05-0794
20. Dabbah MA, Graham J, Petropoulos IN, Tavakoli M, Malik RA. Automatic analysis of diabetic peripheral neuropathy using multi-scale quantitative morphology of nerve fibres in corneal confocal microscopy imaging. Med Image Anal. 2011;15(5):738–747. doi:10.1016/j.media.2011.05.016
21. Hou C, Li J, Li J, Peng H, Wang Q. In vivo confocal microscopy of sub-basal corneal nerves and corneal densitometry after three kinds of refractive procedures for high myopia. Int Ophthalmol. 2023;43(3):925–935. doi:10.1007/s10792-022-02494-0
22. Alio Del Barrio JL, Parafita-Fernandez A, Canto-Cerdan M, Alio JL, Teus M. Evolution of corneal thickness and optical density after laser in situ keratomileusis versus small incision lenticule extraction for myopia correction. Br J Ophthalmol. 2021;105(12):1656–1660. doi:10.1136/bjophthalmol-2020-316601
23. Alnawaiseh M, Zumhagen L, Zumhagen S, et al. Corneal densitometry as a novel technique for monitoring amiodarone therapy. Ophthalmology. 2016;123(11):2294–2299. doi:10.1016/j.ophtha.2016.08.001
24. Zhang YE, Ouzzani M, Wright C, Sorbara L. Changes in corneal thickness, corneal volume, and densitometry after long-term orthokeratology wear. Cont Lens Anterior Eye. 2023;46(1):101703. doi:10.1016/j.clae.2022.101703
25. Ní Dhubhghaill S, Rozema JJ, Jongenelen S, Ruiz Hidalgo I, Zakaria N, Tassignon MJ. Normative values for corneal densitometry analysis by Scheimpflug optical assessment. Invest Ophthalmol Vis Sci. 2014;55(1):162–168. doi:10.1167/iovs.13-13236
26. Nalcacioglu P, Sen E, Aydemir E, Kiziltoprak H, Yasar HH. Objective assessment of corneal backscattered light in myopic, hyperopic, and emmetropic children. Photodiagnosis Photodyn Ther. 2022;40:103031. doi:10.1016/j.pdpdt.2022.103031
27. Dong J, Zhang Y, Zhang H, et al. Corneal densitometry in high myopia. BMC Ophthalmol. 2018;18(1):182. doi:10.1186/s12886-018-0851-x
28. Garzón N, Poyales F, Illarramendi I, et al. Corneal densitometry and its correlation with age, pachymetry, corneal curvature, and refraction. Int Ophthalmol. 2017;37(6):1263–1268. doi:10.1007/s10792-016-0397-y
29. Spadea L, Maraone G, Verboschi F, Vingolo EM, Tognetto D. Effect of corneal light scatter on vision: a review of the literature. Int J Ophthalmol. 2016;9(3):459–464. doi:10.18240/ijo.2016.03.24
30. Shen M, Fan F, Xue A, Wang J, Zhou X, Lu F. Biomechanical properties of the cornea in high myopia. Vision Res. 2008;48(21):2167–2171. doi:10.1016/j.visres.2008.06.020
31. Chang SW, Tsai IL, Hu FR, Lin LL, Shih YF. The cornea in young myopic adults. Br J Ophthalmol. 2001;85(8):916–920. doi:10.1136/bjo.85.8.916
32. Gambato C, Longhin E, Catania AG, Lazzarini D, Parrozzani R, Midena E. Aging and corneal layers: an in vivo corneal confocal microscopy study. Graefes Arch Clin Exp Ophthalmol. 2015;253(2):267–275. doi:10.1007/s00417-014-2812-2
33. Niederer RL, Perumal D, Sherwin T, McGhee CN. Age-related differences in the normal human cornea: a laser scanning in vivo confocal microscopy study. Br J Ophthalmol. 2007;91(9):1165–1169. doi:10.1136/bjo.2006.112656
34. Harrison WW, Putnam NM, Shukis C, et al. The corneal nerve density in the sub-basal plexus decreases with increasing myopia: a pilot study. Ophthalmic Physiol Opt. 2017;37(4):482–488. doi:10.1111/opo.12366
35. Roszkowska AM, Wylęgała A, Gargano R, et al. Impact of corneal parameters, refractive error and age on density and morphology of the subbasal nerve plexus fibers in healthy adults. Sci Rep. 2021;11(1):6076. doi:10.1038/s41598-021-85597-5
 © 2025 The Author(s). This work is published and licensed by Dove Medical Press Limited. The
full terms of this license are available at https://www.dovepress.com/terms
and incorporate the Creative Commons Attribution
- Non Commercial (unported, 4.0) License.
By accessing the work you hereby accept the Terms. Non-commercial uses of the work are permitted
without any further permission from Dove Medical Press Limited, provided the work is properly
attributed. For permission for commercial use of this work, please see paragraphs 4.2 and 5 of our Terms.
© 2025 The Author(s). This work is published and licensed by Dove Medical Press Limited. The
full terms of this license are available at https://www.dovepress.com/terms
and incorporate the Creative Commons Attribution
- Non Commercial (unported, 4.0) License.
By accessing the work you hereby accept the Terms. Non-commercial uses of the work are permitted
without any further permission from Dove Medical Press Limited, provided the work is properly
attributed. For permission for commercial use of this work, please see paragraphs 4.2 and 5 of our Terms.
Recommended articles
Photorefractive Keratectomy Enhancement (PRK) After Small-Incision Lenticule Extraction (SMILE)
Moshirfar M, Parsons MT, Chartrand NA, Lau CK, Stapley S, Bundogji N, Ronquillo YC, Hoopes PC
Clinical Ophthalmology 2022, 16:3033-3042
Published Date: 12 September 2022
Prospective, Randomized, Fellow Eye-Controlled Study of Postoperative Pain and Inflammation Control with an Intracanalicular Dexamethasone 0.4 mg Ophthalmic Insert Following Small Incision Lenticule Extraction
Jee KJ, Ling J, Bafna S, Chester T, Augustine J, Wiley WF
Clinical Ophthalmology 2022, 16:3895-3904
Published Date: 22 November 2022
Visual Acuity Improvement in Low, Moderate and High Myopia After Posterior-Chamber Phakic Implantable Collamer Lens Surgery in a Large Patient Cohort
Zaldivar R, Zaldivar R, Gordillo CH, Adamek P
Clinical Ophthalmology 2023, 17:1179-1185
Published Date: 18 April 2023
A Comprehensive Retrospective Analysis of EVO/EVO+ Implantable Collamer Lens: Evaluating Refractive Outcomes in the Largest Single Center Study of ICL Patients in the United States
Albo C, Nasser T, Szynkarski DT, Nguyen N, Mueller B, Libfraind L, Parkhurst G
Clinical Ophthalmology 2024, 18:69-78
Published Date: 9 January 2024
Clinical Outcomes of Implantable Collamer Lenses for the Treatment of Myopia in Eyes with Anterior Chamber Depth (<3.0 mm) at a Single Center in the United States
Hirabayashi M, Virdi G, Abramson AJ, Nasser T, Vanrachack A, Parkhurst G
Clinical Ophthalmology 2025, 19:1985-1990
Published Date: 25 June 2025