Back to Journals » Clinical and Experimental Gastroenterology » Volume 15
Ethnicity Associated Microbial and Metabonomic Profiling in Newly Diagnosed Ulcerative Colitis
Authors Misra R ![]() , Sarafian M, Pechlivanis A, Ding N, Miguens-Blanco J, McDonald J, Holmes E, Marchesi J, Arebi N
, Sarafian M, Pechlivanis A, Ding N, Miguens-Blanco J, McDonald J, Holmes E, Marchesi J, Arebi N
Received 17 May 2022
Accepted for publication 7 November 2022
Published 5 December 2022 Volume 2022:15 Pages 199—212
DOI https://doi.org/10.2147/CEG.S371965
Checked for plagiarism Yes
Review by Single anonymous peer review
Peer reviewer comments 2
Editor who approved publication: Dr Santosh Shenoy
Ravi Misra,1 Magali Sarafian,2 Alexandros Pechlivanis,3 Nik Ding,4 Jesus Miguens-Blanco,2 Julie McDonald,5 Elaine Holmes,2,6 Julian Marchesi,2,5,7 Naila Arebi1
1Gastroenterology, St Mark’s Academic Institute, London, UK; 2Division of Integrative Systems Medicine and Digestive Disease, Department of Surgery and Cancer, Imperial College, London, UK; 3Analytical Chemistry, Aristotle University of Thessaloniki, Thessaloniki, Greece; 4St Vincent’s Hospital, Inflammatory Bowel Disease Unit, Melbourne, Australia; 5School of Biosciences, Cardiff University, Cardiff, UK; 6Health Futures Institute, Murdoch and Edith Cowan Universities, Murdoch, Australia; 7Centre for Gut Health, Imperial College, London, UK
Correspondence: Ravi Misra, St. Mark’s Academic Institute, Imperial College, St. Mark’s Hospital, Watford Road, London, United Kingdom, Tel +44 0208 235 4124, Email [email protected]
Introduction: Ulcerative colitis (UC) differs across geography and ethnic groups. Gut microbial diversity plays a pivotal role in disease pathogenesis and differs across ethnic groups. The functional diversity in microbial-driven metabolites may have a pathophysiologic role and offer new therapeutic avenues.
Methods: Demographics and clinical data were recorded from newly diagnosed UC patients. Blood, urine and faecal samples were collected at three time points over one year. Bacterial content was analysed by 16S rRNA sequencing. Bile acid profiles and polar molecules in three biofluids were measured using liquid-chromatography mass spectrometry (HILIC) and nuclear magnetic resonance spectroscopy.
Results: We studied 42 patients with a new diagnosis of UC (27 South Asians; 15 Caucasians) with 261 biosamples. There were significant differences in relative abundance of bacteria at the phylum, genus and species level. Relative concentrations of urinary metabolites in South Asians were significantly lower for hippurate (positive correlation for Ruminococcus) and 4-cresol sulfate (Clostridia) (p< 0.001) with higher concentrations of lactate (negative correlation for Bifidobacteriaceae). Faecal conjugated and primary conjugated bile acids concentrations were significantly higher in South Asians (p=0.02 and p=0.03 respectively). Results were unaffected by diet, phenotype, disease severity and ongoing therapy. Comparison of time points at diagnosis and at 1 year did not reveal changes in microbial and metabolic profile.
Conclusion: Ethnic-related microbial metabolite associations were observed in South Asians with UC. This suggests a predisposition to UC may be influenced by environmental factors reflected in a distinct gene-environment interaction. The variations may serve as markers to identify risk factors for UC and modified to enhance therapeutic response.
Keywords: ulcerative colitis, microbiome, metabonomics
Introduction
Inflammatory bowel disease (IBD) encompasses Crohn’s disease and ulcerative colitis (UC) as chronic relapsing and remitting inflammatory conditions.1 They share a common pathophysiologic process mediated as an aberrant immune response to environmental factors and altered microbial composition in genetically predisposed individuals.2 The global incidence of IBD, previously recognised as highest in western industrialised countries, has shifted with an increasing rate in previous low-incidence countries.3 Migrants from low to high incidence countries show a high risk of IBD, sometimes exceeding local population, with ethnic related differences in disease phenotypes.4 South Asian migrants to Canada and United Kingdom showed a higher risk of ulcerative colitis (UC) and pan-colonic phenotype compared with the Caucasian population.5–7 In Europe, non-Caucasians with IBD presented with more severe disease behaviour than Caucasians.8 That such health disparities are evident in first generation migrants, suggests an immediate environmental factor related to geography. The earlier age of disease presentation noted in second generation migrants of several ethnic groups lends further support to an underlying gene-environmental interaction related to shared dietary, cultural or lifestyle practices within ethnic communities.7
Ethnic-associated microbiota variations are also well recognised, from recent studies on healthy South Asians in Canada and migrants from Thailand to the US.9,10 Likewise, preliminary studies on adults with UC revealed distinct microbial community patterns for Europeans and South Asians, wherein Europeans showed a predominance in Bacteroidaceae family, and South Asians showed all four identified patterns.11 How such differences relate to health disparities for IBD is not so clear, reflected in an evolving field of research that may offer further insight into pathophysiology of IBD and reveal modifiable risk factors for disease prevention and/or therapy personalisation.
Bacterial-derived metabolites mediate some microbial-host immune-modulatory effects.12 Of the several bacterial-associated metabolites associated with IBD, short-chain fatty acids and bile acids are the most extensively investigated.13,14 Short chain fatty acids such as butyrate are characterized by anti-inflammatory properties,15–17 other metabolites such as high p-cresol sulphate have pro-inflammatory actions, whereas the immunomodulatory effects of bile acids are dependent on concentrations and conjugation. Primary conjugated bile acids and conjugated bile acids exhibit pro-inflammatory effects as they modify luminal bile acid pool composition with resulting bacterial fluctuations that modulate the anti-inflammatory influence of secondary bile acids.18,19 There are no studies describing ethnic-associated metabonomic variations in South Asians.
An argument for research to study migration and ethnicity as a risk determinant of IBD was recently presented in a commentary.20 Deeper insight into gene-environment interaction by examining ethnic variations in host microbiome-metabonome axis may fill gaps in our understanding of disease pathogenesis. This has therapeutic implications since microbiome may alter response to biologic therapy and metabolites namely butyrate enhance response to azathioprine.21,22 We comprehensively examined the microbiome and metabolome longitudinally within a newly diagnosed ethnic UC cohort living in a prespecified geographic region.
Materials and Methods
Study Population
All newly diagnosed patients with UC in Brent and Harrow, London over a one-year period were identified through searching endoscopy, pathology and radiology reports for key words: ulcerative colitis, colitis and proctitis. Patients of South Asian and Caucasian ethnicity over the age of 16 years with a diagnosis confirmed by Copenhagen criteria were included.23 Consent, baseline data and samples collection were completed at first clinic visit (timepoint 1). Age, gender and demographic data, including ethnicity were recorded. Some patients received therapy immediately after diagnostic test and therapy was registered at the first visit. At follow up, timepoint 2 (months 4–8) and timepoint 3 (months 8–12), further samples were collected and disease activity measured by the Simple Clinical Colitis Activity index (SCCAI)24 classified as remission (score 0–2), mild (score 3–5), moderate (score 5–8), or severe (score >8). Where patients were on multiple treatments, the strongest treatment at each time point was recorded.
Sample Collection
Urine (taken after the first void of the day), faecal and blood samples were collected at the first visit. Blood samples were centrifuged immediately after collection and the supernatant immediately separated for analysis. Samples were frozen at −20℃ within a maximum of four hours and subsequently transferred to −80℃ storage within 24 hours. The number and timing of samples are shown in Supplementary Table 1.
Sample Collection from Healthy Controls
Healthy controls (HC) provided urine, blood and stool samples at two time points, one month apart to provide a measure of interindividual variation in metabolic profiling.
Diet Questionnaire
A food frequency questionnaire (FFQ) was administered at first visit to obtain a snapshot of dietary intake at 3 months prior to diagnosis. The FFQ included questions on the habitual daily consumption of 150 food items during a 3-month period. Food intakes (g/day) of each food group were computed by multiplying frequency of consumption by specified portion. To assess the impact of dietary interactions and the microbiota at timepoint 1, food intake was categorised into the following groups: Vegetarian/Non-Vegetarian, fibre, fats and protein. These groups were chosen as they have been proven to alter the colonic microbiota.19,25,26 The group median value was calculated, and food intake assigned to either low or high compared to the median. This categorisation is a common approach adopted in defining diet quality.27
Ethical Approval
The study was approved by the London Northwest NHS trust and National Research Ethics Service (REC number14/EM/1290). Informed consent was obtained from all study participants prior to study commencement. The study complies with the ethical principles of the Declaration of Helsinki.
Experimental Procedure
qPCR
Analysis was completed using the protocol designed by Mcdonald et al.28
Metataxonomic Analysis (16S rRNA Gene Sequencing)
DNA was extracted from 200 mg of stool and DNA was stored at −80℃ until ready to use. DNA was extracted from stool using the PowerLyzer PowerSoil DNA Isolation Kit (Mo Bio, Carlsbad, CA, USA) following manufacturer’s instructions, with the modification that samples were bead beaten for three mins at speed 8 in a Bullet Blender Storm (Chembio Ltd, St. Albans, UK) and stored at −80℃ until ready to use.
Sample libraries were prepared following Illumina’s 16S Metagenomic Sequencing Library Preparation Protocol29 with the following modifications. The V1-V2 regions of the 16S rRNA gene were amplified using specific primers.28 The index PCR reactions were cleaned up and normalised using the SequalPrep Normalization Plate Kit (Life Technologies, Paisley, UK).
Sample libraries were quantified using the NEBNext Library Quant Kit for Illumina (New England Biolabs, Hitchin, UK). Sequencing was performed on an Illumina MiSeq platform (Illumina Inc., Saffron Walden, UK) using the MiSeq Reagent Kit v3 (Illumina) and paired-end 300bp chemistry.
The raw fastq data was processed using the QIME pipeline. Statistical analysis was performed using STAMP 2.1.3 software with White’s non-parametric for comparing two groups and Benjamini-Hochberg to adjust for false discovery rate.30 Alpha diversity indices in faecal samples were analysed by investigating species richness (using Chao1 index) where diversity and stability is directly associated with number of sequences per sample. Brays Curtis dissimilarity and PERMANOVA analysis were performed to test statistical differences between the two groups.
Methods of sample preparation including urine for proton nuclear magnetic resonance (1H NMR) analysis and ultra performance liquid chromatography-mass spectroscopy (UPLC-MS) are detailed in the Supplementary Material together with UPLC-MS hydrophilic interaction chromatography (HILIC) and UPLC-MS bile acid profiling methods (Supplementary Data Section Methods).
Univariate and Multivariate Analysis for Metabolite and Dietary Data
Multivariate data analysis was performed using the SIMCA software (v.14.0.2, Umetrics, Umeå, Sweden). Principal components analysis (PCA) and supervised orthogonal partial least squares discriminant analysis (OPLS-DA) were carried out on all spectral datasets individually. Robust OPLS-DA models were validated by CV-ANOVA p-value. Two-tailed t-tests assuming unequal variance, and coefficient of variation % (CV%) were calculated in Microsoft Office Excel 2016. Statistical analysis of food intake in g/day was compared between Caucasian and South Asian groups using the Students t-test. PCA scores and loadings plots were generated using SIMCA software (v.14.0.2, Umetrics, Umeå, Sweden) for comparison of food intake categorised by food groups.
Biomarker Assignment
Metabolite Identification for 1H NMR Profiling
The 1H NMR spectral regions related to the discrimination between two sample classes were identified using supervised multivariate discriminant analysis, followed by statistical total correlation spectroscopy (STOCSY) for metabolite assignment.31 Metabolite assignment was performed by comparing chemical shifts, JRes coupling, and peaks multiplicity with information in in-house and open access databases (such as Human Metabolome DataBase, HMDB) and literature.32,33
Metabolite Structural Identification for UPLC-MS Profiling
Metabolite identification was conducted by matching accurate m/z measurements of detected chromatographic features to theoretical values from in-house databases and on-line databases such as the human metabolite database (HMDB, http://www.hmdb.ca/) KEGG (http://www.genome.jp/kegg/ligand.html), METLIN (http://metlin.scripps.edu/) and previous publications. Tandem MS fragmentation patterns were obtained for further structural elucidation and confirmed with authentic standards matching for retention time and m/z.
Results
Demographics
A total of 48 patients were diagnosed with UC over one year. South Asians and Caucasians constituted the main ethnic groups (n=42) with the remaining six of mixed ethnicity. Details of the main ethnic groups, South Asians and Caucasians, are shown in Table 1. South Asians had a lower median age at diagnosis, male predominance (16 males and 5 females) and higher median SCCAI score. Seven South Asian (26%) patients were receiving steroid treatment compared with none for Caucasians at the first visit. There were significantly more male subjects in the South Asian UC and control groups (p<0.0001, chi squared test). Seventy-eight blood, 98 urine and 85 faecal samples were collected from this population (Supplementary Table 1).
 |
Table 1 Demographics and Clinical Characteristics of Recruited Ulcerative Colitis (UC) and Healthy Control (HC) Participants |
Validation of Metataxonomic Data Analysis Assessed by Quantitative PCR Analysis
The lack of information on 16S rRNA copy numbers and genome sizes make the relative abundance estimates in complex bacterial populations difficult to interpret.34 We performed qPCR to quantify the overall bacterial load in both groups. The average copy number of South Asian samples was 20,001 (±2SD, 29,196) and 9785 (±2SD, 14,029) in Caucasians. There was no statistical difference between the two ethnic cohorts (p=0.21, t-test).
Reduced Species Richness Observed in Metataxonomic Profile
The Chao 1 index demonstrated a trend towards lower bacterial diversity in South Asians although overlap of the error bars demonstrated no significant difference (Figure 1). A significant PERMANOVA result based on Brays Curtis dissimilarity confirmed compositional differences between the two groups.
 |
Figure 1 (A) Rarefaction curves plotting the alpha-diversity (number of species, chao 1) found within a given number of observations (DNA sequences) from 16S rRNA gene sequences of South Asian and Caucasian UC faecal samples. (B) Beta diversity plot showing clear separation of South Asian and Caucasian samples (Brays Curtis, PERMANOVA, p value= 0.001). Abbreviations: SA, South Asian; Cauc, Caucasian. |
Differences in Relative Abundance at Metataxonomic Levels
At the phylum level (Figure 2A), the relative abundance of Bacteroidetes and Firmicutes was reduced whereas Actinobacteria was increased in the South Asian group. Significant taxonomic differences at family and genus level are shown in Figure 2B and C. Clostridia was significantly reduced at the Clostridiales order level in South Asians although there was no difference at deeper taxonomic levels in this group. There were significant relative increases in Bifidobacterium, Rikenellaceae, Lactobacillus and Streptococcus with significantly decreased relative abundance in Barnessiellacae, Anaerostipes and Ruminococcus.
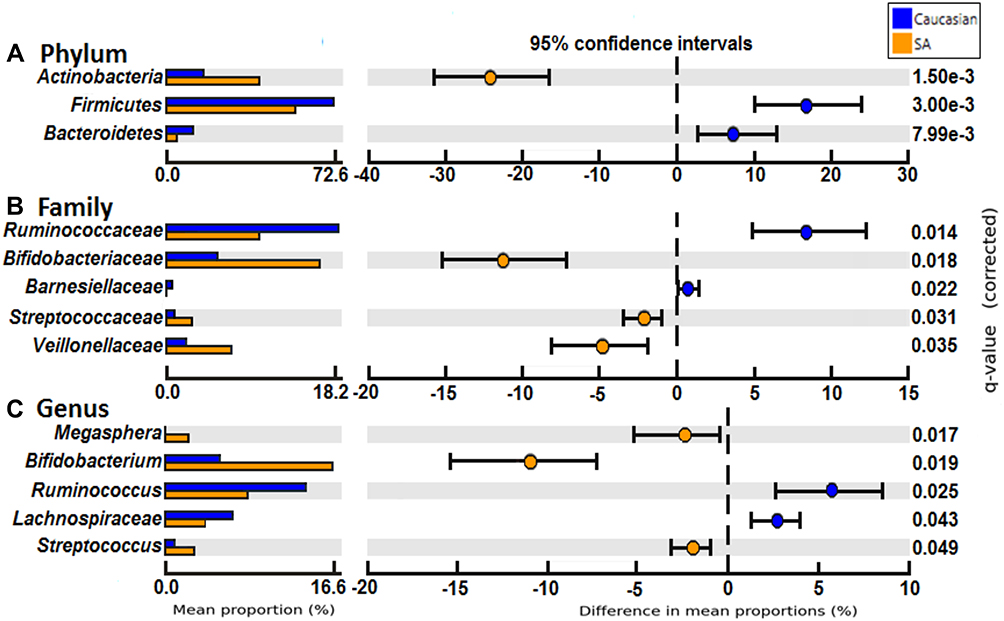 |
Figure 2 Comparison between relative abundance at phylum (A), family (B) and genus (C) level between South Asians and Caucasian groups with Benjamini-Hochberg correction. Mean relative abundance of samples in each group with 95% CI is shown. Abbreviation: SA, South Asian. |
We examined the relative abundance of Bifidobacterium in each subject (Supplementary Figure 1). Analysis of yoghurt intake showed no difference in relative abundance according to high and low intake.
Identification of Metabolites
1H NMR group analysis revealed significant differences in UC patients between South Asians and Caucasians (Supplementary Table 2). A robust model was obtained by OPLS-DA (R2Y 0.847, Q2Y 0.52, CV ANOVA p<0.0001) (Supplementary Figure 2). The coefficients plot demonstrated annotated compounds which differed significantly between South Asian and Caucasian groups: South Asians had higher concentration of isobutyrate, lactate and alanine whilst hippurate, 4-cresol sulphate, lysine and citrate were lower (Supplementary Figure 3A and B). Box plots demonstrating the variation in concentration of each metabolite are shown in Figure 3A. The South Asian group (Figure 3B) showed strong positive correlations of hippurate with Ruminococcus, Rikenellaceae and Mogibacteria. Rikenellaceae and Mogibacteriaceae are both correlated with hippurate and 4-cresol sulphate.
 |
Figure 3 (A) Urinary 1HNMR analysis showing seven metabolic variations between South Asian (blue) and Caucasian (red) groups by non-parametric Mann U-Whitney test (p<0.001 for all compounds). (B) Microbial- urinary 1HNMR Spearman’s rank correlations in SA UC patients. The colour palette gradient symbolises positive (purple) to negative associations (brown). |
Metabolic Profiles
Two analytical platforms were implemented to achieve broad metabolome coverage: HILIC and bile acid profiling. A comprehensive analysis of metabolites was performed on serum, urine and faeces from 32 patients (21 South Asian, 11 Caucasian), and 18 healthy controls (7 South Asian, 11 Caucasian). The robustness of the analytical runs was assured using features with repeatability in their measurement (coefficient of variation <30%) and the stability of measurement was accessed from the clustering in the PCA plot of the QC samples.
The predictive OPLS-DA models were built, and their validity was assessed using model characteristics (R2, Q2 and CV-ANOVA generated p-values). Both HILIC (urine and faeces) and bile acid profiling (serum and faeces) assays demonstrated significant differences between South Asian and Caucasian UC groups (Supplementary Table 3). There were significant differences in metabolic profile between healthy South Asians and Caucasians for the faecal HILIC and faecal BA assays. Metabolic variations were less apparent between timepoint analysis (timepoint 1 vs time point 3) and between patients on different drug treatments (Supplementary Table 4). No assays showed statistically significant differences comparing time point 1 (months 0–3) and time point 3 (months 9–12). Faecal HILIC and faecal BA assays differentiated between patients taking steroids and azathioprine compared with those not on treatment. UC patients not on treatment of South Asian and Caucasian origin also had significantly different profiles. Group analysis demonstrated a consistent difference across biofluids and assays.
HILIC Profiling
The faecal HILIC plots show a highly predictive model identifying significant differences between South Asian and Caucasian UC patients (Supplementary Figure 4A). In total 1800 features were identified as potential markers. Tentative structural identifiers were assigned to leucylproline (higher in South Asians) and pantothenic acid, phenylalanine, creatinine and tryptophan.
The compound was spiked into the QC and the spectra were examined to discover whether the featured compound was eluting at the same retention time. Finally, the compound was further characterised by specific fragmentation pattern. Pantothenic acid was validated with higher concentration in South Asians (Supplementary Table 5).
Bile Acid Profiling
A robust OPLS-DA model for faecal bile acids assay was observed (Supplementary Figure 4B). The South Asian vs Caucasian model discriminated between the groups (Q2Y=0.277). Six discriminatory metabolites were present in higher relative group concentrations in South Asians, two secondary bile acids (5 β-cholanic acid-3α,6α-diol-7-one) and five unassigned compounds, one of which was sulfated (Supplementary Table 5). Nine metabolites were lower in the South Asian group, four secondary bile acids (3-ketocholanic acid, lithocholic acid, isolithocholic acid, 3α-hydroxy-12-ketolithocholic acid) and four unassigned compounds (Figure 4A). There was no difference in the primary bile acids (cholic acid and chenodeoxycholic acid) but primary conjugated bile acids were significantly higher in South Asians (p=0.03) (Figures 4B). Significant differences in bile acid concentrations persisted after Bonferroni correction (Supplementary Table 6).
 |
Figure 4 (A) Faecal BAs and error bars with significantly higher relative concentration (ppm) in Caucasians compared with Asians *p<0.05, **p<0.01, *** p<0.001. (B) Concentration of primary conjugated faecal bile acids and conjugated and unconjugated faecal bile acids with standard error of the mean. *p<0.05. (C) Microbiota- Bile acids Spearman's rank correlations in South Asians. The colour palette gradient symbolises positive (purple) to negative associations (brown). |
For serum bile acids analysis, models for South Asian vs Caucasian for assigned and unassigned discriminant compounds were not significant after multiple correction testing. Ruminococcus positively correlates with isolithocholic and 3-ketocholanic acid and 3 unassigned compounds. Bifidobacterium in contrast demonstrates a negative correlation of the same compounds (Figure 4C).
Metataxonomic Profile by Disease Timepoint and Treatment Analysis
There was no significant difference in relative abundance of bacteria between treatment groups at all time points (5-ASA, Azathioprine, Steroids, None) and time points 1 vs 3 (0–3 months and 9–12 months). To consider an effect unrelated to UC, healthy controls at baseline were also analysed. We integrated dietary data and compared baseline differences between the two groups by, disease phenotype and severity to examine whether the differences in bacterial and metabolic profile, could be due to diet, disease phenotype and disease activity as confounders.
Metataxonomic results of Control Groups at Baseline
The PCA plot for healthy Caucasians compared with South Asians, is shown in Supplementary Figure 5. On multivariate analysis there was no significant difference in relative abundance of bacteria at phylum, family and genus levels.
Metabolic Profiling at Diagnosis Analysis
Group comparisons at Timepoint 1 of relative concentration of compounds by urinary 1H NMR analysis are shown in Supplementary Table 7. There were no baseline differences between the groups. At timepoint 1 the metabolic variation between South Asians and Caucasians persists across HILIC (p=0.015) and bile acid (p=0.01) platforms (Table 2 and Figure 5).
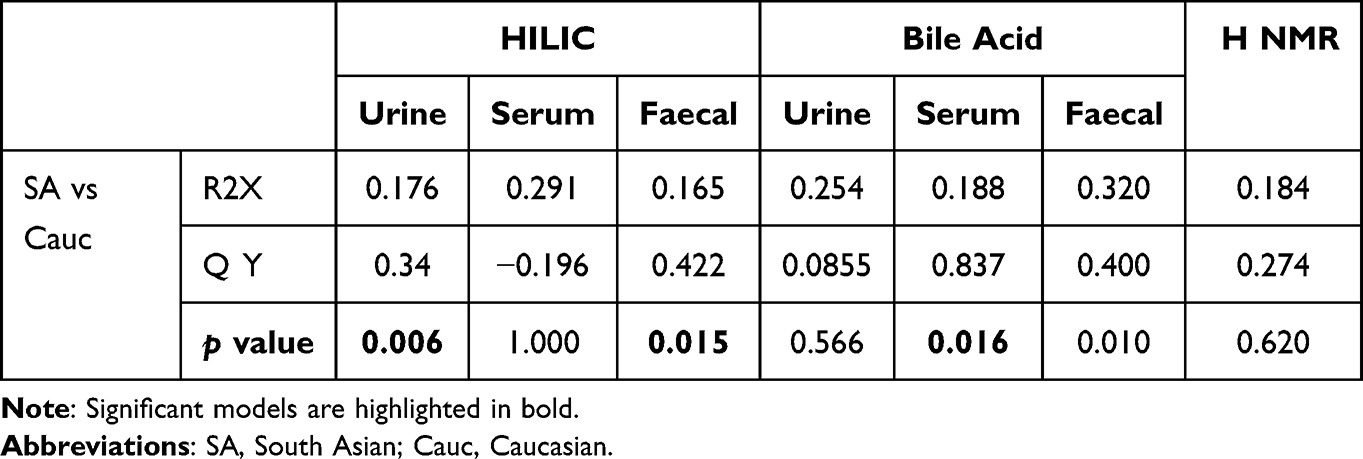 |
Table 2 Metabolic Variation Between Asians and Caucasian UC Groups at Diagnosis (Timepoint 1) (TP1) |
 |
Figure 5 Orthogonal-projection to latent structure- discriminant analysis model of ethnicity in Faecal BA (A) and HILIC (B) assay at diagnosis (Timepoint 1). Abbreviations: SA, South Asian; Cauc, Caucasian. |
Disease Severity, Disease Phenotype and Diet at Baseline
Neither disease phenotype nor activity affected bacterial relative abundance (Supplementary Figure 6). Dietary intake at diagnosis for broad food groups were analysed with metataxonomic data at phylum, family and genus levels. No differences were noted in bacterial relative abundance at diagnosis (Timepoint 1) in high or low intake of fibre, fat, protein and Vegetarian or Non-vegetarian groups (Supplementary Table 8). The PCA plots for fat and protein at the family level are shown in Supplementary Figure 7.
Disease severity and phenotype were studied in all biological compartments at Timepoint 1 (Supplementary Table 9). Supervised analysis of faecal bile acids showed separation of mild disease, whilst HILIC shows separation of severe disease although neither model is predictive (p=1.00 and p=1.00) (Figure Supplementary Figure 8). Disease phenotype shows separation of pan-colonic disease without a significant relationship on multivariate analysis (p=1.00).
Discussion
In this cohort study of newly diagnosed ulcerative colitis, we found significant microbial and metabonomic differences between South Asians and Caucasian across three biofluids (serum, urine and faeces) through both metataxonomic and metabonomic platforms. This is the first study to describe ethnic associated metabonomic profiles in UC to gain deeper insight into complex host-microbiome-metabolome interaction.
Several studies in both Crohn’s disease and UC populations have consistently reported lower diversity or species richness compared with controls.35,36 In contrast, there is a recognised inconsistency for bacterial abundance in IBD vs controls across studies that highlights the need to consolidate the diverse methodology tools. Likewise, ethnic, migrant and racial differences in microbial composition are recognised in healthy African American, Hispanics, Cubans, Thai migrants and South Asians living in Europe and North America.10,37 Few studies extended examination to compare populations with ethnic IBD. Mar et al, found less bacterial diversity in stool samples from 12 South Asian UC patients compared with three healthy matched controls, a difference that persisted when comparing with Caucasian UC patients consistent with the findings in our study.11 Our observed South Asians lower relative bacterial diversity persisted even after analysis was adjusted for the higher observed disease activity, suggesting that changes occur independent of flares and the qPCR results deflected the possibility that the significantly higher bacterial loads in one group, may have arisen because of difference in relative abundance. The similar pattern observed in other ethnic groups further implicates ethnicity in microbial diversity such as East Asians (Chinese) living in Hong Kong and Australia with Australians.38
At a phylum level, higher relative abundance of Actinobacteria in South Asians and higher relative abundance of Firmicutes and Bacteroidetes in Caucasians have been shown in previous studies. A similar pattern for Firmicutes was observed in Indians living in India, whereas Bacteroidetes levels did not differ between in Indians and Europeans.39 Deeper taxonomic analysis in our population also revealed differences at family and genus levels, with increased Lactobacillus, Bifidobacterium and reduced Ruminococcus in South Asians. In contrast, a population living in India showed significantly lower Lactobacillus, Bifidobacterium, Ruminococcus and Bacteroides in UC compared with healthy people.40 Marked reduction of Bifidobacteria reported in 14 UC patients compared to healthy controls, further incriminates loss of protective Bifidobacteria in disease presentation either driving active UC or a consequence of active UC.41 Country of residence, nature of sample (biopsy or stool) and disease activity (remission) may explain divergence between studies.39
The most relevant metabonomic findings are urine discriminatory metabolites and bile acids. 1H NMR profiling in UC patients revealed differences in hippurate, 4-cresol sulfate and lactate between ethnic groups. Hippurate is predominantly formed by hepatic glycine conjugation of dietary and gut microbial-derived benzoate, and hippurate excretion dependent on gut bacteria.42,43 A strong positive correlation with Ruminococcus, a member of the Firmicutes phylum, and Rikenellaceae (Bacteroidetes phylum), suggesting a role of these organisms in hippurate metabolism. Anaerobic bacteria in the distal gut, particularly Clostridium spp are responsible for catabolism of tyrosine, a protein-derived aromatic amino acid, to 4-cresol sulfate.44,45 The significantly lower 4-cresol sulfate levels observed in South Asians may be due to co-existing lower Clostridiales levels. The association between significantly higher levels of lactate and Bifidobacterium in our South Asian cohort, is similar to other studies reporting lactate production by Bifidobacterium.46 Higher lactate levels have previously also been associated with disease activity in UC.17 We found higher SCCAI scores in our South Asian group and a significantly higher proportion on steroids (18.5% vs 0.4%, p<0.0001). Comparison of paired samples in remission and flare, failed to demonstrate any discernible differences. Likewise, previous study of 15 Crohn’s disease patients and four UC in remission and relapse, found no significant differences in urine samples targeted at hippurate, formate and 4-cresol sulfate supporting the lack of association between active disease and these metabolites levels.47 We deduced that differential lactate and Bifidobacterium observations are associated with South Asian ethnicity.
The bile acid assay results indicate altered luminal bile acid metabolism, and we correlated these findings with bacterial enzymatic activity. Conjugated bile acids were significantly increased in South Asian faecal samples. A biologically plausible explanation is a loss of bacterial bile salt hydrolases to deconjugate bile acid prior to production of secondary bile acids. Bile salt hydrolase activity has previously been reported in Bacteroidetes, which were reduced in our South Asian population.48 Imbalance between primary and conjugated bile acids with pro-inflammatory actions and secondary bile acids with anti-inflammatory effect exemplifies the importance of correlating microbial functional activity with clinical outcomes, which in this context may reflect the disease activity in South Asians.49 The overall secondary bile acid concentration did not differ between Caucasian and South Asian UC patients, instead there were differences for specific secondary bile acids: lithocholic acid, isolithocholic acid and 3a-hydroxy-12 ketolithocholic levels were all significantly lower in South Asian UC patients. This is also likely to reflect the bacterial enzyme pool of hydroxysteroid dehydrogenase (HSDH) enzymes catalyse lithocholic acid to isolithocholic acid and 3a-hydroxy-12 ketolithocholic acid. HSDH enzymes are widespread among members of the Clostridia class including Ruminococcus.50 Our correlation matrix showed positive correlation with Ruminococcus and Lachnospiraceae both members of the phylum Firmicutes and order Clostridiales.
HILIC and bile acids UPLC-MS assays analysis demonstrated significant changes in metabonomic profile according to ethnicity. Only the faecal samples provided consistent discrimination across HILIC and bile acid assays. HILIC profiling identified over 1800 metabolic features which were significantly different across all sample types however only a few were tentatively assigned. Pantothenic acid (Vitamin B5) was successfully validated against standards with a higher concentration in faeces from Caucasian than SA patients with UC. Most Fusobacterium (Fusobacteria) and Bifidobacterium spp. (Actinobacteria) lack the vitamin B5 biosynthesis pathway, and as predominant organisms in South Asians may explain the lower concentrations.
The strengths of our study are recruitment of a newly diagnosed cohort living within the same geographic region, controlling for two known confounders namely disease duration and geographic influences. Our study is the first to show ethnic metabonomic diversity in UC, corrected for dietary factors, highlighting the role of differential gut microbial metabolism between ethnic populations. The role of ethnicity is supported by extension of differences in faecal HILIC and bile acid analysis in the healthy South Asians and Caucasians.
This was a pilot study therefore the small size of the UC cohort and healthy non-IBD control population risk an underpowered analysis. The data was corrected for diet, disease distribution severity but not for age and sex which we recognise as a limitation. The application of 16S RNA techniques instead of more sophisticated metagenomic shotgun techniques, may be construed as a weakness. However, we argue that most of the previous research on ethnic populations for comparison used these techniques and we were interested in advancing knowledge by correlating the findings metabolomic alterations to show extension to functional diversity. FFQs were only completed at diagnosis an approach that may have failed to capture effects of dietary changes incurred by a diagnosis of IBD.51
The microbiome-metabolomic axis confers therapeutic implications with relevance to ethnicity. Detrimental effects of high concentrations of primary conjugated bile acids and conjugated bile acids may be counterbalanced by binding primary conjugated bile acids with cholestyramine, whilst benefits of anti-inflammatory secondary bile acids enhanced by direct bile acid replacement or their bacterial synthetic enzymes.14 Microbial butyrate synthesis has been shown to predict response to azathioprine in Crohn’s disease.22 Such findings may be relevant for South Asians where genetic allele polymorphisms determine safety of azathioprine.52 Others have shown that anti-TNF responses in Crohn’s disease are determined by microbial status21 which may explain recent findings of poor response to anti-TNF therapy in a South Asian sub-group.53
In this study, we support previous findings of microbial differences in ethnic groups and describe new metabonomic findings in South Asians with ulcerative colitis. The majority of South Asians were second generation residents living in the same area as their Caucasian counterparts with similar diets on FFQs. Yet South Asians with UC presented with more severe disease suggesting a more complex gene-environment interaction that warrants further research to identify risk determinants. Such studies should examine microbe-metabolites across time points correlated for disease activity to investigate whether the profiles reflect a cause or effect of disease activity.
Data Sharing Statement
The data underlying this article will be shared on reasonable request to the corresponding author.
Funding
St. Mark’s Hospital Foundation.
Disclosure
Dr Naila Arebi reports grants from St Mark’s Foundation, during the conduct of the study; personal fees from Janssen, grants from Pfizer, personal fees from Takeda, outside the submitted work. The authors report no other conflicts of interest in this work.
References
1. Chang JT. Pathophysiology of inflammatory bowel diseases. N Engl J Med. 2020;383(27):2652–2664. doi:10.1056/NEJMra2002697
2. Khor B, Gardet A, Xavier RJ. Genetics and pathogenesis of inflammatory bowel disease. Nature. 2011;474(7351):307–317. doi:10.1038/nature10209
3. Ng SC, Shi HY, Hamidi N, et al. Worldwide incidence and prevalence of inflammatory bowel disease in the 21st century: a systematic review of population-based studies. Lancet. 2017;390(10114):2769–2778. doi:10.1016/S0140-6736(17)32448-0
4. Shi HY, Levy AN, Trivedi HD, Chan FKL, Ng SC, Ananthakrishnan AN. Ethnicity influences phenotype and outcomes in inflammatory bowel disease: a systematic review and meta-analysis of population-based studies. Clin Gastroenterol Hepatol. 2018;16(2):190–197.e11. doi:10.1016/j.cgh.2017.05.047
5. Bodiwala V, Marshall T, Das KM, Brant SR, Seril DN. Comparison of disease phenotypes and clinical characteristics among south asian and white patients with inflammatory bowel disease at a tertiary referral center. Inflamm Bowel Dis. 2020;26(12):1869–1877. doi:10.1093/ibd/izaa019
6. Jangi S, Ruan A, Korzenik J, de Silva P. South Asian patients with inflammatory bowel disease in the United States demonstrate more fistulizing and perianal Crohn phenotype. Inflamm Bowel Dis. 2020;26(12):1933–1942. doi:10.1093/ibd/izaa029
7. Misra R, Faiz O, Munkholm P, Burisch J, Arebi N. Epidemiology of inflammatory bowel disease in racial and ethnic migrant groups. World J Gastroenterol. 2018;24(3):424–437. doi:10.3748/wjg.v24.i3.424
8. Spekhorst LM, Severs M, de Boer NKH, et al. The impact of ethnicity and country of birth on inflammatory bowel disease phenotype: a prospective cohort study. J Crohns Colitis. 2017;11(12):1463–1470. doi:10.1093/ecco-jcc/jjx098
9. Stearns JC, Zulyniak MA, de Souza RJ, et al. Ethnic and diet-related differences in the healthy infant microbiome. Genome Med. 2017;9(1):32. doi:10.1186/s13073-017-0421-5
10. Vangay P, Johnson AJ, Ward TL, Kashyap PC, Culhane-Pera KA. US immigration westernizes the human gut microbiome. Cell. 2018;175:962–972.e10. doi:10.1016/j.cell.2018.10.029
11. Mar JS, LaMere BJ, Lin DL, et al. Disease severity and immune activity relate to distinct interkingdom gut microbiome states in ethnically distinct ulcerative colitis patients. MBio. 2016;7(4):e01072–16. doi:10.1128/mBio.01072-16
12. Dorrestein PC, Mazmanian SK, Knight R. Finding the missing links among metabolites, microbes, and the host. Immunity. 2014;40(6):824–832. doi:10.1016/J.IMMUNI.2014.05.015
13. Zhuang X, Li T, Li M, et al. Systematic review and meta-analysis: short-chain fatty acid characterization in patients with inflammatory bowel disease. Inflamm Bowel Dis. 2019;25(11):1751–1763. doi:10.1093/ibd/izz188
14. Li N, Zhan S, Tian Z, et al. Alterations in bile acid metabolism associated with inflammatory bowel disease. Inflamm Bowel Dis. 2021;27(9):1525–1540. doi:10.1093/ibd/izaa342
15. Marchesi JR, Holmes E, Khan F, et al. Rapid and noninvasive metabonomic characterization of inflammatory bowel disease. J Proteome Res. 2007;6(2):546–551. doi:10.1021/pr060470d
16. De Preter V, Machiels K, Joossens M, et al. Faecal metabolite profiling identifies medium-chain fatty acids as discriminating compounds in IBD. Gut. 2015;64(3):447–458. doi:10.1136/gutjnl-2013-306423
17. Bjerrum JT, Wang Y, Hao F, et al. Metabonomics of human fecal extracts characterize ulcerative colitis, Crohn’s disease and healthy individuals. Metabolomics. 2015;11(1):122–133. doi:10.1007/s11306-014-0677-3
18. Duboc H, Rajca S, Rainteau D, et al. Connecting dysbiosis, bile-acid dysmetabolism and gut inflammation in inflammatory bowel diseases. Gut. 2013;62(4):531–539. doi:10.1136/gutjnl-2012-302578
19. O’Keefe SJD, V. LJ, Lahti L, et al. Fat, fibre and cancer risk in African Americans and rural Africans. Nat Commun. 2015;6(1):6342. doi:10.1038/ncomms7342
20. Agrawal M, Burisch J, Colombel JF, Shah CS. Viewpoint: inflammatory bowel diseases among immigrants from low- to high-incidence countries: opportunities and considerations. J Crohns Colitis. 2020;14(2):267–273. doi:10.1093/ecco-jcc/jjz139
21. Ding NS, McDonald JAK, Perdones-Montero A, et al. Metabonomics and the gut microbiome associated with primary response to anti-TNF therapy in Crohn’s disease. J Crohns Colitis. 2020;14(8):1090–1102. doi:10.1093/ecco-jcc/jjaa039
22. Effenberger M, Reider S, Waschina S, et al. Microbial butyrate synthesis indicates therapeutic efficacy of azathioprine in IBD patients. J Crohns Colitis. 2020;2021:88–98. doi:10.1093/ecco-jcc/jjaa152
23. Vind I, Riis L, Jess T, et al. Increasing incidences of inflammatory bowel disease and decreasing surgery rates in copenhagen city and county, 2003–2005: a population-based study from the danish crohn colitis database. Am J Gastroenterol. 2006;101(6):1274–1282. doi:10.1111/j.1572-0241.2006.00552.x
24. Higgins PDR, Schwartz M, Mapili J, et al. Patient defined dichotomous end points for remission and clinical improvement in ulcerative colitis. Gut. 2005;54:782–788. doi:10.1136/gut.2004.056358
25. Wu GD, Chen J, Hoffmann C, et al. Linking long-term dietary patterns with gut microbial enterotypes. Science. 2011;334(6052):105–108. doi:10.1126/science.1208344
26. David LA, Maurice CF, Carmody RN, et al. Diet rapidly and reproducibly alters the human gut microbiome. Nature. 2014;505(7484):559–563. doi:10.1038/nature12820
27. Waijers PMCM, Feskens EJM, Ocké MC. A critical review of predefined diet quality scores. Br J Nutr. 2007;97(2):219–231. doi:10.1017/S0007114507250421
28. McDonald JAK, Mullish BH, Pechlivanis A, et al. Inhibiting growth of clostridioides difficile by restoring valerate, produced by the intestinal microbiota. Gastroenterology. 2018;155(5):1495–1507.e15. doi:10.1053/j.gastro.2018.07.014
29. Ilumina I. Microbial sequencing methods; 2018. Available from: https://support.illumina.com/content/dam/illumina-support/documents/documentation/chemistry_documentation/16s/16s-metagenomic-library-prep-guide-15044223-b.pdf.
30. Parks DH, Tyson GW, Hugenholtz P, Beiko RG. STAMP: statistical analysis of taxonomic and functional profiles. Bioinformatics. 2014;30(21):3123–3124. doi:10.1093/bioinformatics/btu494
31. Olivier C, Marc-Emmanuel D, Andrew C, et al. Statistical total correlation spectroscopy: an exploratory approach for latent biomarker identification from metabolic 1H NMR data sets. Anal Chem. 2005. doi:10.1021/AC048630X
32. Miao Z, Jin M, Liu X, et al. The application of HPLC and microprobe NMR spectroscopy in the identification of metabolites in complex biological matrices. Anal Bioanal Chem. 2015;407(12):3405–3416. doi:10.1007/s00216-015-8556-y
33. Bouatra S, Aziat F, Mandal R, et al. The human urine metabolome. PLoS One. 2013;8(9):e73076. doi:10.1371/journal.pone.0073076
34. Ma L, Chung WK. Quantitative analysis of copy number variants based on real-time LightCycler PCR. Curr Protoc Hum Genet. 2014;80:
35. Manichanh C, Rigottier-Gois L, Bonnaud E, et al. Reduced diversity of faecal microbiota in Crohn’s disease revealed by a metagenomic approach. Gut. 2006;55:205–211. doi:10.1136/gut.2005.073817
36. Martinez C, Antolin M, Santos J, et al. Unstable composition of the fecal microbiota in ulcerative colitis during clinical remission. Am J Gastroenterol. 2008;103(3):643–648. doi:10.1111/j.1572-0241.2007.01592.x
37. Brooks AW, Priya S, Blekhman R, Bordenstein SR. Gut microbiota diversity across ethnicities in the United States. PLOS Biol. 2018;16(12):e2006842. doi:10.1371/journal.pbio.2006842
38. Prideaux L, Kang S, Wagner J, et al. Impact of ethnicity, geography, and disease on the microbiota in health and inflammatory bowel disease. Inflamm Bowel Dis. 2013;19(13):2906–2918. doi:10.1097/01.MIB.0000435759.05577.12
39. Rehman A, Rausch P, Wang J, et al. Geographical patterns of the standing and active human gut microbiome in health and IBD. Gut. 2015;65:238–248. doi:10.1136/gutjnl-2014-308341
40. Verma R, Verma AK, Ahuja V, Paul J. Real-time analysis of mucosal flora in patients with inflammatory bowel disease in India. J Clin Microbiol. 2010;48(11):4279–4282. doi:10.1128/JCM.01360-10
41. Kato K, Mizuno S, Umesaki Y, et al. Randomized placebo-controlled trial assessing the effect of bifidobacteria-fermented milk on active ulcerative colitis. Aliment Pharmacol Ther. 2004;20(10):1133–1141. doi:10.1111/j.1365-2036.2004.02268.x
42. Williams HR, Cox IJ, Walker DG, et al. Differences in gut microbial metabolism are responsible for reduced hippurate synthesis in Crohn’s disease. BMC Gastroenterol. 2010;10(1):108. doi:10.1186/1471-230X-10-108
43. Nicholls AW, Mortishire-Smith RJ, Nicholson JK. NMR spectroscopic-based metabonomic studies of urinary metabolite variation in acclimatizing germ-free rats. Chem Res Toxicol. 2003;16(11):1395–1404. doi:10.1021/tx0340293
44. Bone E, Tamm A, Hill M. The production of urinary phenols by gut bacteria and their possible role in the causation of large bowel cancer. Am J Clin Nutr. 1976;29(12):1448–1454. doi:10.1093/ajcn/29.12.1448
45. Smith EA, Macfarlane GT. Enumeration of human colonic bacteria producing phenolic and indolic compounds: effects of pH, carbohydrate availability and retention time on dissimilatory aromatic amino acid metabolism. J Appl Bacteriol. 1996;81(3):288–302. doi:10.1111/j.1365-2672.1996.tb04331.x
46. Ventura M, Delgado S, O’ Callaghan A, Van Sinderen D. Bifidobacteria and their role as members of the human gut microbiota. Front Microbiol. 2016;7. doi:10.3389/fmicb.2016.00925
47. Williams HRT, Cox IJ, Walker DG, et al. Characterization of inflammatory bowel disease with urinary metabolic profiling. Am J Gastroenterol. 2009;104(6):1435–1444. doi:10.1038/ajg.2009.175
48. Narushima S, Itoha K, Miyamoto Y, et al. Deoxycholic acid formation in gnotobiotic mice associated with human intestinal bacteria. Lipids. 2006;41(9):835–843. doi:10.1007/s11745-006-5038-1
49. Greve JW, Gouma DJ, Buurman WA. Bile acids inhibit endotoxin-induced release of tumor necrosis factor by monocytes: an in vitro study. Hepatology. 1989;10(4):454–458. doi:10.1002/hep.1840100409
50. Ridlon JM, Kang D-J, Hylemon PB. Bile salt biotransformations by human intestinal bacteria. J Lipid Res. 2006;47(2):241–259. doi:10.1194/jlr.R500013-JLR200
51. Limdi JK, Aggarwal D, McLaughlin JT. Dietary practices and beliefs in patients with inflammatory bowel disease. Inflamm Bowel Dis. 2015;22(1):164–170. doi:10.1097/MIB.0000000000000585
52. Walker GJ, Harrison JW, Heap GA, et al. Association of genetic variants in NUDT15 with thiopurine-induced myelosuppression in patients with inflammatory bowel disease. JAMA. 2019;321(8):753–761. doi:10.1001/jama.2019.0709
53. Gadhok R, Gordon H, Sebepos-Rogers G, et al. UK patients of bangladeshi descent with crohn’s disease respond less well to TNF antagonists than caucasian patients. Dig Dis Sci. 2020;65(6):1790–1799. doi:10.1007/s10620-019-05907-w
 © 2022 The Author(s). This work is published and licensed by Dove Medical Press Limited. The
full terms of this license are available at https://www.dovepress.com/terms
and incorporate the Creative Commons Attribution
- Non Commercial (unported, 3.0) License.
By accessing the work you hereby accept the Terms. Non-commercial uses of the work are permitted
without any further permission from Dove Medical Press Limited, provided the work is properly
attributed. For permission for commercial use of this work, please see paragraphs 4.2 and 5 of our Terms.
© 2022 The Author(s). This work is published and licensed by Dove Medical Press Limited. The
full terms of this license are available at https://www.dovepress.com/terms
and incorporate the Creative Commons Attribution
- Non Commercial (unported, 3.0) License.
By accessing the work you hereby accept the Terms. Non-commercial uses of the work are permitted
without any further permission from Dove Medical Press Limited, provided the work is properly
attributed. For permission for commercial use of this work, please see paragraphs 4.2 and 5 of our Terms.