Back to Journals » Diabetes, Metabolic Syndrome and Obesity » Volume 16
Ethnic Variability in Glucose and Insulin Response to Rice Among Healthy Overweight Adults: A Randomized Cross-Over Study
Authors Sadiya A ![]() , Jakapure V, Kumar V
, Jakapure V, Kumar V
Received 23 January 2023
Accepted for publication 10 March 2023
Published 9 April 2023 Volume 2023:16 Pages 993—1002
DOI https://doi.org/10.2147/DMSO.S404212
Checked for plagiarism Yes
Review by Single anonymous peer review
Peer reviewer comments 2
Editor who approved publication: Professor Gian Paolo Fadini
Amena Sadiya,1 Vidya Jakapure,2 Vijay Kumar3
1Lifestyle Clinic, Rashid Centre for Diabetes and Research, Sheikh Khalifa Medical City Ajman, Ajman, United Arab Emirates; 2Research Department, Sheikh Khalifa Medical City Ajman, Ajman, United Arab Emirates; 3Laboratory, Sheikh Khalifa Medical City Ajman, Ajman, United Arab Emirates
Correspondence: Amena Sadiya, Rashid Centre for Diabetes and Research, Sheikh Khalifa Medical City Ajman, PO Box-5166, Ajman, United Arab Emirates, Email [email protected]
Background: The influence of ethnicity on postprandial glucose and insulin responses has been reported earlier and rice is a major contributor to the overall glycaemic load of Asian and Arab diets. This study aims to compare postprandial glycaemic and insulinaemic responses to rice among healthy overweight Asian, Arab and European participants.
Methods: In a randomized crossover design, 47 healthy overweight participants (23 Asian, 16 Arab, and 8 European) consumed 75 grams of glucose beverage or ate 270 grams of cooked basmati rice (75 g of available carbohydrate) on two separate occasions, separated by a one 1-week washout period. Blood glucose and insulin levels were determined at fasting 0 (fasting), 30, 60, and 120 minutes and used to determine the incremental area under the curve (iAUC).
Results: The three groups were matched on body mass index and gender. Although no differences were noted statistically in most clinical features, a wide range of variation was noted in age, systolic, diastolic blood pressure. The fasting blood glucose and insulin levels were highest among Asians, followed by Arabs and Europeans (p < 0.01). According to the HOMA-IR test and the Matsuda index, Asians have a higher insulin resistance than Arabs or Europeans when consuming a glucose beverage (p < 0.001) and rice (p < 0.01). Postprandial glucose and insulin responses to glucose beverage did not differ between ethnic groups (p = 0.28; p = 0.10). Based on an unadjusted regression model, European participants had significantly lower iAUC-glucose (p = 0.02) and iAUC-insulin (p = 0.01) after rice consumption than Asian participants. In the adjusted model, the difference between the two groups remained for iAUC-insulin (p = 0.04) but not for iAUC-glucose (p = 0.07).
Conclusion: Our study found that ethnic differences exist among healthy overweight adults in terms of insulin resistance, glycaemic response and insulinaemic response to rice. As a result of their high insulin resistance, Asian participants had a higher postprandial insulin spike than Europeans after eating rice. These findings could have substantial implications for nutrition recommendations based on ethnicity, particularly for Asians.
Keywords: type 2 diabetes, rice, postprandial glucose, insulin, Asian, Arab, European, ethnic
Introduction
Over the past few decades, the prevalence of type 2 diabetes (T2D) has multiplied many-fold worldwide.1 This trend has been particularly evident in certain ethnic groups, such as Asians and Arabs.2,3 Type 2 diabetes is commonly attributed to the overconsumption of energy and the accumulation of excess body fat, but evidence indicates that specific foods with certain adverse effects may contribute directly to its development.4–6
A better understanding of the pathophysiological consequences of postprandial hyperglycaemia in normoglycaemic individuals is increasingly vital in order to prevent T2D. High plasma glucose levels after 2 hours is associated with an increased risk of developing T2D in healthy normoglycaemic individuals.7 According to De Fronzo, insulin resistance and progressive pancreatic β-cell dysfunction are identified as key components in the pathogenesis of T2D.8 The large increment in glucose concentration induced by food with a high glycaemic index (GI) often exaggerates the body’s anabolic responses, which facilitates the overproduction of insulin and eventually results in pancreatic β-cell failure, increasing the risk of T2D.9
A recent meta-analysis and systematic reviews have indicated increased risk of T2D with white rice consumption in the Asian population.10,11 It is shown that the glycemic response to carbohydrate-containing food may differ in people of different ethnicities.12 Previous studies have shown that identical carbohydrate loads elicit 2–3-fold higher postprandial glucose peaks in Asians compared to Caucasians, contributing to its role in the increased predisposition to T2D.13
The United Arab Emirates (UAE) is a diverse amalgamation of different ethnicities, with around 20% Emiratis (UAE nationals) and the remainder as non-UAE immigrants from different Arab and non-Arab ethnic backgrounds (Asians and Westerners).14 The International Diabetes Federation, states that the prevalence of T2D in the UAE is growing faster than in the rest of the Middle East and North Africa, and is projected to double by the year 2040.1 According to Hamoudi et al, Emiratis comprise the highest percentage of people with pre-diabetes in the UAE (17%), followed by Asians (16%) and Arab non-nationals (14%).15 In addition to genetic predisposition, lifestyle choices significantly impact insulin resistance; and migration of ethnic populations to urbanized lifestyles could also contribute to alterations in glucose and insulin metabolism.16
In Asian and Arab cultures, rice is commonly consumed as a staple carbohydrate, providing up to two-thirds of the daily energy intake especially in Indian and Emirati dietary patterns making it a major contributor to overall glycaemic load in the diet.11,17 Furthermore, evidence indicates that rice consumption, particularly white rice, may contribute to the deterioration of glucose metabolism, which may result in an increased risk of T2D.11,18
There is no conclusive evidence that postprandial glycaemic and insulinaemic responses to rice differ between ethnic groups. Asians, Arabs and Europeans make up the majority of the UAE’s population and we have not found any studies that compare these three ethnic groups. Hence, this is the first study that aims to examine the impact of ethnicity on postprandial glycaemic and insulinaemic responses to rice among healthy overweight Asians, Arabs and Europeans living in the UAE.
Methodology
Participants
A total of 47 healthy volunteers (23 self-identified Asians, 16 Arabs and 8 Europeans) were recruited from the Rashid Centre for Diabetes and Research, Sheikh Khalifa Medical City Ajman, United Arab Emirates during April to August 2022. We screened 78 participants for the following inclusion criteria: ethnicity (both parents of the same ethnicity); age, 18–50 years; body mass index (BMI), 25–29.9 kg/m2 (overweight); fasting blood glucose, < 6mmol/l; and prepared to adhere to the study protocol. Participants were excluded if they were on medications affecting glucose metabolism, on antibiotics for the last three weeks, had a recent weight change of more than 5% in the last three months or were diagnosed with any form of diabetes, untreated hypertension, renal impairment, gastrointestinal problems or post-bariatric/known eating disorders. Randomization was implemented by the study nurse using a computerized sequence generation.
This study complied with the Helsinki Declaration and was approved by the Research Ethics Committee of the Ministry of Health and Prevention, United Arab Emirates (Reference: MOHAP/DXB-REC/NDJ/No.53 2019). The protocol was registered on ClinicalTrials.gov (NCT05336032, 20/04/2022).
The study design was a randomized crossover open-label trial that compared the postprandial glucose and insulin responses to a test meal of basmati rice (providing 75 g of available carbohydrate, as calculated using the manufacturer’s data) against the control (75 g of glucose beverage), separated by a washout period of one week among the three ethnic groups.
Procedures
All volunteers gave informed consent for participation in the study. During the initial screening session, anthropometric measurements, demographic data and a health questionnaire (involving medical history, food allergies, weight loss history, medications, smoking, alcohol and the previous day’s meal) were collected. Fat mass and lean body mass were determined from body composition analysis through bioelectrical impedance using the Tanita-MC 780 MA instrument (Tokyo, Japan) under standardized conditions. Blood pressure, BMI and waist circumference were recorded using standard clinical procedures. Participants reported a 24-hour dietary recall and physical activity pattern for the previous day.
The day before the test visit, participants were reminded to avoid alcohol consumption, to refrain from physical activity and to consume their usual meals. This was to ensure standardized conditions on the day of each test visit. Participants were required to fast for 12 hours prior to each test visit.
On the test day, an oral glucose tolerance test (OGTT) with 75 g of oral glucose in 10 oz of water (Azer Scientific, Morgantown, USA) was administered, and blood samples were collected at 0 (fasting), 30, 60 and 120 minutes. Seven days later, the participants returned for a test meal of 270 g of cooked basmati (providing 75 g of available carbohydrate, as calculated using the manufacturer’s data). The rice (Dawat Basmati; 92 g of raw rice) was boiled for 10 minutes with 180 mL of water to give 270 g of cooked rice, served with a choice of salt, garlic salt and chili flakes for flavour.
Analysis and Measurements
During each test session, an 8-mL antecubital venous blood sample was collected at 0 (fasting), 30, 60 and 120 min. We measured plasma glucose using the hexokinase-mediated reaction method and serum insulin using the human insulin immunoassay. The area under the curve (AUC) and incremental area under the curve (iAUC) for plasma glucose and insulin were calculated using the trapezoid rule, ignoring the area below the baseline.19 The simple insulin resistance index (HOMA-IR), whole-body insulin sensitivity index (Matsuda index) and islet β-cell function [insulinogenic index (IGI) and HOMA-β] were calculated through the following equations:  ;
;  ;
;  ; and
; and  .20,21
Statistical Analysis
All measured parameters are expressed as the mean ± standard deviation. Differences between the ethnic groups were ascertained by one-way ANOVA and the Kruskal–Wallis test after checking normality with Bonferroni correction. The primary outcome of this study was the glycaemic and insulinaemic response (iAUC) to rice compared to glucose in the three ethnic groups. A power analysis based on previous findings showed that 15 participants in each group gave a power of at least 80% (β = 0.80) to detect a difference in iAUC-glucose of 50 U (α = 0.05). Intention to treat analyses is done to avoid the effects of crossover and dropout. Multiple regression analyses were carried out to model iAUC-glucose and iAUC-insulin in terms of other variables, with a stepwise analysis used to identify potentially useful predictors. The data were analysed with Stata Statistical Software Release 13 (StataCorp LP; College Station, TX).
Results
Table 1 presents the baseline characteristics of participants in each ethnic group. The Asian group (n = 23) included 22 Indians and one Pakistani, the Arab group (n = 16) included 12 Emiratis, two Syrians and two Jordanians, while the European group (n = 8) included four Swedish, two Spanish and two English volunteers. Although no differences were noted statistically in most clinical features, a wide range of variation was noted in age, systolic/diastolic blood pressure and fasting blood glucose. The European group showed higher lean body mass compared to the other ethnic groups, although their BMI was not significantly different. The BMI cutoff for overweight was considered to be 25–29.9 kg/m2 for all ethnicities because population-based alterations could be a strong confounder in glucose metabolism. The assessment of 24-hour recall demonstrated that the three ethnic groups had distinct eating habits.
 |
Table 1 Baseline Characteristics of the Participants |
Postprandial Metabolic Responses
The changes in postprandial response to glucose beverage and rice over time (120 min) are evident in Figures 1 and 2. There was no significant difference between ethnic groups in postprandial blood glucose levels following the consumption of glucose beverage (AUC, p = 0.28). However, it is clear that rice showed lower postprandial glucose and insulin responses over time compared to glucose beverage. Interestingly, the Asian and Arab groups showed a monophasic postprandial glucose response curve (ie a gradual increase in glucose concentrations between 30 and 90 min until a peak is reached, followed by a subsequent decrease in glucose of ≥ 4.5 mg/dl) compared to European participants, who showed a biphasic OGTT glucose response curve (ie a second rise in glucose concentration of ≥ 4.5 mg/dl after the first decline in glucose).22
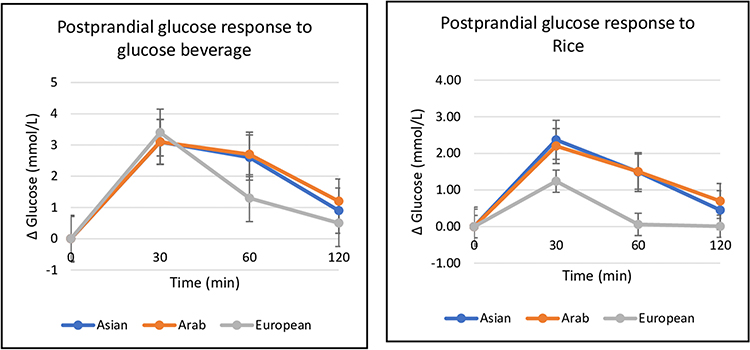 |
Figure 1 Ethnic variation in postprandial glucose response to glucose beverage and rice. |
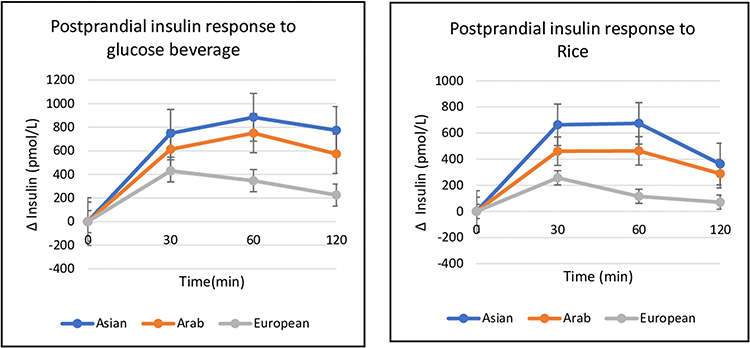 |
Figure 2 Ethnic variation in postprandial insulin response to glucose beverage and rice. |
There were no differences in postprandial glucose and insulin responses between ethnic groups as measured by iAUC-glucose and iAUC-insulin. Nevertheless, after consuming rice, the postprandial iAUC-glucose and iAUC-insulin levels were significantly different among the groups (p = 0.03; p = 0.01). Compared to the Asian and Arab groups, the European group had a significantly lower level of iAUC-glucose (Table 2).
 |
Table 2 Fasting and Post Prandial Metabolic Response to Glucose and Rice |
Insulin Resistance and Sensitivity
The results in Table 2 show that fasting glucose and insulin levels were within the normal range. However, the Asians recorded higher fasting glucose and insulin concentrations than the Arabs and Europeans (p < 0.01). Insulin resistance/sensitivity indices of the HOMA-IR and the Matsuda index showed significant differences between ethnic groups (p < 0.001). The HOMA-IR has a reasonable correlation with the hyperinsulinaemic–euglycaemic clamp (gold standard for assessing insulin sensitivity in humans) in several studies of distinct populations.23 The Asians had the highest insulin resistance, followed by the Arabs and Europeans. The Asians’ HOMA-IR was about double that of the Europeans (3.93 ± 1.87 vs 1.67 ± 0.26; p < 0.001). The Matsuda index, indicating the composite whole-body, including both hepatic and peripheral tissue insulin sensitivity, also showed a significant difference between the ethnic groups (p ≤ 0.01).
Indices of Pancreatic β-Cell Function
The IGI is used to quantify the β-cell response according to the change in plasma glucose and the HOMA-β is used as an index representing insulin resistance and β-cell function. We found that the IGI was higher when participants consumed rice compared to glucose beverage. It is reported that the β-cell function parameters were higher during a mixed-meal tolerance test compared to the OGTT, suggesting that the IGI is influenced by meal composition.24 In addition, the IGI varied significantly between the ethnicities with glucose beverage (p = 0.04): however, this variation was not evident with rice (p = 0.20). In healthy glucose-tolerant individuals, β-cells produce insulin in response to the prevailing insulin sensitivity to maintain plasma glucose levels within a narrow range. We observed that the HOMA-β was highest among Asians, followed by Arabs and Europeans, reflective of their insulin resistance order. However, the difference was not statistically significant (p = 0.07).
Ethnic Variation in Metabolic Response to Rice
A stepwise regression analysis was performed to investigate if ethnicity was an independent determinant of iAUC-glucose and iAUC-insulin on the consumption of rice (Table 3). The unadjusted regression model showed that, compared to the Asians, the European participants showed significantly lower iAUC-glucose (p = 0.02, β = –72.5, 95% CI [–133.3, –11.8]) and iAUC-insulin (p < 0.01, β = –33,003.7, 95% CI [–56,621, –9386.3]). However, after adjustment for known confounders of age, gender and BMI, we found that the effect was not statistically significant in iAUC-glucose (p = 0.07) but remained significant in iAUC-insulin (p = 0.04).
 |
Table 3 Multivariate Regression Analysis of iAUC-Glucose and iAUC-Insulin to Rice |
Discussion
In the present study, we report the postprandial glucose and insulin responses to glucose beverage and rice containing equal amounts of carbohydrate in healthy overweight Asians, Arabs and Europeans. The results showed that the postprandial glucose and insulin responses to glucose beverage were higher than to rice among all the ethnic groups, as evidenced in earlier reports.25 However, there were interesting observations of variation in the metabolic response to rice between the three ethnic groups.
Moreover, studies have shown that the shape of the glucose response curve identifies physiologically distinct groups of individuals with abnormalities in insulin secretion and insulin sensitivity.26 The Asian and Arab participants had a monophasic glucose response curve, indicating low insulin sensitivity and reduced β-cell function in comparison to European participants, who showed a biphasic curve. Moreover, it is reported that adults with a monophasic OGTT have an increased risk of future impaired fasting glucose (IFG) and T2D.22,27 Similar results have been reported earlier in healthy overweight Indian and European populations.28,29
The Asian participants had significantly higher fasting glucose levels than the Arabs (p = 0.02) and Europeans (p = 0.01); and these differences remained significant after adjusting for age, gender and BMI (p = 0.002). Fasting hyperglycaemia is associated with increased endogenous glucose production by gluconeogenesis (production of glucose by the liver) and glycogenolysis (breakdown of stored glycogen to glucose), even in normoglycaemic individuals. Balasubramanyam et al indicated that the factors that possibly regulate the rates of glycogenolysis differ significantly between different ethnic groups and contribute to increased genetic susceptibility to T2D in groups at higher risk.30 The fasting insulin levels also varied significantly between the ethnic groups; however, after adjusting for known confounders, the difference remained evident between Asians and Europeans (p = 0.004). These results are consistent with earlier reports in these ethnic groups.31,32 Fasting insulin is well known as a surrogate indicator of insulin resistance, which increases with an individual’s insulin resistance.33
We examined the insulin resistance/sensitivity and β-cell function indices in the three ethnic groups and our findings add to the body of evidence that ethnicity is one of the strongest indicators of glucose and insulin metabolism. It was observed that Asian participants had a higher HOMA-IR, indicating higher insulin resistance, compared with Arabs and Europeans. The effect of ethnicity on insulin resistance was evident (p = 0.001, adjusted R2 = 0.26) in the regression analysis after adjustment for gender, age, waist circumference and BMI. This showed that, compared to the Asian group, the HOMA-IR could be predicted as lower in Arabs (β = –1.2, SE = 0.61, p = 0.04) and Europeans (β = –2.5, SE = 0.78, p = 0.004). Similar results were reported earlier in several small studies utilizing the HOMA-IR as a surrogate marker of insulin resistance.34,35
Furthermore, ethnic variation was not evident in the HOMA-β (p = 0.07), indicating that although the difference in insulin resistance was substantial, the HOMA-β could not effectively evaluate the differences in islet cell function between the three groups. To maintain glucose homeostasis in glucose-tolerant subjects, a dynamic balance between insulin sensitivity and β-cell function is needed to keep plasma glucose levels within a relatively narrow physiological range.8 Therefore, the ability of the β-cells to cope with the prevailing degree of insulin resistance was assessed with the IGI (marker of early-phase insulin secretion). The IGI was higher when the participants consumed rice compared to glucose beverage, as reported previously with mixed meals,24 but it did not differ between ethnicities with rice. It is suggested that a robust insulin response in the early phase after a meal is crucial for promoting hepatic glycogen storage. This is also crucial for the suppression of hepatic glucose production. Reduced insulin resistance could explain a less robust insulin secretion capacity among European participants. No evidence of compensatory insulinaemia or detectable changes in the HOMA-β was observed in the Arab or European groups. It appears that ethnicity does not independently influence adaptive insulin release to plasma glucose stimulation with rice (early or total). However, earlier ethnic group research indicated that Asian-Americans are more insulin resistant compared to Caucasians and that their β-cells compensate for the resistance by secreting more insulin in the second-phase insulin response.36
The results showed that the postprandial glycaemic and insulinaemic responses (AUC) to rice were lower than to glucose beverage due to the apparent fact that rice carbohydrate is a complex carbohydrate whose assimilation is slower and less than that of liquid monosaccharide glucose molecules. The GI reflects the relative ability of carbohydrates to raise blood glucose. Studies on variation of the GI in different ethnicities have found that Asians show a higher GI compared to Caucasians for the same food. Wolver et al reported a higher GI for white bread among non-Caucasians compared to Caucasians.10
The adjusted regression model (Table 3) showed that although ethnicity was not an independent predictor of iAUC-glucose, it was a strong predictor of iAUC-insulin on consumption of rice. Similar results were reported earlier, where Asians showed a 63% higher glucose response to cereals compared to Caucasians.13 Another study compared the glycaemic responses to glucose and five rice varieties in people of European and Chinese ethnicity and concluded that the glycaemic responses of the Chinese participants to the five rice types were 60% greater than those of theEuropean participants.12 Wolver et al suggested that an ethnic difference in starch digestion may also account for the differences in glycaemic response.10
Our findings suggest that insulin resistance and impaired carbohydrate tolerance to rice (a significant portion of the daily diet) contribute to prolonged hyperglycaemia after meals among Asians and Arabs, thus adding to the phenotypic evidence for the progression of insulin resistance.37 Excessive glycaemia and/or insulin demand on a chronic basis may eventually affect insulin secretory capacity and precipitate T2D.
Furthermore, the rate of gastric emptying of carbohydrate-containing meals is demonstrated to correlate positively with postprandial glucose levels.38 Philips reported that rapid gastric emptying may be occurring in American Indians and Mexican Americans compared to non-Hispanic White populations. He suggested that the accelerated absorption of carbohydrates following rapid gastric emptying in these ethnic populations with high incidences of diabetes and impaired glucose tolerance could be a contributing factor to the increased risk of diabetes and metabolic syndrome.39
In addition, increased postprandial insulinaemia is reported to increase the risk of cardiovascular disease. Extrapolation from studies using the hyperinsulinaemic–euglycaemic clamp technique suggests that insulin, rather than glucose, is the main determinant of arterial stiffness in the postprandial state.40 Saeed et al reported that both South Asian and Middle-Eastern populations living in the West carry a significantly higher risk of diabetes and cardiovascular disease compared with native White Europeans, which is further exacerbated by poor lifestyle behaviours and socioeconomic factors.41
Nonetheless, these results must be interpreted with caution in light of some of the limitations of our study. The study did not record and control other physiological factors that might affect glucose homeostasis. Due to insufficient power and unequal sample sizes between groups, generalizability to the population should be considered with caution. Researchers cannot determine whether variation in insulin resistance is due to a genetic predisposition or lifestyle patterns specific to these ethnicities. This study indicated that normoglycaemic and overweight participants showed marked differences in their postprandial insulin response, and we could speculate with caution that this effect may be even more profound in people with obesity and diabetes because they are more likely to have abnormal carbohydrate and lipid metabolism.
Conclusion
Our study reveals ethnic differences in insulin resistance and glycaemic and insulinaemic responses to rice among healthy overweight adults. Asians showed a higher insulin resistance rate than Arab and European participants. Furthermore, European participants showed lower postprandial insulin responses after eating rice than Asians. These findings could have substantial implications for nutrition recommendations based on ethnic variation, particularly for Asians. Considering the high prevalence of pre-diabetes and T2D in Asian and Arab populations and rice’s status as a staple food, these findings may have significant clinical significance. Although rice is the major contributor to the glycaemic load of the diet, it is always consumed as a mixed meal. We recommend further studies to test mixed meals and variations among ethnicities to strengthen these implications.
Data Sharing Statement
The data used to support the findings of this study are restricted by the Ministry of Health and Prevention Research Ethics Committee–UAE, in order to protect patient privacy. Data are available from Amena Sadiya, [email protected] for researchers who meet the criteria for access to confidential data.
Informed Consent Statement
Written informed consent was obtained from all participants involved in the study.
Acknowledgment
The authors would like to acknowledge the contributions of Neethu Babu, for her kind contribution in patient recruitment; and Jamie Garica for assisting as a phlebotomist in blood collection. The authors would also like to express their appreciation to Sheikh Khalifa Medical City Ajman for providing them with financial support. Finally, we would like to thank all the participants for their time and willingness to participate in this study. We have drawn valuable conclusions from their contributions in understanding the topic.
Funding
Sheikh Khalifa Medical City Ajman funded this study. The funders had no role in designing, executing, analyzing, or writing the study.
Disclosure
The authors have no competing interests to declare.
References
1. Diabetes Atlas. International Diabetes Federation.
2. Yeboah J, Bertoni AG, Herrington DM, et al. Impaired fasting glucose and the risk of incident diabetes mellitus and cardiovascular events in an adult population: Mesa (Multi-ethnic study of atherosclerosis). J Am Coll Cardiol. 2011;58(2):140–146. doi:10.1016/j.jacc.2011.03.025
3. Chiu KC, Cohan P, Lee NP, et al. Insulin sensitivity differs among ethnic groups with a compensatory response in beta-cell function. Diabetes Care. 2000;23(9):1353–1358. doi:10.2337/diacare.23.9.1353
4. Popkin BM. Nutrition transition and the global diabetes epidemic. Curr Diab Rep. 2015;15(9):64.
5. Schwingshackl L, Schwedhelm C, Hoffmann G, et al. Food groups and risk of all-cause mortality: a systematic review and meta-analysis of prospective studies. Am J Clin Nutr. 2017;105(6):1462–1473. PMID: 28446499. doi:10.3945/ajcn.117.153148
6. Tan WS, Tan SY, Henry CJ. Ethnic variability in glycemic response to sucrose and isomaltulose. Nutrients. 2017;9(4):347. doi:10.3390/nu9040347
7. Abdul-Ghani MA, Williams K, DeFronzo R, et al. Risk of progression to type 2 diabetes based on relationship between postload plasma glucose and fasting plasma glucose. Diabetes Care. 2006;29(7):1613–1618. doi:10.2337/dc05-1711
8. DeFronzo RA. Pathogenesis of type 2 diabetes mellitus. Med Clin North Am. 2004;88(4):787–835, ix. PMID: 15308380. doi:10.1016/j.mcna.2004.04.013
9. Ceriello A. Postprandial hyperglycemia and diabetes complications: is it time to treat? Diabetes. 2005;54(1):1–7. doi:10.2337/diabetes.54.1.1
10. Wolever TM, Giddens JL, Sievenpiper JL. Effect of ethnicity on glycaemic index: a systematic review and meta-analysis. Nutr Diabetes. 2015;5(7):e170. PMID: 26168085; PMCID: PMC4521176. doi:10.1038/nutd.2015.21
11. Mohan V, Unnikrishnan R, Shobana S, et al. Are excess carbohydrates the main link to diabetes & its complications in Asians? Indian J Med Res. 2018;148(5):531–538. PMID: 30666980; PMCID: PMC6366262. doi:10.4103/ijmr.IJMR_1698_18
12. Kataoka M, Venn BJ, Williams SM, et al. Glycaemic responses to glucose and rice in people of Chinese and European ethnicity. Diabet Med. 2013;30(3):e101–e107. PMID: 23181689. doi:10.1111/dme.12080
13. Venn BS, Williams SM, Mann JI. Comparison of postprandial glycaemia in Asians and Caucasians. Diabet Med. 2010;27:1205–1208. doi:10.1111/j.1464-5491.2010.03069.x
14. Government of Dubai. Dubai statistics center; 2017. Available from: https://www.dsc.gov.ae/Report/DSC_SYB_2017_01%20_%2003.pdf.
15. Hamoudi R, Saheb Sharif-Askari N, Saheb Sharif-Askari F, et al. Prediabetes and diabetes prevalence and risk factors comparison between ethnic groups in the United Arab Emirates. Sci Rep. 2019;9(1):17437. PMID: 31767874; PMCID: PMC6877520. doi:10.1038/s41598-019-53505-7
16. Montesi L, Caletti MT, Marchesini G. Diabetes in migrants and ethnic minorities in a changing world. World J Diabetes. 2016;7(3):34–44. PMID: 26862371; PMCID: PMC4733447. doi:10.4239/wjd.v7.i3.34
17. Hwalla N, Jaafar Z, Sawaya S. Dietary management of type 2 diabetes in the MENA region: a review of the evidence. Nutrients. 2021;13(4):1060. PMID: 33805161; PMCID: PMC8064070. doi:10.3390/nu13041060
18. Hu EA, Pan A, Malik V, et al. White rice consumption and risk of type 2 diabetes: meta-analysis and systematic review. BMJ. 2012;344(mar15 3):e1454. doi:10.1136/bmj.e1454
19. Wolever TM. Effect of blood sampling schedule and method of calculating the area under the curve on validity and precision of glycaemic index values. Br J Nutr. 2004;91(2):295–301. PMID: 14756916. doi:10.1079/bjn20031054
20. Singh B, Saxena A. Surrogate markers of insulin resistance: a review. World J Diabetes. 2010;1(2):36–47. PMID: 21537426; PMCID: PMC3083884. doi:10.4239/wjd.v1.i2.36
21. Park SY, Gautier JF, Chon S. Assessment of insulin secretion and insulin resistance in human. Diabetes Metab J. 2021;45(5):641–654. doi:10.4093/dmj.2021.0220
22. Abdul-Ghani MA, Lyssenko V, Tuomi T, et al. The shape of plasma glucose concentration curve during OGTT predicts future risk of type 2 diabetes. Diabetes Metab Res Rev. 2010;26(4):280–286. doi:10.1002/dmrr.1084
23. Wallace TM, Levy JC, Matthews DR. Use and abuse of HOMA modeling. Diabetes Care. 2004;27(6):1487–1495. doi:10.2337/diacare.27.6.1487
24. Rijkelijkhuizen JM, Girman CJ, Mari A, et al. Classical and model-based estimates of beta-cell function during a mixed meal vs. an OGTT in a population-based cohort. Diabetes Res Clin Pract. 2009;83(2):280–288. PMID: 19097663. doi:10.1016/j.diabres.2008.11.017
25. Boers HM, Seijen Ten Hoorn J, Mela DJ. A systematic review of the influence of rice characteristics and processing methods on postprandial glycaemic and insulinaemic responses. Br J Nutr. 2015;114(7):1035–1045. PMID: 26310311; PMCID: PMC4579564. doi:10.1017/S0007114515001841
26. Kim JY, Michaliszyn SF, Nasr A, et al. The shape of the glucose response curve during an oral glucose tolerance test heralds biomarkers of type 2 diabetes risk in obese youth. Diabetes Care. 2016;39(8):1431–1439. doi:10.2337/dc16-0352
27. Manco M, Nolfe G, Pataky Z, et al. Shape of the OGTT glucose curve and risk of impaired glucose metabolism in the EGIR-RISC cohort. Metabolism. 2017;70:42–50. PMID: 28403944. doi:10.1016/j.metabol.2017.02.007
28. Hulman A, Gujral UP, Narayan KMV, et al. Glucose patterns during the OGTT and risk of future diabetes in an urban Indian population: the CARRS study. Diabetes Res Clin Pract. 2017;126:192–197. doi:10.1016/j.diabres.2017.01.009
29. de Andrade Mesquita L, Pavan Antoniolli L, Cittolin-Santos GF, et al. Distinct metabolic profile according to the shape of the oral glucose tolerance test curve is related to whole glucose excursion: a cross-sectional study. BMC Endocr Disord. 2018;18(1):56. PMID: 30115058; PMCID: PMC6097323. doi:10.1186/s12902-018-0286-7
30. Balasubramanyam A, McKay S, Nadkarni P, et al. Ethnicity affects the postprandial regulation of glycogenolysis. Am J Physiol Endocrinol Metab. 1999;5:E905–E914. doi:10.1152/ajpendo.1999.277.5.E905
31. Venkataraman K, Kao SL, Thai AC, et al. Ethnicity modifies the relation between fasting plasma glucose and HbA1c in Indians, Malays and Chinese. Diabet Med. 2012;29(7):911–917. PMID: 22283416; PMCID: PMC3504343. doi:10.1111/j.1464-5491.2012.03599.x
32. Herman WH, Ma Y, Uwaifo G, et al; Diabetes Prevention Program Research Group. Differences in A1C by race and ethnicity among patients with impaired glucose tolerance in the diabetes prevention program. Diabetes Care. 2007;30(10):2453–2457. PMID: 17536077; PMCID: PMC2373980. doi:10.2337/dc06-2003
33. Laakso M. How good a marker is insulin level for insulin resistance? AM J Epidemiol. 1993;137:959–965. doi:10.1093/oxfordjournals.aje.a116768
34. Dickinson S, Colagiuri S, Faramus E, et al. Postprandial hyperglycemia and insulin sensitivity differ among lean young adults of different ethnicities. J Nutr. 2002;132(9):2574–2579. PMID: 12221211. doi:10.1093/jn/132.9.2574
35. Liew CF, Seah ES, Yeo KP, et al. Lean, nondiabetic Asian Indians have decreased insulin sensitivity and insulin clearance, and raised leptin compared to Caucasians and Chinese subjects. Int J Obes Relat Metab Disord. 2003;27(7):e101–e107. PMID: 12821962. doi:10.1038/sj.ijo.0802307
36. Kodama K, Tojjar D, Yamada S, et al. Ethnic differences in the relationship between insulin sensitivity and insulin response: a systematic review and meta-analysis. Diabetes Care. 2013;36(6):1789–1796. doi:10.2337/dc12-1235
37. Thakarakkattil Narayanan Nair A, Donnelly LA, Dawed AY, et al. The impact of phenotype, ethnicity and genotype on progression of type 2 diabetes mellitus. Endocrinol Diabetes Metab. 2020;3(2):e00108. PMID: 32318630; PMCID: PMC7170456. doi:10.1002/edm2.108
38. Tongzhi W, Rayner CK, Young RL, et al. Gut motility and enteroendocrine secretion. Curr Opin Pharmacol. 2013;13(6):928–934. doi:10.1016/j.coph.2013.09.002
39. Philip WT. Gastric emptying in ethnic populations: possible relationship to development of diabetes and metabolic syndrome. Ethn Dis. 2006;16(3):682–692.
40. Westerbacka J, Wilkinson I, Cockcroft J, et al. Diminished wave reflection in the aorta. A novel physiological action of insulin on large blood vessels. Hypertension. 1999;33:1118–1122. doi:10.1161/01.HYP.33.5.1118
41. Saeed S, Kanaya AM, Bennet L, et al. Cardiovascular risk assessment in South and Middle-East Asians living in the Western countries. Pak J Med Sci. 2020;36(7):1719–1725. doi:10.1093/jn/132.9.2574
 © 2023 The Author(s). This work is published and licensed by Dove Medical Press Limited. The
full terms of this license are available at https://www.dovepress.com/terms
and incorporate the Creative Commons Attribution
- Non Commercial (unported, 3.0) License.
By accessing the work you hereby accept the Terms. Non-commercial uses of the work are permitted
without any further permission from Dove Medical Press Limited, provided the work is properly
attributed. For permission for commercial use of this work, please see paragraphs 4.2 and 5 of our Terms.
© 2023 The Author(s). This work is published and licensed by Dove Medical Press Limited. The
full terms of this license are available at https://www.dovepress.com/terms
and incorporate the Creative Commons Attribution
- Non Commercial (unported, 3.0) License.
By accessing the work you hereby accept the Terms. Non-commercial uses of the work are permitted
without any further permission from Dove Medical Press Limited, provided the work is properly
attributed. For permission for commercial use of this work, please see paragraphs 4.2 and 5 of our Terms.
Recommended articles
The Regulation of Metabolic Homeostasis by Incretins and the Metabolic Hormones Produced by Pancreatic Islets
Reed J, Bain SC, Kanamarlapudi V
Diabetes, Metabolic Syndrome and Obesity 2024, 17:2419-2456
Published Date: 13 June 2024
Level of Satisfaction Among Patients Using Insulin Administered by Pen vs Vial/Syringe. An Observational Prospective Study
Valladales-Restrepo LF, Delgado-Araujo AC, Oyuela-Gutiérrez MC, Ospina-Arzuaga HD, Machado-Alba JE
Patient Preference and Adherence 2025, 19:65-74
Published Date: 8 January 2025
Enhancing Diabetes Treatment: Comparing Pioglitazone/Metformin with Dapagliflozin Versus Basal Insulin/Metformin in Type 2 Diabetes
Lin Y, Shi J, Yu X, Sun J, Lixia S, Dou J, Zhang M, Li X, Tian Z, Deng H, Feng B, Su Q, Peng Y
Drug Design, Development and Therapy 2025, 19:1795-1808
Published Date: 12 March 2025