Back to Journals » Cancer Management and Research » Volume 11
Estrogen-dependent disruption of intracellular iron metabolism augments the cytotoxic effects of doxorubicin in select breast and ovarian cancer cells
Authors Bajbouj K ![]() , Shafarin J, Hamad M
, Shafarin J, Hamad M ![]()
Received 12 February 2019
Accepted for publication 16 April 2019
Published 23 May 2019 Volume 2019:11 Pages 4655—4668
DOI https://doi.org/10.2147/CMAR.S204852
Checked for plagiarism Yes
Review by Single anonymous peer review
Peer reviewer comments 2
Editor who approved publication: Dr Antonella D'Anneo
Khuloud Bajbouj,1 Jasmin Shafarin,1 Mawieh Hamad1,2
1Sharjah Institute for Medical Research, Sharjah, United Arab Emirates; 2Department of Medical Laboratory Sciences, University of Sharjah, Sharjah, United Arab Emirates
Introduction: Increased iron content in cancer cells is associated with resistance to chemotherapy. Recent studies have demonstrated that estrogen (E2) suppresses hepcidin synthesis and enhances intracellular iron efflux. Herein, we investigated whether E2-driven intracellular iron efflux renders cancer cells more susceptible to doxorubicin (Dox)-induced cytotoxicity.
Methods: Breast, ovarian, and liver cancer cell lines treated with E2, Dox, or a combination of both were assessed for intracellular iron status, mitochondrial function, cell cycle, and apoptosis.
Results: E2+Dox treatment in MCF7, SKOV3 and MDA-MB231 cells resulted in enhanced apoptosis compared with Dox-treated cells. Expression of γH2AX was significantly higher and that of survivin significantly lower in E2+Dox-treated cells than Dox-treated cells. At 48 hours, E2+Dox had induced a significant increase in the percentage of sub-G1 apoptotic cells, increased CHK1 expression, and decreased cyclin D1, CDK4, and CDK6 expression. Ferroportin and ferritin expression was significantly higher and that of TfR1 significantly lower in E2+Dox-treated cells than Dox-treated cells. Intracellular iron content was significantly reduced in E2+Dox-treated cells at 48 hours posttreatment. Lastly, E2+Dox-treated cells showed higher levels of mitochondrial membrane hyperpolarization than Dox-treated cells.
Conclusion: These findings suggest that E2 disrupts intracellular iron metabolism in such a way that increases cell susceptibility to Dox-induced cytotoxicity.
Keywords: cancer, doxorubicin, estrogen, iron, hepcidin, ferroportin, apoptosis
Introduction
Doxorubicin (Dox) is commonly used to treat cancers of the bladder, breast, stomach, lung, ovaries, and Hodgkin’s lymphoma, among others. It intercalates with DNA and disrupts topoisomerase II function, which inhibits protein synthesis and disrupts DNA replication.1–4 Dox also exhibits high affinity for iron5 and induces the generation of free radicals6 through Dox/semiquinone-redox cycling.7,8 Although Dox remains an essential anticancer drug,9 long-term use is associated with significant side effects, including cardiomyopathy. The incidence of Dox-induced cardiomyopathy increases by about 4% at a cumulative dose of 500–550 mg/m2 and about 36% at higher cumulative doses (>600 mg/m2).10 The mechanism underlying Dox-induced cardiomyopathy is not fully understood; however, evidence suggests that disrupted iron metabolism could be involved.11,12 This is based on the observation that iron chelation protects against Dox-induced toxicity in vivo13 and that iron overload is associated with increased cardiotoxicity in animals on Dox therapy.14–16 Different combination therapies have been tested to minimize the effective Dox dose and/or to enhance its efficacy. A paclitaxel–Dox combination was reported as highly effective against anthracycline-resistant breast cancer.17 A kinase inhibitor (sorafenib)–Dox combination was shown to be well tolerated and more effective against hepatocellular carcinoma than Dox alone.18 A sirolimus (rapamycin)–Dox combination against Akt-positive lymphomas in mice was shown to be superior to Dox alone.19 However, dose-limiting toxic neutropenia, neuropathy, and cardiomyopathy persist.18
Various forms of lung,20 pancreas,21 colon,22,23 and breast cancer24,25 are associated with significant iron overload. Breast cancer cells tend to sequester and store iron by expressing increased levels of hepcidin and ferritin (Ft) and decreased levels of ferroportin (Fpn).24 Furthermore, upregulated expression of Ft, TfR1, IRP1, and IRP2 are common findings in breast cancer.25 This profile enables cancer cells to meet high proliferation and metastasis-related demand for iron.26–28 High iron content in cancer cells has been shown to be associated with increased resistance to chemotherapy.29,30 Dox- and cisplatin (Cis)-resistant MCF7 cells express higher levels of TfR130 and hepcidin than unresistant strains.29 Moreover, administration of exogenous hepcidin or free iron has also been reported to be associated with resistance to Dox in a rat model of Walker 256 carcinosarcoma.29 In this context, it has been reported that the human sex hormone estrogen (17β-estradiol; E2) downregulates hepcidin synthesis and upregulates Fpn expression as a means of enhancing intracellular iron efflux.31 E2 has also been reported to induce oxidative stress, membrane damage, and cell-cycle arrest in MCF7 cells32 in a manner related to disrupted intracellular iron status.33 Given that disrupted iron metabolism is a common finding in cancer and that E2 and Dox disrupt intracellular iron metabolism and cause DNA damage, we hypothesized that treating cancer cells with E2 plus Dox could limit the ability of cancer cells to maintain high iron content, making them more susceptible to Dox-induced apoptosis. To this end, human breast (MCF7 and MDA-MB231), ovarian (SKOV3), and liver (HepG2) cancer cell lines treated with various combinations of E2+Dox were assessed for intracellular iron status, cell-cycle progression, and apoptosis at different time points posttreatment.
Methods
Cells and culture conditions
The human cancer cell lines MCF7 (breast ER+), SKOV3 (ovarian ER+), MDA-MB231 (breast ER–), HepG2 (liver ER–), and A549 (lung epithelial–like carcinoma; American Type Culture Collection (Manassas, VA, USA) were used throughout the study. HepG2, MCF7, and MDA-MB231 cells were maintained in (DMEM supplemented with 2 μg/mL insulin, 1 mM sodium pyruvate, 1 mM nonessential amino acids, 4 mM glutamine, 10% FBS, and antibiotics (penicillin–streptomycin) at 37°C and 5% CO2. SKOV3 cells were maintained in McCoy′s 5A medium (Sigma-Aldrich) supplemented with 2 mM glutamine, 1 mM sodium pyruvate, 15% FBS, and 1% antibiotics (penicillin–streptomycin) at 37°C and 5% CO2. A549 cells were cultured in ATCC-formulated F12K medium (30-2004) supplemented with 10% FBS at 37°C and 5% CO2.
Treatment protocol
Cells were seeded at 0.5–1×10⁵ cells/mL in 25 cm flasks at ~70% confluence and treated with 17β-estradiol (estradiol benzoate; Sigma-Aldrich) at 5, 10, or 20 nM dissolved in ethanol32,33 or with Dox hydrochloride (Sigma-Aldrich) at 0.1, 0.5, or 1 μg/mL, or with both. The protocol for combination treatment involved treating cells with E2 (20 nM) and Dox (1 μg/mL) at the same time or treatment with E2 (20 nM) for 48 hours and then with Dox (1 μg/mL) or Cis (23.4 μM) for an additional 24 or 48 hours. Control cultures were left untreated or treated with equal volumes of 70% ethanol as vehicle.
Western blotting analysis
Cells were lysed in ice-cold NP40 lysis buffer (1% NP40, 150 mM NaCl, 50 mM Tris-Cl, pH 8) containing protease cocktail-inhibitor tablets (S8830; Sigma-Aldrich). Whole-cell lysate protein concentrations were quantified using the standard Bradford method (500-0006; Bio-Rad, Hercules, CA, USA). Lysate aliquots containing 30 μg protein were separated by 12% SDS-PAGE and transferred onto a nitrocellulose membrane (1620112; Bio-Rad). The membrane was then blocked by 5% skimmed milk powder for 1 hour at room temperature, washed with TBST, and reacted with primary IgG-unlabeled antibodies (antihepcidinab57611; anti-Fpn, ab85370; anti-TfR1, ab84036; anti-TfR2, ab84287; antisurvivin134170; anti-CDK4, ab68266; anti-cdk6, ab151247; anti–cyclinD1, ab134175; anti-CHK1, ab47574; anti-phospho-CHK1, ab5856; Abcam, Cambridge, UK), anti-Ft (11805; Cell Signaling TechnologyA), and anti-γH2AX (05-636; Millipore, Billerica, MA, USA), at 1:1,000 dilution overnight at 4°C. Secondary (antimouse and antirabbit) antibodies (7076 and 7074; Cell Signaling Technology) were reacted with the membrane at 1:1,000 dilutions for 1 hour at room temperature. The secondary (anti-IgG) antibody (97040; Abcam) was reacted with the membrane at 1:5,000 dilution for 1 hour at room temperature. Chemiluminescence was detected using an electrochemiluminescence (32106; Thermo Fisher Scientific). Band-density quantification was carried out using Image Lab software (ChemiDoc Touch Gel and Western blot imaging system; Bio-Rad); β-actin was used as a normalization control.
Flow-cytometry analysis
Labile iron pool (LIP) was assessed as described previously.34 Briefly, cells were washed twice with PBS and 0.5×10⁶ incubated for 15 minutes at 37°C in the presence of 0.125 μM calcein acetoxymethyl(CA-AM) ester (56496; Sigma-Aldrich). Cells were washed twice and incubated for 15 minutes with DFO (Novartis) at 100 mM. Cells were then washed and analyzed using a BD FACS-Aria III flow cytometer at a rate of 1,000 events/seconds applying a 488nm laser beam for excitation. A minimum of 25,000 events were collected/sampled and percentage positive staining was computed to a 99% level of confidence. Flow-cytometry data were analyzed using FlowJo software with the Watson pragmatic model (Tree Star, Ashland, OR, USA). Mean fluorescence intensity (MFI) represents the geometric mean of fluorescence signals. Since MFI increases as free-iron content decreases, the change in LIP content (ΔMFI) was calculated as MFICA-AM/DFO – MFICA-AM alone and percentage ΔMFI as ΔMFI/MFICA-AM alone × 100.32
MTT cell-viability assay
MTT was used as a colorimetric assay to assess MCF7-cell viability following E2 treatment. Overall, 104 cells previously treated with E2 or vehicle were grown in 0.2 mL growth medium in 96-well plates and cultured for 24 hours. MTT salt was mixed with cells and incubated at 37°C for 2 hours in a humidified incubator at 5% CO2. MTT formazan product was dissolved in dimethyl sulfoxide and absorbance read at 570 nm on a microplate reader.
Wound-healing assay
MCF7 cells were seeded at a density of 5×10⁵ in a six-well plate. At 80% confluence, cultures were disturbed by a straight-liner scratch with a 20 μL pipette tip. Detached cells were removed by washing twice with PBS. Cultures were subsequently treated with E2, Dox, or both or left untreated in media lacking serum for 0, 6, 24, or 48 hours. At each time point, multiple images were acquired using inverted microscopy at 10×. Quantitative analysis of cell migration was performed using ImageJ software (
Cell-cycle analysis
Cells were seeded at a density of 106 cells/mL, harvested, washed twice with PBS, resuspended in 0.5 mL ice-cold PBS, and fixed with 4 mL ice-cold 70% ethanol for 48 hours. Cells were then pelleted, washed twice with ice-cold PBS, resuspended, and incubated at room temperature in 0.2 mL staining buffer in the dark supplemented with 50 μg RNase and propidium iodide (PI) at 50 μg/mL final concentration. Distribution of cell-cycle phases with different DNA contents was determined by flow cytometry (Accuri C6; BD). Cell-cycle distribution and percentage of cells in sub-G1, G1, S, and G2/M phases were determined using the cell-cycle platform on FlowJo.
Annexin V staining for apoptosis detection
Cells were seeded at a density of 106 cells/ml. After treatment, cells were harvested, washed twice with PBS, and stained for 20 minutes in the dark with 0.2 mL buffer containing annexin V–PI (Abcam). Cells were then analyzed for apoptosis with the Accuri C6 at 488 nm excitation, a 530/30 nm band-pass filter for fluorescein detection, and a long-pass filter at 670 nm. Cells positive for PI and annexin V were counted as late-apoptotic, those positive for PI and negative for annexin V as necrotic, and those positive for annexin V and negative for PI as early-apoptotic cells. Data were analyzed using FlowJo.
Assessment of mitochondrial membrane potential
A JC1 mitochondrial membrane potential (MMP)-assay flow cytometry–based Kit (Abcam) was used according to the manufacturer’s protocol. For quantification of JC1 intensity, cells were seeded in a 96-well black plate with a clear bottom. Ex 488/Em 530 nm and Ex 550/Em 600 nm were used and MMP was calculated as the ratio of red:green fluorescence.
Statistical analysis
Data sets representing cell viability, cell counts, protein quantitation, cell cycle, MMP, apoptosis, and wound healing were analyzed using the unpaired Student's t-test (
Results
E2 enhances Dox-induced apoptosis and decreases growth potential in breast and ovarian cancer cells
As shown in Figure 1A, cell viability in E2-treated MCF7 cells was slightly (10%) reduced at 24 hours compared with controls, and further decreased by about 25% at 48 hours. Treatment with Dox alone resulted in decreased cell viability at 24 hours, which further decreased to <40% at 48 hours, especially at 0.5 and 1 μg Dox. Cell viability in E2+Dox-treated cells was statistically similar to that in Dox alone–treated cells at both 24 hours (P=0.055) and 48 hours (P=0.067). Although cell count in E2-treated cells doubled (4×10⁶) compared with seeding density, the increase was significantly lower than that in untreated cells (Figure 1B). Cell counts in Dox alone–treated MCF7 cultures did not increase irrespective of dose or exposure. A significant reduction in cell count was observed in cultures treated with E2+Dox compared to E2 (P=0.016) or Dox alone (P=0.018). This was especially evident at 48 hours (Figure 1B). The pattern of change in cell count in SKOV3 and MDA-MB231 cells treated with E2, Dox, or E2+Dox for 24 or 48 hours was similar to that in MCF7 cultures (Figure 1C). Dox alone– or E2+Dox-treated cells showed significantly lower (P<0.05) cell counts than controls. The HepG2 cell count in E2+Dox-treated cultures was statistically similar to cultures receiving E2 or Dox alone (Figure 1C).
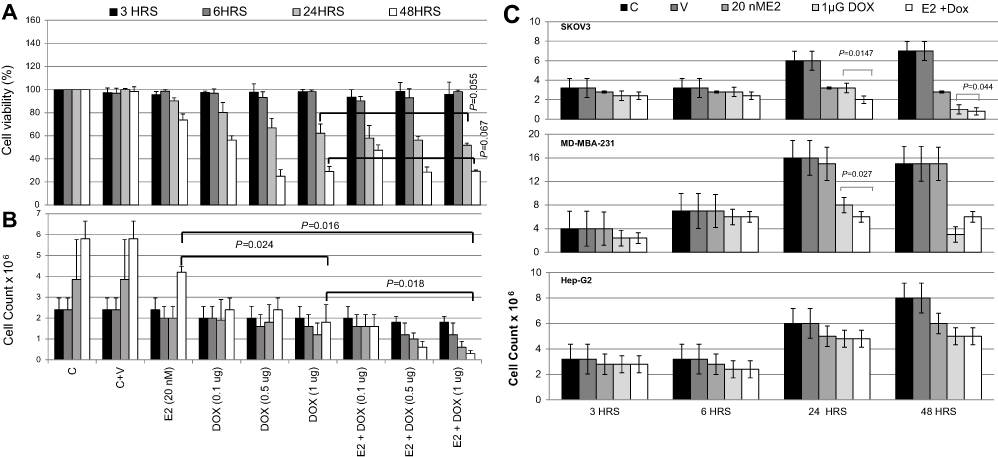 | Figure 1 Assessment of cell viability following treatment with E2, doxorubicin (Dox), or both in various cell lines. Notes: (A) Cell viability and (B) count of MCF7 cultures treated with E2 (20 nM), Dox (0.1, 0.5, or 1 μg), or E2 (20 nM) + Dox (1 μg) for 3, 6, 24, or 48 hours. (C) Cell count in cultures of MDA-MB231, SKOV3 and HepG2 cultures separately treated with E2 (20 nM), Dox (0.1, 0.5, or 1 μg), or E2 (20 nM) + Dox (1 μg) for 3, 6, 24, or 48 hour. Data shown in A–C are means ± SD of three separate experiments. |
Apoptosis in treated and control cells was assessed by the annexin V–PI method. While E2 alone did not lead to apoptosis irrespective of cell type or exposure, Dox treatment induced significant levels of apoptosis in MCF7, SKOV3, and MDA-MB231 cells at 24 and 48 hours (Figure 2, A and B). Apoptosis in E2+Dox-treated cells was significantly higher than in Doxalone–treated cells, especially for MCF7 at 24 (P=0.019) and 48 hours (P=0.035) and SKOV3 at 24 hours (P=0.027). Although percentage apoptosis in MDA-MB231 was higher in cells treated with E2+Dox compared with that in Dox alone–treated cells, the difference was not statistically significant. Percentage apoptosis in HepG2 cells remained minimal irrespective of treatment type or exposure. The ability of E2 to enhance the apoptotic effect of other anticancer drugs was evaluated by treating MCF7, SKOV3, MDA-MB231, and A549 cells with E2 at 20 nM, Cis at 23.4 nM, or a combination of both. As shown in Figure 2C, E2 did not increase Cis-induced apoptosis in A549 cells. Additionally, whether alone or in combination with E2, Cis did not lead to any significant levels of apoptosis in MCF7, SKOV3, or MDA-MB231 cells (Figure 2D).
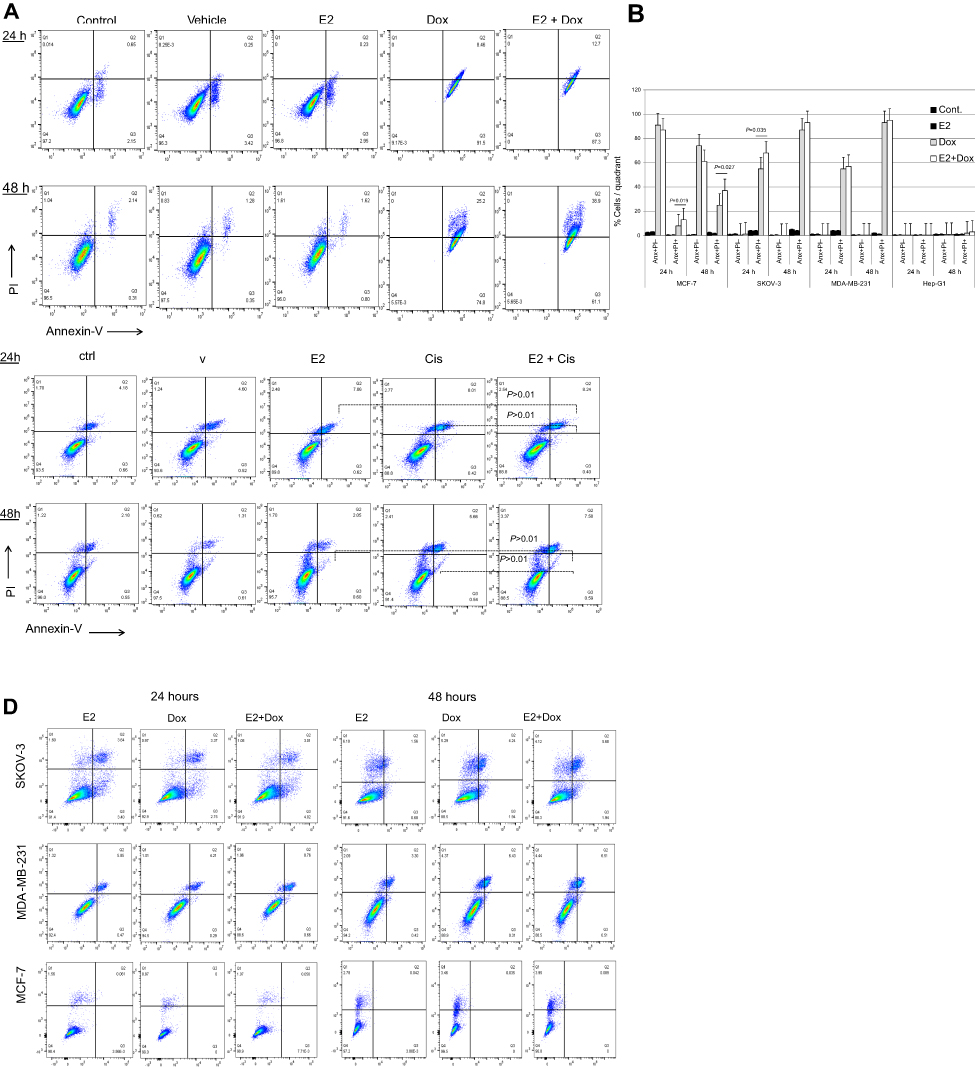 | Figure 2 Levels of apoptosis in various cell types following treatment with E2 + doxorubicin (Dox) or cisplatin (Cis). Notes: (A) Percentage apoptosis in MCF7 cells treated with 20 nM E2, 1 μg Dox, or a combination of both for 24 or 48 hours evaluated using annexin V–PI flow cytometry. (B) Means ± SD of percentage apoptosis in MCF7, SKOV3, MDA-MB231, and HepG2 cells treated with 20 nM E2, 1 μg Dox, or both for 24 or 48 h. Data based on three separate experiments. Percentage apoptosis in (C) A549 and (D) MCF7, SKOV3, and MDA-MB231 cells treated with E2 (20 nM), Cis (1 μg), or both for 24 or 48 hours. |
To test whether reduced survival and increased apoptosis resulting from E2+Dox treatment was associated with changes in the growth potential of cancer cells, migration rates of MCF7 cells treated with E2, Dox, or both were evaluated. As shown in Figure 3, Dox alone did not lead to any significant reduction in the growth potential of surviving cells. In contrast, E2 treatment resulted in a significant reduction in MCF7 growth potential relative to control cells. Although E2+Dox-treated cells showed lower rates of migration relative to E2-treated cells at 72 hours (24 hours post-Dox), the difference was statistically insignificant (Figure 3B). Lastly, at 24 hours posttreatment, plates containing cells treated with Dox alone showed drastic reduction in cell growth, with numerous floating dead cells and cellular clumps filling up the scratch space.
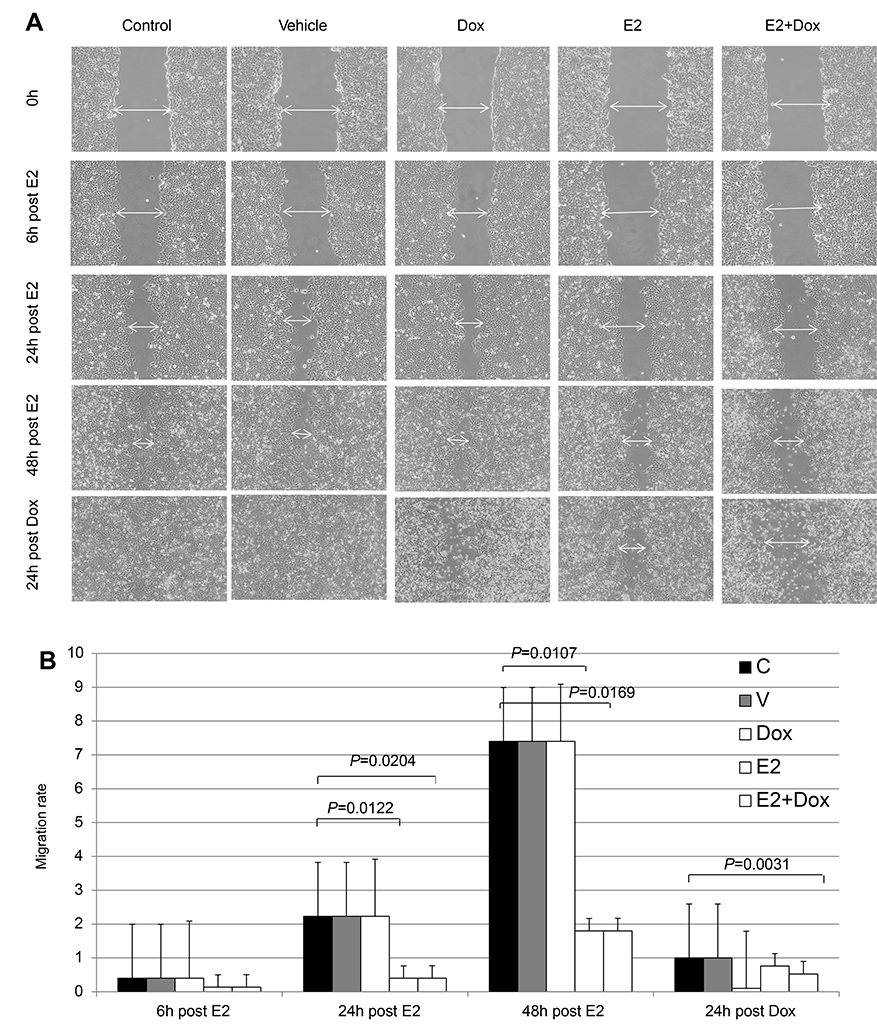 | Figure 3 Healing potential following E2 and/or doxorubicin (Dox) treatment in MCF7 cells. Notes: (A) Cells were photographed at different time points following disruption in cell cultures and healing potential qualitatively assessed by observing wound closure, migration of viable cells to wound area, and presence of floating dead cells; images taken at magnification of 40×. (B) Migration rate ± SD in MCF7 cells treated as in A and calculated as described in Methods, based on three separate experiments. |
The expression status of key proteins involved in cell survival and apoptosis was assessed in MCF7 cells treated with E2, Dox, or E2+Dox (Figure 4). Expression of γH2AX significantly increased in MCF7 cells following treatment with E2, Dox, or E2+Dox compared with controls. Its expression was highest in E2+Dox-treated cells,especially at 48 hours. In contrast, expression of survivin decreased, most notably in cells treated with E2+Dox compared to controls (P=0.036).
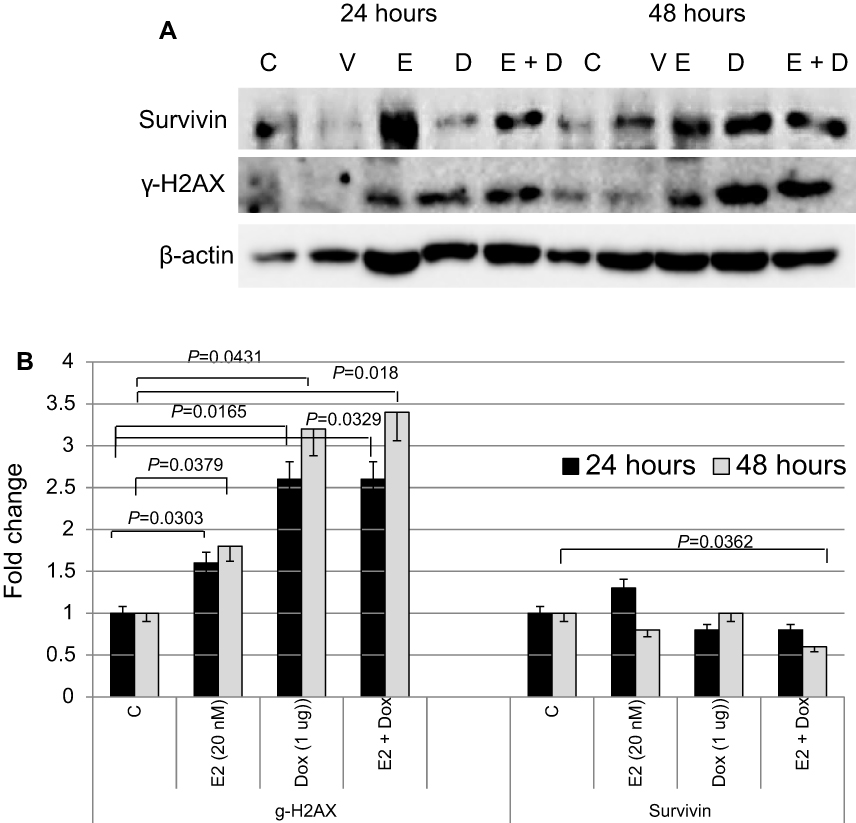 | Figure 4 Expression status of key proteins involved in cell survival, DNA damage, and apoptosis in treated and control MCF7 cells. Notes: (A) Expression of survivin and γH2AX was assessed in lysates prepared from cells treated with E2, doxorubicin (Dox), or both for 24 and/or 48 hours; the same nitrocellulose membrane was successively reacted with and stripped of secondary antibodies corresponding to the two proteins. (B) Calculated mean ± SD fold change in protein-expression levels in treated and untreated cells based on three separate experiments. |
E2 exacerbates Dox-induced cell-cycle disruption
Cell-cycle progression was evaluated in cells treated with E2, Dox, or E2+Dox. The percentage of cells at the G1 phase was significantly higher (P<0.05) and at the S phase lower in E2-treated MCF7 cells than controls at 24 and 48 hours (Figure 5). Only the percentage of cells at the sub-G1 phase increased in Dox-treated MCF7 cells, especially at 48 hours. E2+Dox treatment in MCF7 cells resulted in a significant increase (P<0.05) in the percentage of cells at the sub-G1 phase compared to Dox-treated cells (Figure 5). Similar patterns of cell-cycle progression were noted in SKOV3 and MDA-MB231 cells treated with E2, Dox, or E2+Dox (Figure 5B). Although little apoptosis occurred in HepG2 cells following treatment with E2, Dox, or E2+Dox, a significant increase in the percentage of cells at the sub-G1 phase was noted in Dox-treated HepG2 cells, especially at 24 hours (Figure 5B).
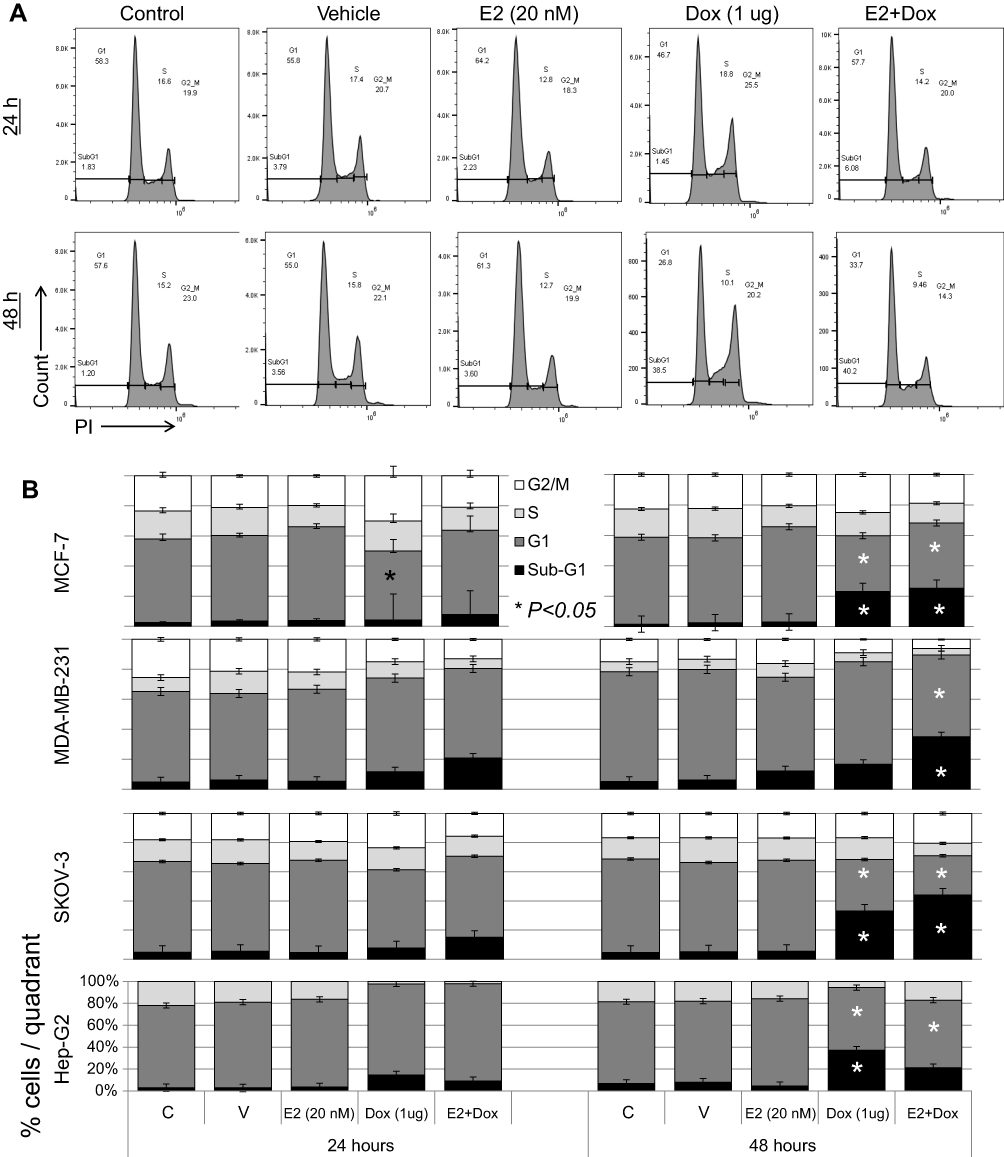 | Figure 5 Cell cycle–phase distribution in various cell types following treatment with E2, doxorubicin (Dox), or both. Notes: (A) MCF7 cells treated for 24 and 48 hours with 20 nM E2, 1 μg Dox, or both were stained with PI and analyzed for DNA content; untreated cells of each cell line used as internal control. (B) Means ± SD of percentage cells in sub-G1, G1, S, and G2/M phase cells in MCF7, SKOV3, MDA-MB231, and HepG2 cells treated as in A; data based on three separate experiments. |
The expression profile of key cell cycle–regulatory proteins was also evaluated in treated and control MCF7 cells. As shown in Figure 6, expression of CDK4 was significantly reduced in Dox- or E2+Dox-treated cells at 48 hours. CDK6 levels were significantly higher in E2-treated cells than controls; however, they were significantly lower in Dox- or E2+Dox-treated cells than controls at 48 hours. Expression of cyclin D was also lower in Dox or E2+Dox-treated cells than in E2-treated cells, especially at 48 hours posttreatment. While E2 treatment did not alter CHK1 expression, Dox and E2+Dox treatments resulted in a significant increase in CHK1 expression at 24 hours and a significant decrease at 48 hours, especially in cells receiving Dox. E2 and E2+Dox also resulted in a significant increase in pCHK1 at 24 hours, and p-HK1 expression decreased relative to controls at 48 hours.
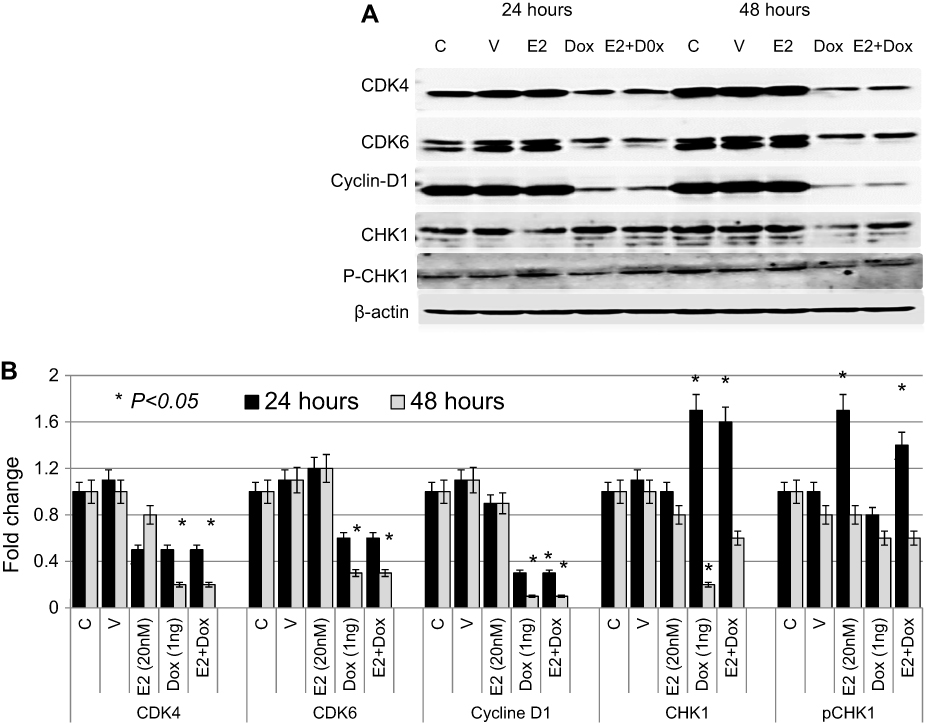 | Figure 6 Expression profile of cell cycle–regulatory proteins in treated and control MCF7 cells Notes: (A) Expression of CDK4, CDK6, cyclin D, CHK1, and pCHK1 proteins was assessed in lysates prepared from cells treated with E2, doxorubicin (Dox), or both, as well as control untreated or ethanol-treated (vehicle) cells for 24 and 48 hour; the same nitrocellulose membrane was successively reacted with and stripped of secondary antibodies corresponding to the various proteins listed. (B) Calculated mean ± SD fold change in protein-expression levels in treated and untreated cells based on three separate experiments. |
E2 and Dox differentially disrupt intracellular iron metabolism in cancer cells
Consistently with previous reports,31–33 E2 treatment in MCF7 cells resulted in reduced hepcidin synthesis and increased Fpn expression (Figure 7A and B). Treatment of MCF7 cells with 1 μg Dox also resulted in a significant reduction in hepcidin and a slight reduction in TfR1 and TfR2 expression at 24 hours. It also resulted in a significant increase in Ft expression at 48 hours posttreatment. No significant changes in Fpn expression were observed in Dox alone–treated cells at either time point. In contrast, E2+Dox treatment resulted in a significant increase in Fpn compared with cells receiving Dox or E2 or untreated controls at both 24 and 48 hours (Figure 6). A significant increase in Ft expression was observed in cells treated with E2, Dox, or E2+Dox at 48 hours; however, the increase in E2+Dox-treated cells was significantly higher than other groups or controls. Moreover, a significant decrease in TfR1 expression was evident in E2+Dox-treated cells relative to other groups or controls at 48 hours. Although hepcidin synthesis was reduced in cells receiving E2+Dox compared with cells receiving Dox alone, the difference was statistically insignificant.
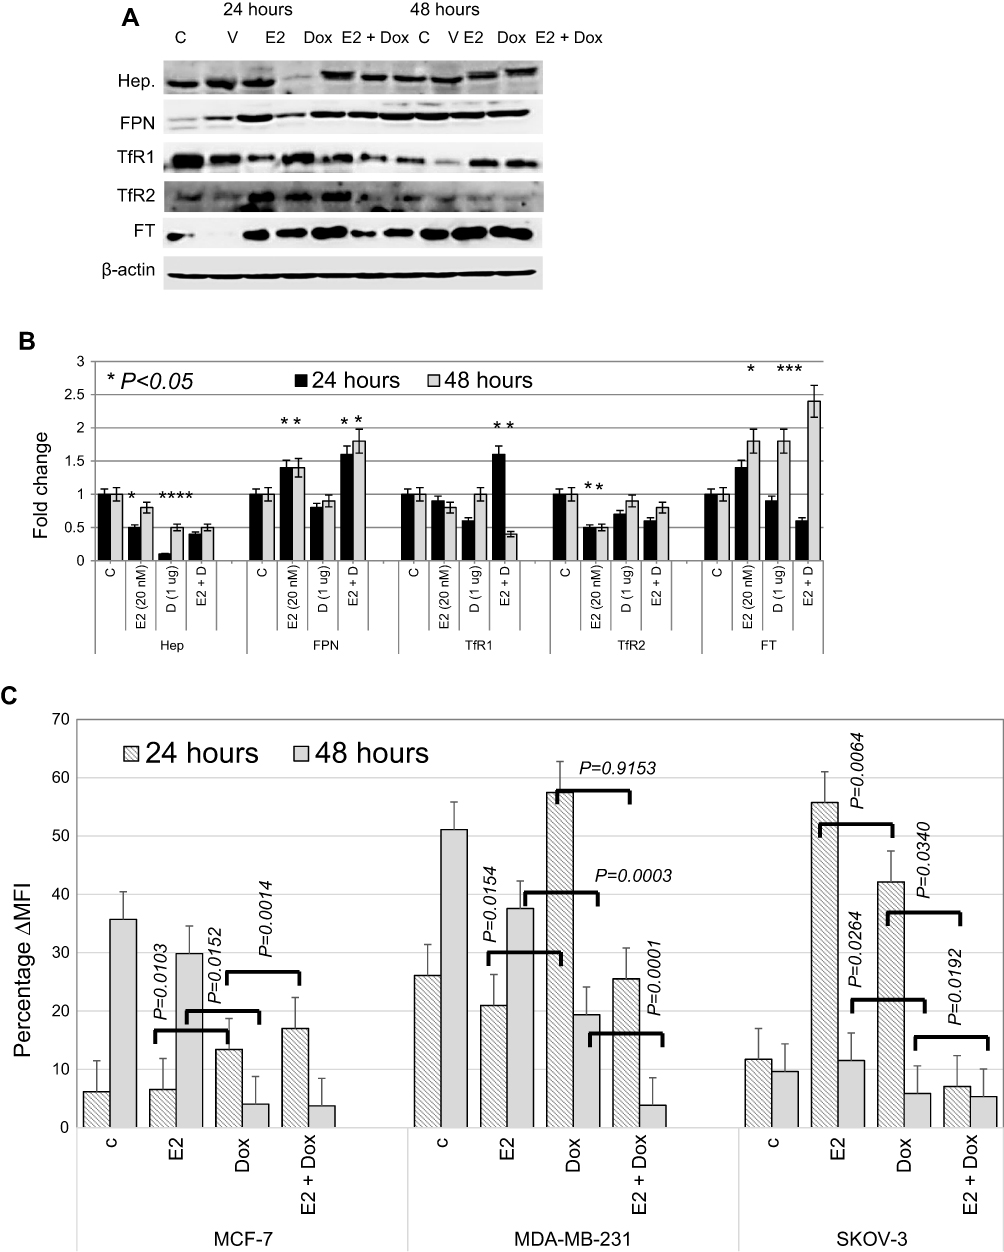 | Figure 7 Status of key proteins involved in iron metabolism and labile iron content in treated and control MCF7 cells. Notes: (A) Representative Western blot of cell lysates prepared from MCF7 cells treated with E2, doxorubicin (Dox) or E2+Dox for 24 or 48 hours; the same nitrocellulose membrane was successively reacted with and stripped of secondary antibodies corresponding to the various proteins listed in the figure. (B) Calculated fold change ± SD of protein-expression levels in treated and control cells based on three separate experiments. (C) Labile iron content in MCF7 cells treated as in A using the CA-AM/CA-AM+DFO staining–based flow cytometry and expressed as %∆MFI. Abbreviations: CA-AM, calcein acetoxymethyl; MFI, mean fluorescence intensity. |
To investigate further the extent of disruption in intracellular iron status, intracellular LIP was measured in cells following treatment with E2, Dox, or a combination of both. As shown in Figure 7C, E2-treated MCF7 and MDA-MB231 cells showed a significant decrease in LIP compared with untreated controls. In contrast, treatment with Dox resulted in increased LIP content compared with untreated controls at 24 hours, especially for MCF7 and MDA-MB231 cells. At 48 hours, however, Dox treatment induced significant levels of LIP depletion in all three cell lines compared with E2-treated cells or untreated controls. Treatment with E2+Dox for 24 hours was associated with a significant increase in LIP content in MCF7 and MDA-MB231 cells. LIP content in SKOV3 cells at 24 hours post-E2+Dox treatment was significantly lower than in E2- or Dox-treated or untreated counterparts (Figure 7C). Importantly, treatment with E2+Dox resulted in very noticeable LIP depletion for 48 hours relative to E2- or Dox-treated cells irrespective of cell type.
E2 enhances Dox-induced hyperpolarization of mitochondrial membrane potential
MMP was assessed in cells treated with E2, Dox, or E2+Dox using the JC1 kit (Figure 8). E2 alone resulted in a significant (P<0.05) depolarization in MCF7, SKOV3, and MDA-MB231 cells at 24 hours. Significant membrane depolarization was also evident in E2-treated SKOV3 and MDA-MB231 cells at 48 hours posttreatment. In contrast, Dox-alone treatment resulted in significant hyperpolarization in all three cell lines at both 24 and 48 hours posttreatment. Interestingly, E2+Dox treatment resulted in levels of hyperpolarization similar to (MCF7) or higher than Dox (MDA-MB231, P=0.041; SKOV3, P=0.038) at 24 hours and similar to (MCF7, MDA-MB231) or higher than Dox (SKOV3, (P=0.043) at 48 h.
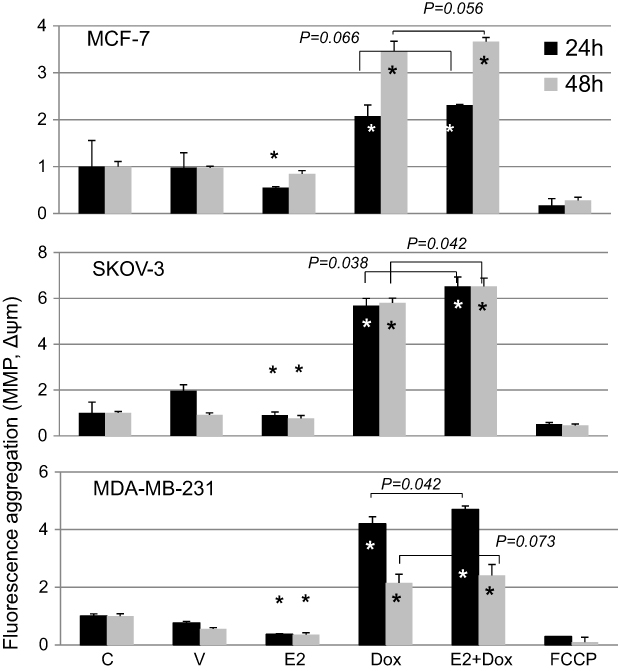 | Figure 8 Mitochondrial membrane potential (MMP) in control and treated cells. Notes: Means ± SD of MMP in MCF7, SKOV3, and MDA-MB231 cells treated with E2, doxorubicin (Dox) or E2+Dox for 24 or 48 hours; data based on two separate experiments/cell types. *P<0.05 vs control group. |
Discussion
Findings presented here suggest that E2 enhances the cytotoxic effects of Dox in breast and ovarian cancer cell lines. This is consistent with previous work, which has demonstrated that E2 precipitates anticancer effects.32,33 Efficacy studies comparing tamoxifen to E2 have shown that they both produce similar responses against metastatic breast cancer in postmenopausal women, with patients receiving E2 experiencing longer survival.35 E2-replacement therapy in postmenopausal women with prior hysterectomy was also reported to reduce the incidence of invasive breast cancer.36 Furthermore, high-dose E2 treatment was shown to produce a positive response in about a third of breast cancer patients following long-term E2 deprivation.37 Long-term E2 deprivation in ER+ breast cancers was also reported to induce apoptosis37 via intrinsic or extrinsic pathways.38,39
Our findings also show that E2+Dox treatment in breast and ovarian cancer cells precipitates significant DNA damage, as demonstrated by increased expression of γH2AX, decreased expression of survivin, and disrupted cell cycling. This is consistent with previous studies, which demonstrated that E2 induces DNA damage,38 upregulates γH2AX expression39,40 and downregulates survivin expression41 in MCF7 cells. Increased percentage of cells at the sub-G1 phase in E2+Dox-treated cells is further evidence of exacerbated DNA damage. Additionally, cells on E2+Dox showed significant reduction in CDK4, cyclin D, and CDK6 expression. This is in agreement with previous work that suggested that treatment with a CDK4 inhibitor plus Dox enhanced apoptosis in MCF7 cells.40 Exposure of MCF7 to E2 was also shown to be associated with significant alterations in multiple genes involved in tha cell cycle, apoptosis, and endoplasmic reticulum stress (BCL2L11 and CASP4).38 Given that CHK1 is part of the DNA damage response and cell cycle–checkpoint regulation,42,43 upregulated expression of CHK1 in E2+Dox-treated cells is consistent with the observation that this treatment approach precipitates significant levels of DNA damage. It is also in agreement with previous work, which has established that the expression and activation of CHK1 in response to DNA damage is associates with cell-cycle arrest and cell death.42,44–46 Increased DNA damage in E2+Dox-treated cells is further supported by the finding that such cells experience high levels of MMP hyperpolarization, typically associated with increased ATP synthesis and the production of free radicals.47
The findings also demonstrate that E2+Dox treatment results in a significant disruption of intracellular iron metabolism. Previous work has shown that E2 disrupts intracellular iron metabolism31 and that this is associated with increased oxidative stress, DNA damage, and cell-cycle arrest in MCF7 and SKOV3.32,33 The role of E2 in iron metabolism stems mainly from its ability to reduce hepcidin synthesis through upregulated HIF1α expression48,49 or direct interaction with E2-responsive elements in the hepcidin gene.50,51 As for Dox, previous work has shown that anthracyclines like Dox disrupt the function of iron-regulatory proteins52 by directly interacting with the 5ʹUTRs of Ft heavy- and light-chain mRNAs,53 reversibly inactivating IRP1 and/or preventing the translation of iron-sequestration proteins.54 Enhanced LIP depletion following E2+Dox treatment could be explained by the observation that the expression of Fpn, the major iron exporter,55 was upregulated and that of TfR1, the major iron importer, downregulated in E2+Dox-treated cells. It is worth noting that increased expression of TfR1 is associated with Dox resistance in human chronic myelogenous leukemia cells (K562) and pro–myelocytic leukemia cells (HL60).56 Furthermore, TfR1 is highly expressed in mitoxantrone-resistant57 and fulvestrant-resistant58 MCF7 cells, as well as gallium-resistant HL60 cells.59 Although Ft heavy-chain overexpression is associated with Cis-resistant gastric cancer cells,60 increased expression in cells rendered more susceptible to Dox-induced cytotoxicity by E2+Dox treatment is consistent with the observation that total Ft content is reduced in gallium-resistant CCRF-CEM cells.61
It is worth noting that the ability of E2 to influence the behaviour of SKOV3 cells is consistent with previous studies, which have demonstrated that E2-driven growth in SKOV3 cells occurs through ERα signalling.62,63 As for MDA-MB231, although these cells are typically negative for ERα and ERβ, previous reassessment work has demonstrated that they express both receptors64 and that suppression of proliferation in such cells is mediated through E2–ERα signalling.65 Moreover, even in the absence of both ERα and ERβ, cells can still respond to E2 via G protein–coupled receptors (GPR30).66
In conclusion, findings presented here suggest that E2 enhances the cytotoxic activity of Dox in breast and ovarian cancer cell lines. The data also suggest that this could be related to the ability of E2 to exacerbate the disruption in intracellular iron metabolism that is usually associated with Dox treatment. Although the utility of E2 in therapy is very doubtful, given its carcinogenic potential, these findings point to a possible link among E2 signaling, iron metabolism, and the cytotoxic activity of chemotherapy, which can be further evaluated for the possible identification of new therapeutic targets.
Acknowledgments
This work was supported by research grants 15010501005-P and 1701050126-P, University of Sharjah, UAE and grant AJF201664, Al-Jalila Foundation, Dubai, UAE. The authors wish to acknowledge the generous support of the Sharjah Institute for Medical Research (SIMR), University of Sharjah, UAE. The abstract of this paper was presented at the 2018 ASCO Annual Meeting, June 1–5, 2018, Chicago, IL, USA as an online abstract with interim findings. The abstract was published in “e-Abstracts” supplement in the Journal of Clinical Oncology, volume 36, number 15 supplement (DOI: 10.1200/JCO.2018.36.15_suppl.e24225).
Author contributions
All authors contributed to data analysis, drafting or revising the article, gave final approval of the version to be published, and agree to be accountable for all aspects of the work.
Disclosure
The authors report no conflicts of interest in this work.
References
1. Tacar O, Sriamornsak P, Dass CR. Dox: an update on anticancer molecular action, toxicity and novel drug delivery systems. J Pharm Pharmacol. 2013;65:157–170. doi:10.1111/j.2042-7158.2012.01567.x
2. Fornari FA, Randolph JK, Yalowich JC, Ritke MK, Gewirtz DA. Interference by Dox with DNA unwinding in MCF-7 breast tumor cells. Mol Pharmacol. 1994;45:649–656.
3. Momparler RL, Karon M, Siegel SE, Avila F. Effect of adriamycin on DNA, RNA, and protein synthesis in cell-free systems and intact cells. Cancer Res. 1976;8:2891–2895.
4. Pommier Y, Leo E, Zhang H, Marchand C. DNA topoisomerases and their poisoning by anticancer and antibacterial drugs. Chem Biol. 2010;5:421–443. doi:10.1016/j.chembiol.2010.04.012
5. May PM, Williams GK, Williams DR. Solution chemistry studies of adriamycin–iron complexes present in vivo. Eur J Cancer. 1980;16:1275–1276.
6. Xu X, Persson HL, Richardson DR. Molecular pharmacology of the interaction of anthracyclines with iron. Mol Pharmacol. 2005;68:261–271. doi:10.1124/mol.105.013383
7. Doroshow JH. Role of hydrogen peroxide and hydroxyl radical formation in the killing of Ehrlich tumor cells by anticancer quinones. Proc Natl Acad Sci USA. 1986;83:4514–4518.
8. Gewirtz DA. A critical evaluation of the mechanisms of action proposed for the antitumor effects of the anthracycline antibiotics adriamycin and daunorubicin. Biochem Pharmacol. 1999;57:727–741.
9.
10. Chatterjee K, Zhang J, Honbo N, Karliner JS. Dox cardiomyopathy. Cardiology. 2010;115:155–162. doi:10.1159/000265166
11. Minotti G, Recalcati S, Menna P, Salvatorelli E, Corna G, Cairo G. Dox cardiotoxicity and the control of iron metabolism: quinone-dependent and independent mechanisms. Methods Enzymol. 2004;378:340–361. doi:10.1016/S0076-6879(04)78025-8
12. Gammella E, Maccarinelli F, Buratti P, Recalcati SS, Cairo G. The role of iron in anthracycline cardiotoxicity. Front Pharmacol. 2014;5:25. doi:10.3389/fphar.2014.00025
13. Swain SM, Whaley FS, Gerber MC, et al. Cardio-protection with dexrazoxane for Dox-containing therapy in advanced breast cancer. J Clin Oncol. 1997;15:1318–1332. doi:10.1200/JCO.1997.15.4.1318
14. Hershko C, Link G, Tzahor M, et al. Anthracycline toxicity is potentiated by iron and inhibited by deferoxamine: studies in rat heart cells in culture. J Lab Clin Med. 1993;122:245–251.
15. Link G, Tirosh R, Pinson A, Hershko C. Role of iron in the potentiation of anthracycline cardiotoxicity: identification of heart cell mitochondria as a major site of iron–anthracycline interaction. J Lab Clin Med. 1996;127:272–278.
16. Panjrath GS, Patel V, Valdiviezo CI, Narula N, Narula J, Jain D. Potentiation of doxorubicin cardiotoxicity by iron loading in a rodent model. J Am Coll Cardiol. 2007;49:2457–2464. doi:10.1016/j.jacc.2007.02.060
17. Gehl J, Boesgaard M, Paaske T, Vittrup Jensen B, Dombernowsky P. Combined Dox and paclitaxel in advanced breast cancer: effective and cardiotoxic. Ann Oncol. 1996;7:687–693.
18. Richly H, Schultheis B, Adamietz IA, et al. Combination of sorafenib and Dox in patients with advanced hepatocellular carcinoma: results from a phase I extension trial. Eur J Cancer. 2009;45:579–587. doi:10.1016/j.ejca.2008.10.039
19. Wendel H, De Stanchina E, Fridman J, et al. Survival signalling by Akt and eIF4E in oncogenesis and cancer therapy. Nature. 2004;428:332–337. doi:10.1038/nature02369
20. Xiong W, Wang L, Yu F. Regulation of cellular iron metabolism and its implications in lung cancer progression. Med Oncol. 2014;31:28. doi:10.1007/s12032-014-0028-2
21. Kalousová M, Krechler T, Jáchymová M, Kuběna AA, Žák A, Zima T. Ferritin as an independent mortality predictor in patients with pancreas cancer. Results of a pilot study. Tumour Biol. 2012;33:1695–1700. doi:10.1007/s13277-012-0426-z
22. Osborne NJ, Gurrin LC, Allen KJ, et al. HFE C282Y homozygotes are at increased risk of breast and colorectal cancer. Hepatology. 2010;51:1311–1318. doi:10.1002/hep.23448
23. Xue X, Taylor M, Anderson E, et al. Hypoxia-inducible factor-2alpha activation promotes colorectal cancer progression by dysregulating iron homeostasis. Cancer Res. 2012;72:2285–2293. doi:10.1158/0008-5472.CAN-11-3836
24. Pinnix ZK, Miller LD, Wang W, et al. Ferroportin and iron regulation in breast cancer progression and prognosis. Sci Transl Med. 2010;2:43ra56 3001127. doi:10.1126/scisignal.3001127
25. Shpyleva SI, Tryndyak VP, Kovalchuk O, et al. Role of ferritin alterations in human breast cancer cells. Breast Cancer Res Treat. 2011;126:63–71. doi:10.1007/s10549-010-0849-4
26. Torti SV, Torti FM. Cellular iron metabolism in prognosis and therapy of breast cancer. Crit Rev Oncog. 2013;18:435–448.
27. Torti SV, Torti FM. Iron and cancer: more ore to be mined. Nat Rev Cancer. 2013;13:342–355. doi:10.1038/nrc3495
28. Richardson DR, Kalinowski DS, Lau S, Jansson PJ, Lovejoy DB. Cancer cell iron metabolism and the development of potent iron chelators as anti-tumour agents. Biochim Biophys Acta. 2009;1790:702–717. doi:10.1016/j.bbagen.2008.04.003
29. Yalovenko TM, Todor IM, Lukianova NY, Chekhun VF. Hepcidin as a possible marker in determination of malignancy degree and sensitivity of breast cancer cells to cytostatic drugs. Exp Oncol. 2016;38:84–88.
30. Chekhun VF, Lukyanova NY, Burlaka AP, et al. Iron metabolism disturbances in the MCF-7 human breast cancer cells with acquired resistance to doxorubicin and cisplatin. Int J Oncol. 2013;43:1481–1486. doi:10.3892/ijo.2013.2063
31. Bajbouj K, Shafarin J, Allam H, et al. Elevated levels of estrogen suppress hepcidin synthesis and enhance serum iron availability in premenopausal women. Exp Clin Endocrinol Diabetes. 2018;126:453–459. doi:10.1055/s-0043-124077
32. Bajbouj K, Shafarin J, Abdalla MY, Ahmad IM, Hamad M. Estrogen-induced disruption of intracellular iron metabolism leads to oxidative stress, membrane damage, and cell cycle arrest in MCF-7 cells. Tumour Biol. 2017;39:1010428317726184. doi:10.1177/1010428317726184
33. Shafarin J, Bajbouj K, El-Serafy A, Sandeep S, Hamad M. Estrogen-dependent downregulation of hepcidin synthesis induces intracellular iron efflux in cancer cells in vitro. Biol Med. 2016;8:356–363. doi:10.4172/0974-8369.1000356
34. Prus E, Fibach E. Flow cytometry measurement of the labile iron pool in human hematopoietic cells. Cytometry A. 2008;73:22–27. doi:10.1002/cyto.a.20491
35. Ingle JN, Ahmann DL, Green SJ, et al. Randomized clinical trial of diethylstilbestrol versus tamoxifen in postmenopausal women with advanced breast cancer. N Engl J Med. 1981;304:16–21. doi:10.1056/NEJM198101013040104
36. LaCroix AZ, Chlebowski RT, Manson JE, et al. Health outcomes after stopping conjugated equine estrogens among postmenopausal women with prior hysterectomy: a randomized controlled trial. JAMA. 2011;305:1305–1314. doi:10.1001/jama.2011.382
37. Jordan CV. The new biology of estrogen-induced apoptosis applied to treat and prevent breast cancer. Endocr Relat Cancer. 2015;22:R1–R31. doi:10.1530/ERC-14-0448
38. Mobley JA, Brueggemeier RW. Estrogen receptor-mediated regulation of oxidative stress and DNA damage in breast cancer. Carcinogenesis. 2004;25:3–9. doi:10.1093/carcin/bgg175
39. Kuo LJ, Yang L. γ-H2A: a novel biomarker for DNA double-strand breaks. In Vivo. 2008;22:305–310.
40. Tarasewicz E, Hamdan R, Straehla J, et al. CDK4 inhibition and doxorubicin mediate breast cancer cell apoptosis through Smad3 and survivin. Cancer Biol Ther. 2014;15:1301–1311. doi:10.4161/cbt.29693
41. Fukuda S, Pelus LM. Survivin, a cancer target with an emerging role in normal adult tissues. Mol Cancer Ther. 2006;5:1087–1098. doi:10.1158/1535-7163.MCT-05-0375
42. Zhang Y, Hunter T. Roles of Chk1 in cell biology and cancer therapy. Int J Cancer. 2014;134:1013–1023. doi:10.1002/ijc.28226
43. Patil M, Pabla N, Dong Z. Checkpoint kinase 1 in DNA damage response and cell cycle regulation. Cell Mol Life Sci. 2013;70:4009–4021. doi:10.1007/s00018-013-1307-3
44. Meuth M. Chk1 suppressed cell death. Cell Div. 2010;5:21. doi:10.1186/1747-1028-5-21
45. Liu Q, Guntuku S, Cui XS, et al. Chk1 is an essential kinase that is regulated by Atr and required for the G(2)/M DNA damage checkpoint. Genes Develop. 2000;14:1448–1459.
46. Goto H, Izawa I, Li P, Inagaki M. Novel regulation of checkpoint kinase 1: is checkpoint kinase 1 a good candidate for anti-cancer therapy? Cancer Sci. 2012;103:1195–1200. doi:10.1111/j.1349-7006.2012.02280.x
47. Gergely P, Niland B, Gonchoroff N, Pullmann R
48. Hua K, Din J, Cao Q, et al. Estrogen and progestin regulate HIF-1alpha expression in ovarian cancer cell lines via the activation of Akt signaling transduction pathway. Oncol Report. 2009;21:893–898.
49. Kazi AA, Molitoris KH, Koos RD. Estrogen rapidly activates the PI3K/AKT pathway and hypoxia-inducible factor 1 and induces vascular endothelial growth factor A expression in luminal epithelial cells of the rat uterus. Biol Reprod. 2009;81:378–378. doi:10.1095/biolreprod.109.076117
50. Yang Q, Jian J, Katz S, Abramson SB, Huang X. 17β-estradiol inhibits iron hormone hepcidin through an estrogen responsive element half-site. Endocrinol. 2012;153:3170–3178. doi:10.1210/en.2011-2045
51. Hou Y, Zhang S, Wang L, et al. Estrogen regulates iron homeostasis through governing hepatic hepcidin expression via an estrogen response element. Genetics. 2012;511:398–403.
52. Octavia Y, Tocchetti CG, Gabrielson KL, Janssens S, Crijns HJ, Moens AL. Doxorubicin-induced cardiomyopathy: from molecular mechanisms to therapeutic strategies. J Mol Cell Cardiol. 2012;52:1213–1225. doi:10.1016/j.yjmcc.2012.03.006
53. Canzoneri JC, Oyelere AK. Interaction of anthracyclines with iron responsive element mRNAs. Nucleic Acids Res. 2008;36:6825–6834. doi:10.1093/nar/gkn774
54. Brazzolott X, Andriollo M, Guiraud P, Favier A, Moulis JM. Interactions between doxorubicin and the human iron regulatory system. Biochim Biophys Acta. 2003;1593:209–218. doi:10.1016/S0167-4889(02)00391-9
55. Hentze MW, Muckenthaler MU, Andrews NC. Balancing acts: molecular control of mammalian iron metabolism. Cell. 2004;117:285–297.
56. Barabas K, Faulk WP. Transferrin receptors associate with drug resistance in cancer cells. Biochem Biophys Res Commun. 1993;197:702–708. doi:10.1006/bbrc.1993.2536
57. Rahbar AM, Fenselau C. Unbiased examination of changes in plasma membrane proteins in drug resistant cancer cells. J Proteome Res. 2005;4:2148–2153. doi:10.1021/pr0502370
58. Habashy HO, Powe DG, Staka CM, et al. Transferrin receptor (CD71) is a marker of poor prognosis in breast cancer and can predict response to tamoxifen. Breast Cancer Res Treat. 2010;119:283–293. doi:10.1007/s10549-009-0345-x
59. Chitambar CR. Gallium nitrate for the treatment of non-Hodgkin’s lymphoma. Drugs. 2004;13:531–541.
60. Kang HC. Identification of genes with differential expression in acquired drug-resistant gastric cancer cells using high-density oligonucleotide microarrays. Clin Cancer Res. 2004;10:272–284.
61. Chitambar CR, Wereley JP. Resistance to the antitumor agent gallium nitrate in human leukemic cells is associated with decreased gallium/iron uptake, increased activity of iron regulatory protein-1, and decreased ferritin production. J Biol Chem. 1997;272:12151–12157.
62. O’Donnell AJM, Macleod KG, Burns DJ, Smyth JF, Langdon SP. Estrogen receptor-α mediates gene expression changes and growth response in ovarian cancer cells exposed to estrogen. Endo Relat Cancer. 2005;12:851–866. doi:10.1677/erc.1.01039
63. Li L, Li X, Han X, et al. An ovarian cancer model with positive ER: reversion of ER antagonist resistance by Src blockade. Oncol Rep. 2014;32:943–950. doi:10.3892/or.2014.3284
64. Ford CH, Al-Bader M, Al-Ayadhi B, Francis I. Reassessment of estrogen receptor expression in human breast cancer cell lines. Anticancer Res. 2011;31:521–527.
65. Moggs JG, Murphy TC, Lim FL, et al. Anti-proliferative effect of estrogen in breast cancer cells that re-express ERα is mediated by aberrant regulation of cell cycle genes. J Mol Endocrinol. 2005;34:535–551. doi:10.1677/jme.1.01770
66. Prossnitz ER, Arterburn JB, Sklar LA. GPR30: a G protein-coupled receptor for estrogen. Mol Cell Endocrinol. 2007;265–266:138–142. doi:10.1016/j.mce.2006.12.010
 © 2019 The Author(s). This work is published and licensed by Dove Medical Press Limited. The
full terms of this license are available at https://www.dovepress.com/terms
and incorporate the Creative Commons Attribution
- Non Commercial (unported, 3.0) License.
By accessing the work you hereby accept the Terms. Non-commercial uses of the work are permitted
without any further permission from Dove Medical Press Limited, provided the work is properly
attributed. For permission for commercial use of this work, please see paragraphs 4.2 and 5 of our Terms.
© 2019 The Author(s). This work is published and licensed by Dove Medical Press Limited. The
full terms of this license are available at https://www.dovepress.com/terms
and incorporate the Creative Commons Attribution
- Non Commercial (unported, 3.0) License.
By accessing the work you hereby accept the Terms. Non-commercial uses of the work are permitted
without any further permission from Dove Medical Press Limited, provided the work is properly
attributed. For permission for commercial use of this work, please see paragraphs 4.2 and 5 of our Terms.