Back to Journals » Infection and Drug Resistance » Volume 14
Estimating the Long-Term Epidemiological Trends and Seasonality of Hemorrhagic Fever with Renal Syndrome in China
Authors Xiao Y, Li Y, Li Y, Yu C, Bai Y ![]() , Wang L, Wang Y
, Wang L, Wang Y ![]()
Received 21 June 2021
Accepted for publication 18 August 2021
Published 21 September 2021 Volume 2021:14 Pages 3849—3862
DOI https://doi.org/10.2147/IDR.S325787
Checked for plagiarism Yes
Review by Single anonymous peer review
Peer reviewer comments 2
Editor who approved publication: Professor Suresh Antony
Yuhan Xiao,1,* Yanyan Li,1,* Yuhong Li,2 Chongchong Yu,1 Yichun Bai,1 Lei Wang,3 Yongbin Wang1
1Department of Epidemiology and Health Statistics, School of Public Health, Xinxiang Medical University, Xinxiang, Henan Province, People’s Republic of China; 2National Center for Tuberculosis Control and Prevention, China Center for Disease Control and Prevention, Beijing, People’s Republic of China; 3Center for Musculoskeletal Surgery, Charité–Universitätsmedizin Berlin, Corporate Member of Freie Universität Berlin, Humboldt–Universität Zu Berlin and Berlin Institute of Health, Berlin, Germany
*These authors contributed equally to this work
Correspondence: Yongbin Wang
Department of Epidemiology and Health Statistics, School of Public Health, Xinxiang Medical University, No. 601 Jinsui Road, Hongqi District, Xinxiang, Henan Province, 453003, People’s Republic of China
Tel +86-373-3831646
Email [email protected]
Objective: We aim to examine the adequacy of an innovation state-space modeling framework (called TBATS) in forecasting the long-term epidemic seasonality and trends of hemorrhagic fever with renal syndrome (HFRS).
Methods: The HFRS morbidity data from January 1995 to December 2020 were taken, and subsequently, the data were split into six different training and testing segments (including 12, 24, 36, 60, 84, and 108 holdout monthly data) to investigate its predictive ability of the TBATS method, and its forecasting performance was compared with the seasonal autoregressive integrated moving average (SARIMA).
Results: The TBATS (0.27, {0,0}, -, {< 12,4>}) and SARIMA (0,1,(1,3))(0,1,1)12 were selected as the best TBATS and SARIMA methods, respectively, for the 12-step ahead prediction. The mean absolute deviation, root mean square error, mean absolute percentage error, mean error rate, and root mean square percentage error were 91.799, 14.772, 123.653, 0.129, and 0.193, respectively, for the preferred TBATS method and were 144.734, 25.049, 161.671, 0.203, and 0.296, respectively, for the preferred SARIMA method. Likewise, for the 24-, 36-, 60-, 84-, and 108-step ahead predictions, the preferred TBATS methods produced smaller forecasting errors over the best SARIMA methods. Further validations also suggested that the TBATS model outperformed the Error-Trend-Seasonal framework, with little exception. HFRS had dual seasonal behaviors, peaking in May–June and November–December. Overall a notable decrease in the HFRS morbidity was seen during the study period (average annual percentage change=− 6.767, 95% confidence intervals: − 10.592 to − 2.778), and yet different stages had different variation trends. Besides, the TBATS model predicted a plateau in the HFRS morbidity in the next ten years.
Conclusion: The TBATS approach outperforms the SARIMA approach in estimating the long-term epidemic seasonality and trends of HFRS, which is capable of being deemed as a promising alternative to help stakeholders to inform future preventive policy or practical solutions to tackle the evolving scenarios.
Keywords: HFRS, hantavirus, TBATS, SARIMA, ETS, trend, seasonality, time series analysis
Introduction
Hemorrhagic fever with renal syndrome (HFRS) is a zoonosis as a consequence of the infection with several different families of Hantaviruses, which are predominantly carried and transmitted by the natural reservoir of rodents and can be exposed to humans via the urine, droppings, or saliva of virus carriers.1 The clinical manifestations of HFRS are characterized by different degrees of fever, bleeding headache, abdominal pain, and acute kidney damage.2 The Hantaviruses are distributed globally yet varied greatly in different regions.3 In Asia, the HFRS-causing pathogenic agents predominantly include Hantaan virus (HTNV), Seoul virus (SEOV), and Amur virus (AMRV); whereas in Europe, mainly comprising Puumala virus (PUUV), Sochi virus (SOCV), and Dobrava-Belgrade virus (DOBV).3–5 HFRS is currently found in more than 70 countries, but it is mainly endemic in Asian and European continents, especially in China, Russia, and Korea.1,3,4 Among them, China is always hit the hardest country with HFRS in the past, accounting for around 70–90% documented case notifications throughout the world each year.6 HFRS still poses a major public health concern in China because of its ongoing epidemic in 28 of 31 provinces, with approximately 10,000–30,000 case notifications annually,7,8 resulting in case-fatality rates (CFRs) from 1%-14%, contingent on which virus is causing the HFRS.1,4 In China, the reported HFRS cases are predominately associated with the causative pathogens of HTNV and SEOV,9 and the HFRS-causing HTNV accounts for around 70% of the number of case notifications.8 Since the 1990s, a considerable reduction in the HFRS incidence has been witnessed, attributable to the implementation of such comprehensive interventions as effective rodent control, environmental management, improvement of people living standards, and vaccination in China.5 However, HFRS seemingly signals a recurring risk in China in recent years owing to its continued rise in case notifications and the extension of geographical distribution to 31 provinces across China.5,8,10 Basic to any development of prevention and control measures is an accurate quantitative analysis for the secular epidemiological trends and seasonality of diseases. Therefore, it is essential to make a long-term estimation for the timing, extent, and duration of HFRS by use of a forecasting model with good reliability and strong robustness.
There are a large volume of published researches that developed different mathematical techniques to analyze and estimate the upcoming epidemics of infectious diseases for different forecasting aims. The common forecasting tools include autoregressive integrated moving average (ARIMA) model,11 exponential smoothing (ES) methods,12 generalized regression neural network method,13 autoregressive distributed lag method,14 grey approaches,15 back-propagation neural network technique,16 generalized linear regression models,17 support vector machine regression method,18 and autoregressive conditional heteroskedasticity (ARCH) method.19 The above-mentioned methods may provide a satisfactory result in their respective prediction domain. However, on the one hand, these models are often well suited for performing a short-term forecast as they are under either linear or nonlinear assumption,11 which may limit their ability to be generalized in that a long-term ahead forecast can often offer informative clues in the decision-making process in practice. On the other hand, the existing predictive methods typically conduct a successful forecast for a simple time series (eg, single seasonal time series), and yet it is difficult to handle the complex time series with multiple seasonal periods, high-frequency seasonality, non-integer seasonality, and dual-calendar effects.20,21 Importantly, it has been demonstrated that HFRS shows bimodal seasonal patterns in many countries such as China,6,10 Russia,4 and Korea,22 which may lead to an inaccurate forecasting result for the upcoming epidemics of HFRS using the common predictive methods. At this time, the advanced innovation state-space modeling framework by combining Box-Cox transformations, Fourier series with time-varying coefficients and autoregressive moving average (ARMA) error correction method (called TBATS) is tailored for extraction with the information included in a complex time series described above.21 Furthermore, the TBATS approach can not only be used to deal with the linear issue but can handle some types of non-linearity based on Box-Cox transformations,23 whilst allowing for time-dependent dynamic seasonality,24 which enables this advanced method to have the potential to make a long-term forecast. Moreover, the TBATS approach also has a powerful ability to decompose a complex seasonal time series into constituent latent subseries,21 which fails to be done by the aforementioned common methods. In the past, the advanced TBATS model has been used to nowcast and forecast the flow time series in water distribution systems,25 the demand for the electric energy,26 and spatiotemporal variations and characterization of benzene,23 and the resulting results indicated that this advanced method could produce a relatively high forecasting accuracy in these fields. However, there is no study to use this advanced method to analyze and evaluate the long-term epidemiological trends and seasonality of HFRS. Considering the attractive performance of the TBATS approach and the epidemic patterns of HFRS in China, the primary goal of this study is to describe and forecast the long-term epidemic trends and seasonality of HFRS with the advanced TBATS method. Meanwhile, to demonstrate the potential of this advanced method and its suitability for the application in forecasting the long-term spreading patterns of HFRS, its predictive accuracy level was compared with the ARIMA method that has been deemed as the most common and useful methodology in the different domains of time series forecasting.6,7,27–29
Materials and Methods
Data Collection
Currently, there are 40 notifiable contagious diseases in China. The confirmed cases of these diseases must be reported to the National Notifiable Infectious Disease Surveillance System (NNIDSS). HFRS is among them. Thus, we retrospectively took the monthly HFRS incidents and population data between January 1995 and December 2020 from the internet-based NNIDSS and the Statistical Yearbook of China, respectively. Finally, a total of 312 observations covering 26 years were gathered. Often, to build an effective and stable method, preferably 100 observations or more are expected to be adopted.30 In this study, we aim to conduct a long-run forecast for the HFRS epidemics. To this end, we split the whole data into six different training datasets and testing datasets (ie, the forecast horizons included 12, 24, 36, 60, 84, and 108 data) so that a series of experiments were performed to validate the generalization and the forecasting robustness of the methods.
The study protocol was approved by the institutional review board of Xinxiang Medical University (No: XYLL-2019072), and the ethical approval is not warranted for this research as these data without personal information are publicly available.
Developing SARIMA Method
Time series often shows a noticeable link between successive data. The ARIMA method is introduced to make a forecast by mining the intrinsical attributes and inherent rules of time series data.31 HFRS frequently has notable seasonal effects,2,10 and hence the seasonal ARIMA (SARIMA) method should be adopted. In this method, the seasonality of HFRS was thought of as the predictors and the monthly HFRS incidence as the response variable. The SARIMA method is composed of three parts:28 the “AR” signifies the autoregressive approach, the “I” denotes integration, and the “MA” refers to the moving average approach. The basic notation of this method can be written in the form of SARIMA(p, d, q)(P, D, Q)s, where p is the orders of AR, d is the orders of integration, and q is the orders of MA, (P, D, Q) correspond to the seasonal components of the above three parameters.28 In creating the best SARIMA method, the most key step is to search for its suitable parameters. Currently, most software programs allow an automatic selection of the most appropriate parameters. The “Expert Modeler” in SPSS software provides an elegant way of choosing the preferred parameters of the SARIMA method.32 Of all the plausible parameters, those that maximize the R-square (R2) and stationary R2, and minimize the Normalized Schwarz’s Bayesian Information Criterion (NBIC) were first selected.33 Subsequently, the t-test was used to investigate the statistical significance of the identified parameters.29 Next, autocorrelogram, partial autocorrelogram, and Ljung-Box Q test were applied to the residuals to investigate whether the produced forecasting errors behaved like a white noise series.29 Once the method passed all the required tests, it can be said that the selected parameters are suitable and adequate. Finally, a forecast into the next periods can be done with this best approach.
Developing TBATS Method
The traditional single seasonal ES models have a limited capacity to deal with such a complex time series composing of multiple seasonal behaviors, non-integer seasonal behaviors, and dual-calendar effects,21 despite their widespread use in practice.12,34 Some researchers strive for the extension of the single seasonal Holt-Winters’ method by accommodating a second seasonal pattern to analyze the time series including two seasonal behaviors.20 However, this extended model was shown to suffer from over-parameterization as there are a large number of parameters that require to be calculated for the preliminary seasonal behaviors, especially when the target series is composed of high-frequency seasonal behaviors, further heightening the need for the modifications of the traditional ES approaches to deal with a wider variety of seasonal patterns and to resolve the issues raised above. To do this, researchers pay more attention to linear homoscedastic approaches but consider some types of non-linear patterns with Box-Cox transformations, in view of the complexity by extending non-linear ES approaches to deal with the complex time series described above, and the BATS(p, q, m1, m2,…, mT) method was hence introduced, herein B signifies the Box-Cox transformation, A signifies the ARMA model, T and S signify the trend and seasonal patterns in the target series, respectively. The parameters include the orders (p and q) of the ARMA approach and the seasonal periods (m1,…, mT). Albeit the BATS method is successful in modeling multiple seasonal periods in the target series, it fails to address the non-integer seasonality issue and needs to estimate a considerably large number of parameters since the initial seasonal patterns separately include m1 + m2 + · · · + mT parameters, resulting in too many values when the target series contains high-frequency seasonal components. To deal with the problems raised above, researchers made a further generalization of the BATS method by introducing a novel trigonometric representation of seasonal behaviors based on the Fourier series. By doing so, this new method can significantly not only cut the number of parameters that need estimation but can model the non-integer seasonality in the time series.21 This advanced modified method can be denoted as TBATS(ω, p, q, φ, {m1, k1}, {m2, k2},…,{mT, kT}), herein ki represents the corresponding number of Fourier terms used for each seasonality, ω signifies the BoxCox parameter, and φ refers to the damping parameter that facilitates the trend extrapolation of the model when the trend pattern is dampened.23 Additionally, the use of trigonometric functions also helps the TBATS method to decompose a complex time series into secular trend, seasonality, and error components.25
Statistical Analysis
The changing epidemiological trends of HFRS were estimated using average annual percentage change (AAPC) and annual percentage change (APC) based on the joinpoint regression program (Version 4.8.0.1). The SARIMA method was created using the “Expert Modeler” function in SPSS software (version 17.0, IBM Corp, Armonk, NY) and the TBATS method was built with R software (Version 3.4.3, The R Foundation for Statistical Computing, Vienna, Austria). The incidence rate ratio (IRR) with 95% confidence intervals (CIs) between different variation trends of HFRS was computed by use of comparison of two proportions.35
To see the predictive accuracy, two types of measurement indicators were computed, including the scale-dependent measurement indicators comprising the mean absolute deviation (MAD) and root mean square error (RMSE), and the measurement indicators based on percentage errors comprising the mean absolute percentage error (MAPE), mean error rate (MER), and root mean square percentage error (RMSPE). The smaller values of these measures above corresponded to a better model.
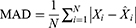
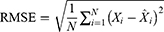
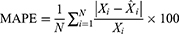
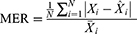
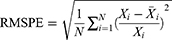
where  represents the monthly HFRS incidence data,
  refers to the forecasting data,
  stands for the mean of the HFRS incidence data, and
  is the number of forecasts.
Results
Statistical Description
There were 576,361 notified HFRS cases over the period 1995–2020, resulting in yearly and monthly average morbidity rates of 1.689 and 0.141 per 100,000 people, respectively. According to the resultant results of joinpoint regression (Figure 1), overall a notable reduction in HFRS morbidity was seen, with AAPC=−6.767 (95% CIs: −10.592 to −2.778; t=−3.278, p=0.001), and yet different stages had different variation trends: a decreasing trend during 1995–2004, with APC=−8.964 (95% CIs: −11.667 to −6.179; t=−6.547, p<0.001); during 2004–2008, with APC=−37.153 (95% CIs: −37.153 to 3.279; t=−1.828, p=0.084); during 2008–2020, with APC=−0.349 (95% CIs: −3.992 to 3.431; t=−0.197, p=0.846), and it seemed to show a cyclical fluctuation with 3–5 years since 2008. The average incidence for the period 2008–2020 decreased by a factor of almost four compared to that for the period 1995–2004 (0.805 vs 3.065 per 100,000 persons; IRR=3.807, 95% CIs: 3.786 to 3.828), decreased by 1.6-fold than that for the period 2004–2008 (0.805 vs 1.324 per 100,000 persons; IRR=1.643, 95% CIs: 1.630 to 1.656). Visibly, as depicted in Figure 2, people could be infected with HFRS all through the year. Nonetheless, the HFRS epidemics presented pronounced dual seasonal patterns per year, with a weak peak between May and June, a secondary strong peak between November and December, and a trough between August and September.
 |
Figure 1 Joinpoint regression plot displaying the HFRS epidemiological trends from 1995 to 2020. *Showed that the annual percent change (APC) is statistically significant. |
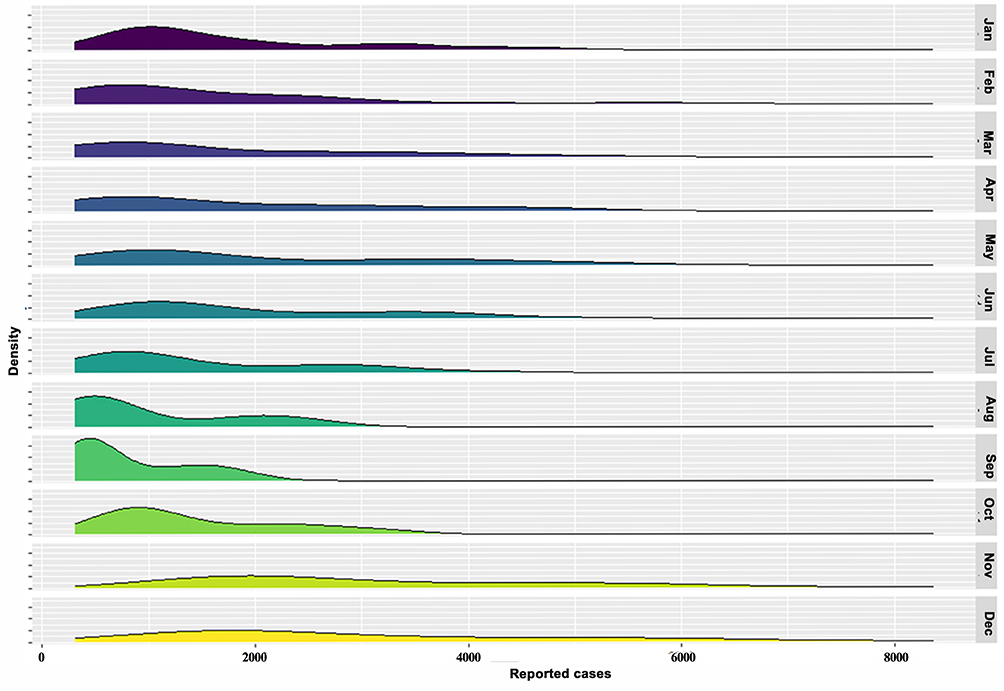 |
Figure 2 Probability density plot showing the monthly HFRS incidence. As depicted, HFRS showed notable seasonal variation, with a strong peak in November and December, and a weak peak in May and June. |
The Optimal SARIMA Method
In constructing the SARIMA method, the “Expert Modeler” function was run on the in-sample data between January 1995 and December 2019, which automatically identified the SARIMA(0,1,(1,3))(0,1,1)12 specification as the preferred model for the 12-data ahead forecast since among all the possible methods, the parameters of this method corresponded to the maximum R2 value of 0.933 and stationary R2 value of 0.473, along with the minimum NBIC value of 11.702 (Table 1). Further diagnostic checking for this optimal method showed that the resulting key parameters were statistical significance (MA1=0.355, MA3=0.253, SMA1=0.747; all p-values<0.001), and the resulting forecast errors could be thought of as an uncorrelated series in that there were little sample autocorrelation function (ACF) and partial ACF (PACF) outside the 95% CIs and there was no statistical difference under Ljung-Box Q test (Q(18)=13.709, p=0.548) (Table 1 and Figure 3). The above diagnostic results meant that the identified SARIMA (0,1,(1,3))(0,1,1)12 specification was capable of tracking the epidemiological trends of HFRS effectively and sufficiently. Likewise, the SARIMA (1,1,(2,3))(0,1,1)12, SARIMA (0,1,(1,3))(0,1,1)12, SARIMA (0,1,1)(0,1,1)12, SARIMA (1,0,0)(0,1,1)12, and SARIMA (1,0,0)(0,1,1)12 specifications were considered as the best model to forecast the 24, 36, 60, 84, and 108 holdout data, respectively, and the resulting diagnostic overviews for the five best SARIMA versions were visible in Table 1 and Figures S1–S5. Afterward, projecting into different future periods could be done by use of these best SARIMA methods (Figure 4 and Tables S1–S6).
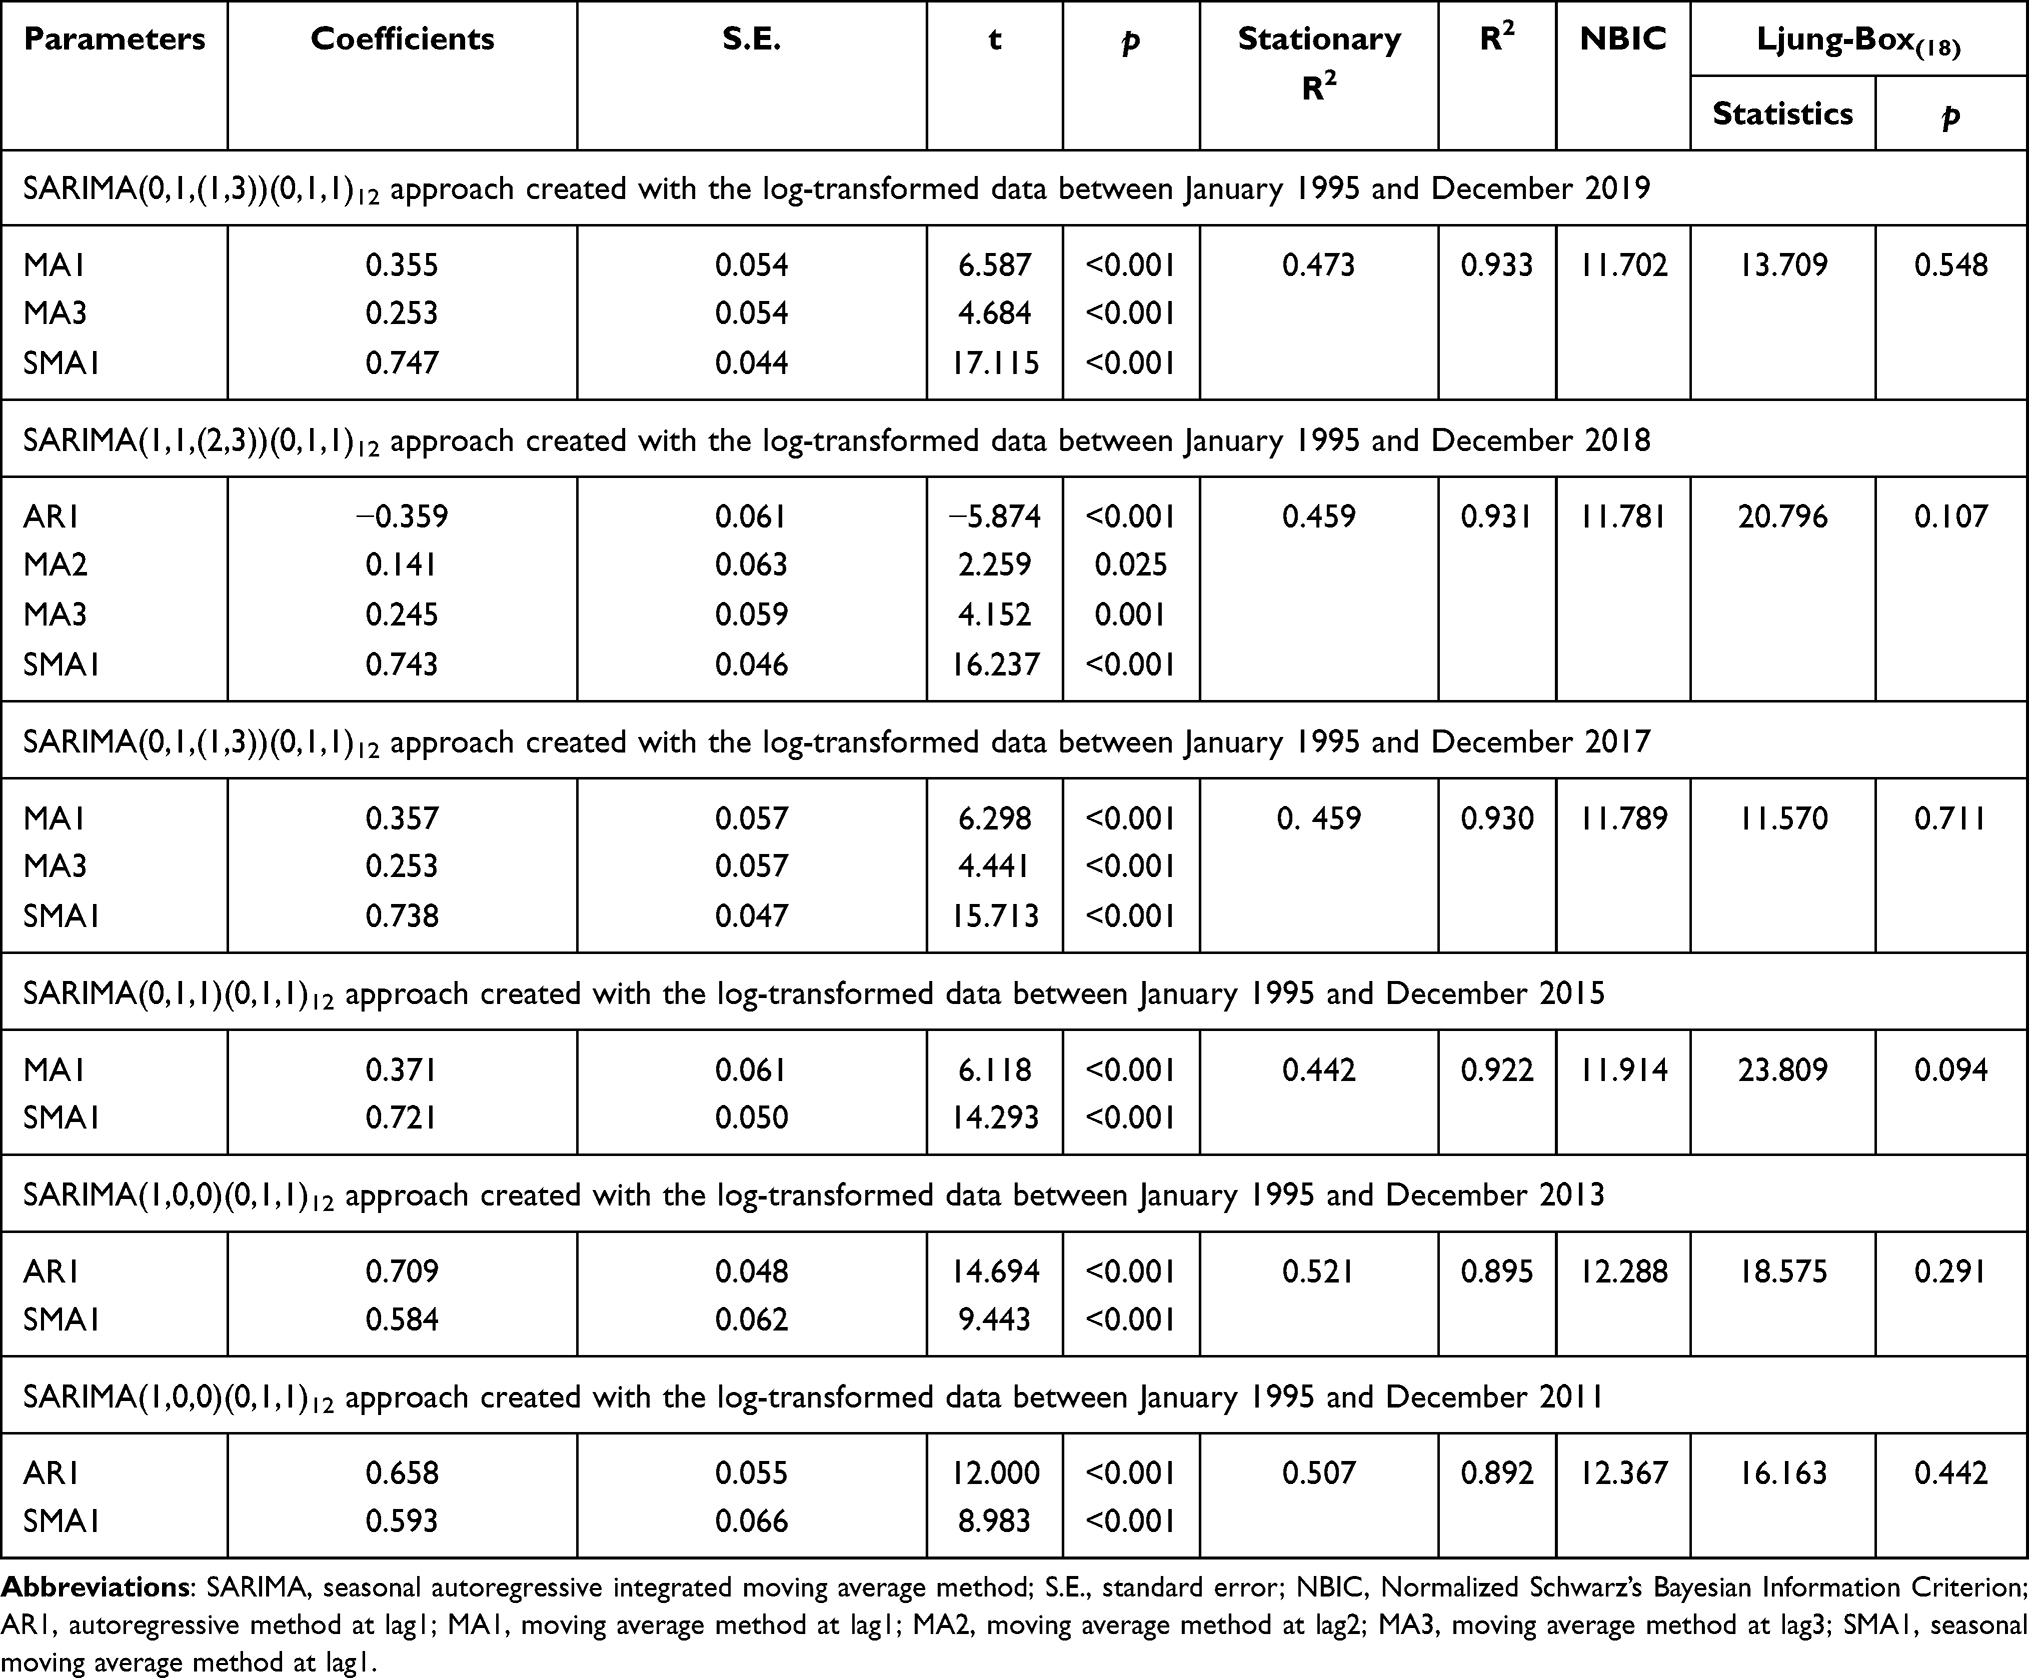 |
Table 1 The Best-Performing SARIMA Models Obtained on the Various Training Sets and Their Parameter Estimations and Goodness of Fit Tests |
 |
Figure 3 Diagnostic test plots for the forecasting errors of the SARIMA model created with the data between 1995 and 2019. (A) Autocorrelation function (ACF) plot, (B) partial autocorrelation function (PACF) plot, and (C) p-values for Ljung-Box statistic. We could see from the sample correlogram that there were little sample ACFs and PACFs touching the significance bounds, except for that at lags 9, 23, and 24, and the p-value was greater than 0.05 under Ljung-Box test statistic. These results meant that the selected SARIMA approach provides an adequate predictive model for the HFRS incidence. |
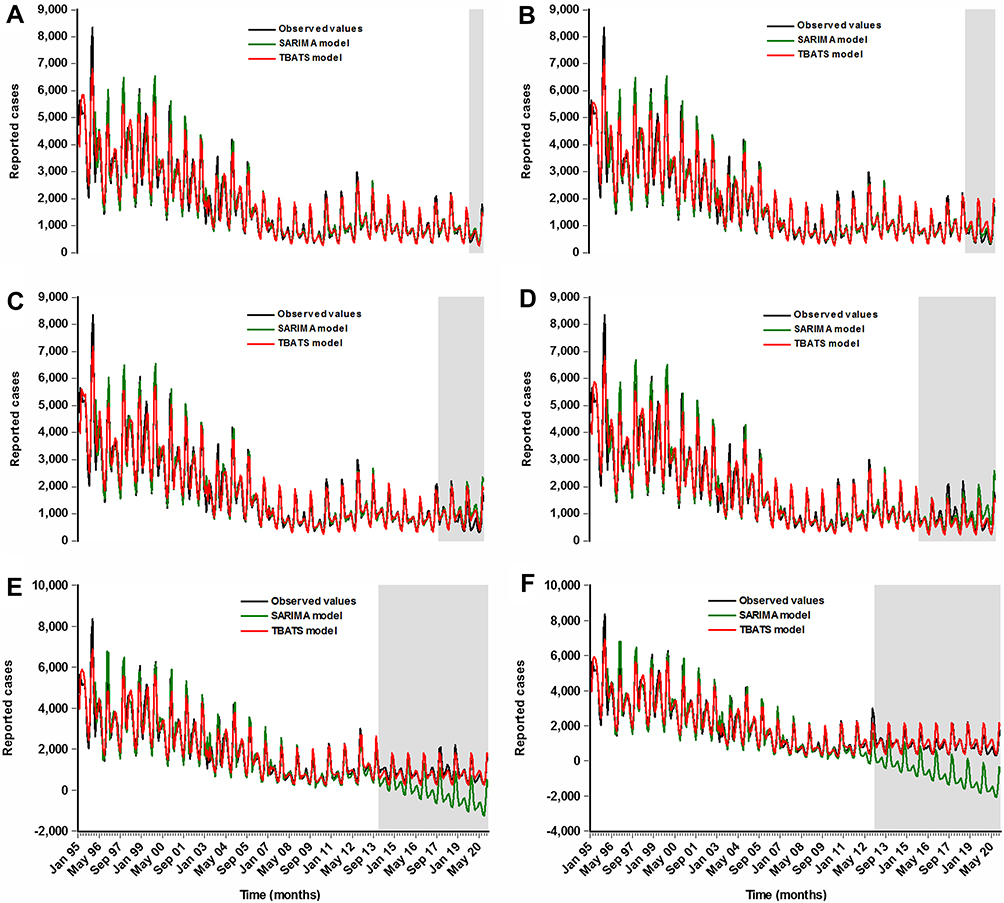 |
Figure 4 Time series plots showing the forecasted results on different datasets between the SARIMA models and the TBATS models. (A) 12-step ahead forecast, (B) 24-step ahead forecast, (C) 36-step ahead forecast, (D) 60-step ahead forecast, (E) 84-step ahead forecast, and (F) 108-step ahead forecast. The out-of-sample predictions are shown as a shaded area in these plots. It was discovered that the out-of-sample predictions under TBATS approaches agreed better with the observed values over the SARIMA approaches, especially for the long-term out-of-sample predictions. |
The Optimal TBATS Method
The predictive results under TBATS method depend largely on the number of Fourier terms used for each seasonal component, and it is difficult to consider all potential combinations when detecting the most adequate harmonics ki in application.21 It was demonstrated that the use of Akaike’s Information Criterion (AIC) is of great help for automated method selection.23 Therefore, in choosing the best TBATS method, taking one seasonal pattern each time into account, we simulated the model to the training series repeatedly by the gradual increase of the numbers of ki but keeping all other harmonics constant each time, until the lowest AIC value is detected. In searching for the best TBATS method, appropriate parameters of the orders (p and q) of the ARMA method must also be selected. Fortunately, these two values can be determined by use of the automatic ARIMA algorithm to the forecast errors under the model with optimal ki combination above.36 If the identified method with ARMA component gives lower AIC compared to that without ARMA component, this model would be retained; otherwise, the ARMA component was not included in the model. After a series of attempts, it was discovered that the TBATS (0.27, {0,0}, -, {<12,4>}) specification was expected to be the preferred model for the forecast of 12 holdout periods because there was a lower AIC value of 5012.207 in this TBATS model than in others, and the resulting key parameters, statistical checking and constituent latent subseries are illustrated in Table S7 and Figures S6 and S7. Similarly, according to the modeling processes above, the TBATS (0.285, {3,0}, -, {<12,4>}), TBATS (0.289, {0,3}, -, {<12,4>}), TBATS (0.302, {0,0}, -, {<12,4>}), TBATS (0.34, {0,0}, -, {<12,4>}), and TBATS (0.325, {0,0}, -, {<12,4>}) specifications were selected as the best models, respectively, for the 24-, 36-, 60-, 84-, and 108-step ahead forecasts, and the resulting additional summary statistics for their key parameters, statistical checking and constituent latent subseries are reported in Table S7 and Figures S6, S8–S12. Subsequently, a prediction into the upcoming HFRS epidemics was able to be achieved based on these best TBATS versions (Figure 4 and Tables S1–S6).
Forecasting Performance Evaluation Between Methods
Table 2 summarizes the measurement metrics testing the predictive accuracy on different datasets under the best SARIMA and TBATS approaches, and the resulting data pinpointed that the advanced best-fitting TBATS methods presented notably lower values of MAD, MAPE, RMSE, RMSPE, and MER over the best-fitting SARIMA methods, with improvements of at least 18% and at most 88% in the accuracies for analyzing both the short- and long-term trends, although the forecasting accuracy displayed a slight decrease with the increase of holdout periods (Table 2 and Figure 4). Considering the advantage of the TBATS method in the estimation of the HFRS epidemics, we re-constructed the best-performing TBATS (0.286, {3,0}, -, {<12,4>}) model based on the 26 entire years of data to nowcast and forecast the HFRS morbidity into 2030 accordingly, and seemingly projecting a plateau of around 90,120 (95% CIs: 25,358 to 244,667) cases, with monthly average 751 (95% CIs: 211 to 2039) case notifications in the next ten years (Figure 5).
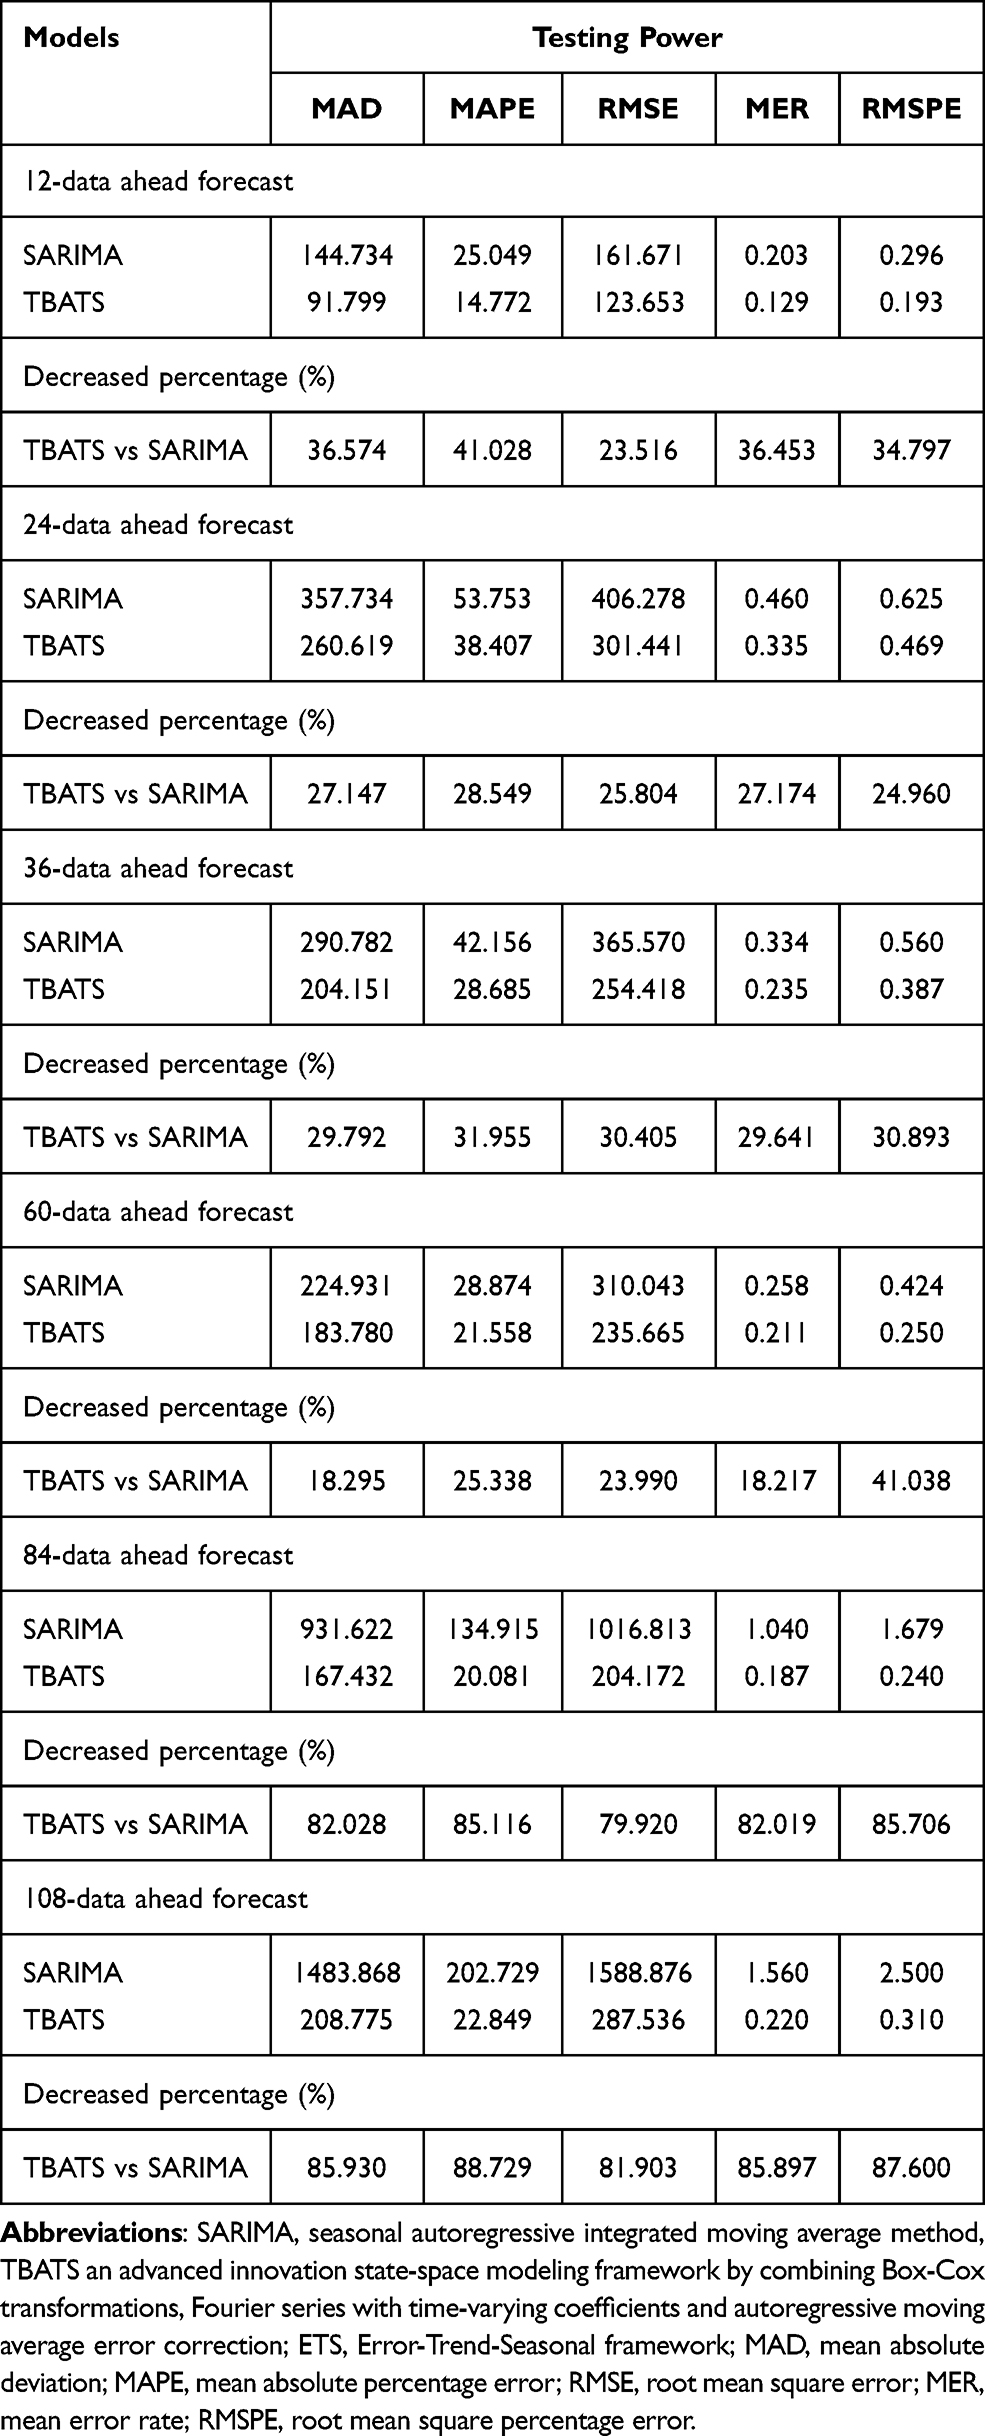 |
Table 2 Comparisons of the Out-of-Sample Forecasting Powers Between SARIMA Models and TBATS Models |
 |
Figure 5 Estimated epidemiological trends and seasonality of HFRS between January 2021 and December 2030 using the best-performing TBATS (0.286, {3,0}, -, {<12,4>}) model. |
Discussion
HFRS poses a serious public health threat in China. Accurately nowcasting and forecasting its epidemic trends and seasonality in the next years are capable of providing the stakeholders some significant hints to develop effective and feasible plans to address the evolving scenarios.37 Although numerous forecasting tools have been applied to do this,38–44 most existing predictive models may be inadequate in analyzing time series with complex seasonal patterns due to their different assumptions,44 enhancing the need for the use of the statistical approaches to handle complex seasonal traits. The advanced TBATS approach is tailored for suiting all the requirements of complex time series.21 However, studies on the use of the TBATS approach to analyze the long-term epidemic trajectories of contagious diseases are rare. Therefore, the current study, for the first time, focused on the exploration of the utility and adequacy in nowcasting and forecasting the long-term epidemiological trends and seasonality of HFRS, and its predictive accuracy level was compared with the most versatile SARIMA method in the field of time series modeling.11,13,16,33 It was discovered that the advanced TBATS methods get a more clear perspective of capturing the dynamic dependency structure in the spreading of HFRS over the SARIMA methods in a series of modeling experiments. What’s more, the long-term forecasting results to emerge from the advanced TBATS method remained reliable and robust with the increase of prediction time windows, despite a slight rise in the values of measurement metrics, including MAD, MAPE, RMSE, RMSPE, and MER. By contrast, the SARIMA model has been unable to analyze and capture the long-term trends of HFRS after 60-step ahead predictions as it produced a MAPE value (which is frequently computed to assess the forecasting accuracy level, a forecast with MAPE value greater than 50% is considered unacceptable45) greater than 50% in both 84 and 108 holdout periods, further providing evidence that the SARIMA method is valid for assessing short- or medium-term trends.46 Our recent work suggests that the Error-Trend-Seasonal framework (ETS) technique has many attractive applications in analyzing the long-run temporal behaviors.33,46 Accordingly, we further established the ETS approach based on the HFRS incidence data to nowcast and forecast its epidemics, and the resulting results indicated that the TBATS method is also more useful and robust for describing the long-term trends of HFRS than the ETS technique, except that in 60-step ahead forecast (Table S8). Also, we used the HFRS incidence data in Liaoning province and Shanxi province (which were hit the hardest with HFRS in the past decades in China) to validate the forecasting reliability of TBATS model. The remarkable results to emerge from these data suggested that the advanced TBATS method still generated a higher forecasting accuracy compared to the SARIMA model (Table S9). As a result, the advanced TBATS method is able to be recommended as a promising and powerful alternative to analyze the long-run trends and seasonality of HFRS in China. In the meantime, this advanced TBATS approach also provides a serviceable aid for directing the present intensity and type of public health measures.47 For instance, if the temporal patterns of HFRS were to start to recede, while this advanced method assessed a marked upward tendency, intimating that the current interventions would be at work in containing the epidemics; otherwise, the present measures required to be optimized.
Time series forecasting is a useful aid for forming hypotheses to understand the epidemic behaviors of different diseases and to estimate their spreading dynamics, and thus favoring the establishment of a quality control system.33 The SARIMA method has been the most popular time series forecasting tool to analyze the morbidity, mortality, and prevalence of infectious diseases (eg, HFRS,40,41 Human Brucellosis,48 COVID-19,33 hand-foot-mouth disease (HFMD),28 Syphilis,49 dengue,50 Dysentery51) over the last years because of its simple structure, fast applicability, relatively high prediction accuracy, and potential to interpret the target series. However, as evidenced by the findings from our study and others, the SARIMA method is only appropriate for analyzing short- or medium-term trends and cannot deal with the nonlinear information in a complex time series due to its linear assumption.13,16,52,53 Instead, the advanced TBATS method was developed by adding the trigonometric representation of seasonal components based on Fourier series to the traditional BATS approach, which allows it to not only deal with all of the complex time series but also to handle both linear and non-linear components,23,25 whilst accommodating a dynamic seasonal patterns over time,25 and hence leading to its usefulness and flexibility in analyzing the long-term trends and seasonality of time series. Given its attractive applications of the TBATS method and our previous work,53 it appears that the importance of this advanced method as a powerful forecasting tool is expected to be emphasized in analyzing the long-term temporal levels of HFRS in other regions or other communicable diseases, and yet validation needs to be done. Besides, some new advanced statistical techniques (eg, bayesian structural time series technique,37 flexible transmitter network,54 the optimized theta method,55 and age-structure mathematical model56) are also recently demonstrated to have the potential to make a long-term forecast for the time series. As a result, what is now required is work focused on the comparisons of the forecasting accuracy between the TBATS approach and the above-mentioned models.
Different from prior studies that reported a re-emerging risk in the HFRS morbidity in China,5,6,8,10 our study indicated an evident reduction in the numbers of HFRS cases over the 26 years of data (AAPC=−6.767, 95% CIs: −10.592 to −2.778; t=−3.278, p=0.001), consistent with the epidemiological trends reported in several countries in Asia,57 and yet in disagreement with that in Russia.4 This discrepancy may be related to the different causative agents, geographical environments, social economy, preventive measures, and public awareness. In China, many enhanced prevention and control measures, including effective environmental management, elimination of rodents, vaccination, publicize education, improvement of the living and working environments, along with rapid urbanization and mechanization of farming, have favored the decrease in the HFRS-related morbidity and mortality in the past.58 Even so, it was discovered that HFRS displayed changing epidemiological trends in different stages, a remarkable reduction during 1995–2004 (APC=−8.964, 95% CIs: −11.667 to −6.179; t=−6.547, p<0.001) and during 2004–2008 (APC=−37.153, 95% CIs: −37.153 to 3.279; t=−1.828, p=0.084), and a relatively stable epidemic trend during 2008–2020 (APC=−0.349, 95% CIs: −3.992 to 3.431; t=−0.197, p=0.846). Importantly, such an epidemiological trend would be predicted to continue in the ten years to come under TBATS model. Besides, it was noted that HFRS showed a cyclical fluctuation with 3–5 years since 2008, in agreement with the findings in previous reports,59,60 which also indicated that periodic outbreak is an important epidemiological feature in the HFRS incidence, albeit these studies reported a longer time window of 7–12 years.59,60 It seems that several possible reasons contribute to the changing epidemiology in the HFRS incidence in recent years; one may be associated with the effects of climate variability, responsible for many emerging or re-emerging infectious diseases around the world.8,61 HFRS has been thought of as a climate-sensitive illness since meteorological parameters play an important indirect or direct role in the infection rates, habitats, reproductive rates, and incubation period of rodents.8,62 Another may be closely correlated with the rapidly growing tourism in China; tourists can be infected with the pathogenic agents of HFRS in the endemic areas and then can be spread to the non-epidemic areas,63 which seems to well explain the geographical expansion of HFRS in recent years.10 The third may be due to the emergence of new Hantavirus subtypes.9 Recent several studies have suggested that the novel identified Seoul viruses may pose a great threat to the control of HFRS.9,64 Finally, the continued decrease in the HFRS incidence in the past may also have relaxed the interventions and public awareness, leading to the changing epidemiology and even the recurring risk.65
Seasonal profile of HFRS has been reported in different countries.4,22,58 A marked semi-annual seasonal behavior was also seen in our study, with a weak peak between May and June, and a strong one between November and December. Besides, the predicted HFRS morbidity also showed the same seasonal pattern as that during 1995–2020 (Figure S13). Our seasonal profile concurs well with previous findings from Russia4 and South Korea,66 also in line with that in most provinces or cities from across China (eg, Changsha city,60 Heilongjiang province,67 Anqiu city,7 Zibo city,68 Shanxi province,69 Zhejiang province70). We surmised that different climatic features and etiological factors contributed to this difference in the amplitude of peak activities. In China, it was discovered that the HFRS-causing HTNV can occur throughout the year, and yet the majority of them became infected with HTNV in fall and winter; by contrast, the HFRS-causing SEOV is mainly reported in spring.6,10 The main natural reservoir hosts of the above two causative factors are predominantly spread by the striped field mouse (A.agrarius) and brown Norway rat (R.norvegicus), respectively.8 Weather factors (eg, temperature, rainfall, relative humidity, precipitation) have been shown to have a great influence on the population dynamics of the main natural reservoir hosts of HTNV and SEOV,8,62,64,71 and the effects of temperature and relative humidity on HFRS was demonstrated to show a U-shaped curve,64 this fits well with the bimodal seasonal distribution present in spring and winter in the HFRS case notifications.
Our findings emerged from the present investigation successfully indicate the usefulness and flexibility of the TBATS approach in describing and forecasting the long-term seasonality and trends of HFRS. Nevertheless, this work also suffers from certain shortfalls. First, under-reporting and under-diagnosis of HFRS cases may be inevitable in passive surveillance, notwithstanding the well-monitored data quality under mandatory reporting in China. Second, we noted from Tables S1–S6 and Figure 5 that the resulting predicted 95% CIs visibly broadened with the increase of the forecasted time windows, despite its high forecasting accuracy and robustness of the TBATS method. Thus, the model should be updated in time by including new series to ensure its forecasting reliability level. Third, from Figure S6 we can see that the forecasting potential of the TBATS model may be further improved, despite its high forecasting accuracy. Therefore, further work needs to be performed to establish whether the predictive ability of the TBATS model can be improved by combing this model and neural network techniques. Fourth, the current findings from this study reflect how well the TBATS method estimates the long-run seasonality and trends of HFRS in China, whether it is valid for analyzing the long-term trends and seasonality in other countries or other communicable diseases, additional studies are required to investigate. Finally, the multivariate TBATS method may provide a higher forecasting accuracy. However, we are unable to do this owing to the unavailability of such a TBATS model with regression covariates and HFRS-associated factors in this study.
Conclusion
The interesting findings to emerge from this work reveal that the TBATS method does a better job of describing and forecasting the long-term seasonality and trends of HFRS, which is capable of being deemed as a feasible and serviceable alternative to help stakeholders to inform future preventive policy or practical solutions to control the HFRS epidemics in China. Besides, under current interventions, it is challenging to eliminate the HFRS epidemics in the next ten years considering the resultant forecasts of around 90,120 (95% CIs: 25,358 to 244,667) cases, with monthly average 751 (95% CIs: 211 to 2039) case notifications in the ten years to come using the TBATS method, intimating that additional or comprehensive prevention and control measures must be formulated to tackle this evolving scenario.
Data Sharing Statement
All data are fully available without restriction in Supplementary material (see Table S10).
Acknowledgments
We thank all the people who participated in the gathering of HFRS cases. This study was supported by the Innovation and Entrepreneurship Training Project for University Students of Henan Province and Xinxiang Medical University (202010472007 and XYXSKYZ201932), the Key Scientific Research Project of Universities in Henan (21A330004), and the National Natural Fund Youth Project (31802024).
Author Contributions
All authors made a significant contribution to the work reported, whether that is in the conception, study design, execution, acquisition of data, analysis and interpretation, or in all these areas; took part in drafting, revising or critically reviewing the article; gave final approval of the version to be published; have agreed on the journal to which the article has been submitted; and agree to be accountable for all aspects of the work.
Disclosure
The authors report no conflicts of interest in this work.
References
1. Centers for Disease Control and Prevention. Hemorrhagic fever with renal syndrome (HFRS). Available from: https://www.cdc.gov/hantavirus/hfrs/index.html.
2. Zou LX, Chen MJ, Sun L. Haemorrhagic fever with renal syndrome: literature review and distribution analysis in China. Int J Infect Dis. 2016;43:95–100. doi:10.1016/j.ijid.2016.01.003
3. Kang C, Kim JI, Lee J, et al. Human infection with Seoul orthohantavirus in Korea, 2019. PLoS Negl Trop Dis. 2021;15(2):e0009168. doi:10.1371/journal.pntd.0009168
4. Tkachenko EA, Ishmukhametov AA, Dzagurova TK, et al. Hemorrhagic fever with renal syndrome, Russia. Emerg Infect Dis. 2019;25(12):2325–2328. doi:10.3201/eid2512.181649
5. Wu G, Xia Z, Wang F, et al. Investigation on risk factors of haemorrhagic fever with renal syndrome (HFRS) in Xuancheng City in Anhui Province, Mainland China. Epidemiol Infect. 2020;148:e248. doi:10.1017/S0950268820002344
6. Wang Y, Xu C, Wu W, et al. Time series analysis of temporal trends in hemorrhagic fever with renal syndrome morbidity rate in China from 2005 to 2019. Sci Rep. 2020;10(1):9609. doi:10.1038/s41598-020-66758-4
7. Shi F, Yu C, Yang L, et al. Exploring the dynamics of hemorrhagic fever with renal syndrome incidence in East China through seasonal autoregressive integrated moving average models. Infect Drug Resist. 2020;13:2465–2475. doi:10.2147/IDR.S250038
8. Sun W, Liu X, Li W, Mao Z, Sun J, Lu L. Effects and interaction of meteorological factors on hemorrhagic fever with renal syndrome incidence in Huludao City, northeastern China, 2007–2018. PLoS Negl Trop Dis. 2021;15(3):e0009217. doi:10.1371/journal.pntd.0009217
9. Tian H, Tie WF, Li H, et al. Orthohantaviruses infections in humans and rodents in Baoji, China. PLoS Negl Trop Dis. 2020;14(10):e0008778. doi:10.1371/journal.pntd.0008778
10. Wang Q, Yue M, Yao P, et al. Epidemic trend and molecular evolution of HV family in the main hantavirus epidemic areas from 2004 to 2016, in P.R. China. Front Cell Infect Microbiol. 2020;10:584814. doi:10.3389/fcimb.2020.584814
11. Wang Y, Xu C, Li Y, et al. An advanced data-driven hybrid model of SARIMA-NNNAR for tuberculosis incidence time series forecasting in Qinghai Province, China. Infect Drug Resist. 2020;13:867–880. doi:10.2147/IDR.S232854
12. Zhang YQ, Li XX, Li WB, et al. Analysis and prediction of tuberculosis registration rates in Henan Province, China: an exponential smoothing model study. Infect Dis Poverty. 2020;9(1):123. doi:10.1186/s40249-020-00742-y
13. Li Z, Wang Z, Song H, et al. Application of a hybrid model in predicting the incidence of tuberculosis in a Chinese population. Infect Drug Resist. 2019;12:1011–1020. doi:10.2147/idr.s190418
14. He F, Hu ZJ, Zhang WC, Cai L, Cai GX, Aoyagi K. Construction and evaluation of two computational models for predicting the incidence of influenza in Nagasaki Prefecture, Japan. Sci Rep. 2017;7(1):7192. doi:10.1038/s41598-017-07475-3
15. Wang YW, Shen ZZ, Jiang Y. Comparison of ARIMA and GM(1,1) models for prediction of hepatitis B in China. PLoS One. 2018;13(9):e0201987. doi:10.1371/journal.pone.0201987
16. Liu Q, Li Z, Ji Y, et al. Forecasting the seasonality and trend of pulmonary tuberculosis in Jiangsu Province of China using advanced statistical time-series analyses. Infect Drug Resist. 2019;12:2311–2322. doi:10.2147/idr.s207809
17. Gou F, Liu X, He J, et al. Different responses of weather factors on hand, foot and mouth disease in three different climate areas of Gansu, China. BMC Infect Dis. 2018;18(1):15. doi:10.1186/s12879-017-2860-4
18. Liang F, Guan P, Wu W, Huang D. Forecasting influenza epidemics by integrating internet search queries and traditional surveillance data with the support vector machine regression model in Liaoning, from 2011 to 2015. PeerJ. 2018;6:e5134. doi:10.7717/peerj.5134
19. Zheng YL, Zhang LP, Zhang XL, Wang K, Zheng YJ. Forecast model analysis for the morbidity of tuberculosis in Xinjiang, China. PLoS One. 2015;10(3):e0116832. doi:10.1371/journal.pone.0116832
20. Taylor JW. Short-term electricity demand forecasting using double seasonal exponential smoothing. J Oper Res Soc. 2003;54(8):799–805. doi:10.1057/palgrave.jors.2601589
21. Livera AMD, Hyndman RJ. Forecasting time series with complex seasonal patterns using exponential smoothing. J Am Stat Assoc. 2011;106(496):1513–1527. doi:10.1198/jasa.2011.tm09771
22. Ryou J, Lee HI, Yoo YJ, et al. Prevalence of hantavirus infection in wild rodents from five provinces in Korea, 2007. J Wildl Dis. 2011;47(2):427–432. doi:10.7589/0090-3558-47.2.427
23. Sakizadeh M. Spatiotemporal variations and characterization of the chronic cancer risk associated with benzene exposure. Ecotoxicol Environ Saf. 2019;182:109387. doi:10.1016/j.ecoenv.2019.109387
24. Cherrie MPC, Nichols G, Iacono GL, Sarran C, Hajat S, Fleming LE. Pathogen seasonality and links with weather in England and Wales: a big data time series analysis. BMC Public Health. 2018;18(1):1067. doi:10.1186/s12889-018-5931-6
25. Barrela R, Amado C, Loureiro D, Mamade A. Data reconstruction of flow time series in water distribution systems – a new method that accommodates multiple seasonality. J Hydroinform. 2017;19(1–2):238–250. doi:10.2166/hydro.2016.192
26. Jacek B, Grzegorz M, Beata S, Wadim S. Multi-seasonality in the TBATS model using demand for electric energy as a case study. Eco Comput Eco Cyb. 2018;52(1):229–246.
27. Zheng A, Fang Q, Zhu Y, Jiang C, Jin F, Wang X. An application of ARIMA model for predicting total health expenditure in China from 1978–2022. J Glob Health. 2020;10(1):010803. doi:10.7189/jogh.10.010803
28. Tian CW, Wang H, Luo XM. Time-series modelling and forecasting of hand, foot and mouth disease cases in China from 2008 to 2018. Epidemiol Infect. 2019;147:e82. doi:10.1017/S095026881800362X
29. Chen Y, Leng K, Lu Y, et al. Epidemiological features and time-series analysis of influenza incidence in urban and rural areas of Shenyang, China, 2010–2018. Epidemiol Infect. 2020;148:e29. doi:10.1017/S0950268820000151
30. Bartholomew D, Box GEP, Jenkins GM. Time Series Analysis: Forecasting and Control.
31. Wang Y, Xu C, Yao S, Zhao Y. Forecasting the epidemiological trends of COVID-19 prevalence and mortality using the advanced α-Sutte Indicator. Epidemiol Infect. 2020;148:e236. doi:10.1017/s095026882000237x
32. Help-IBM SPSS Statistics. Specifying options for the expert modeler. Available from: http://127.0.0.1:52807/help/index.jsp?topic=%2Fcom.ibm.spss.statistics.help%2Fspss%2Fbase%2Fovervw_auto_0.htm.
33. Wang Y, Xu C, Yao S, et al. Estimating the prevalence and mortality of coronavirus disease 2019 (COVID-19) in the USA, the UK, Russia, and India. Infect Drug Resist. 2020;13:3335–3350. doi:10.2147/idr.s265292
34. Guan P, Wu W, Huang D. Trends of reported human brucellosis cases in mainland China from 2007 to 2017: an exponential smoothing time series analysis. Environ Health Prev Med. 2018;23(1):23. doi:10.1186/s12199-018-0712-5
35. Armitage P, Berry G, Matthews JNS. Statistical Methods in Medical Research.
36. Hyndman R, Athanasopoulos G, Bergmeir C, et al. Forecast: forecasting functions for time series and linear models. Available from: https://cranr-projectorg/web/packages/forecast.
37. Feroze N. Forecasting the patterns of COVID-19 and causal impacts of lockdown in top five affected countries using Bayesian Structural Time Series Models. Chaos Solitons Fractals. 2020;140:110196. doi:10.1016/j.chaos.2020.110196
38. Liu Q, Liu X, Jiang B, Yang W. Forecasting incidence of hemorrhagic fever with renal syndrome in China using ARIMA model. BMC Infect Dis. 2011;11:218. doi:10.1186/1471-2334-11-218
39. Wang T, Liu J, Zhou Y, et al. Prevalence of hemorrhagic fever with renal syndrome in Yiyuan County, China, 2005–2014. BMC Infect Dis. 2016;16:69. doi:10.1186/s12879-016-1404-7
40. Wang T, Zhou Y, Wang L, Huang Z, Cui F, Zhai S. Using an autoregressive integrated moving average model to predict the incidence of hemorrhagic fever with renal syndrome in Zibo, China, 2004–2014. Jpn J Infect Dis. 2016;69(4):279–284. doi:10.7883/yoken.JJID.2014.567
41. Li Q, Guo NN, Han ZY, et al. Application of an autoregressive integrated moving average model for predicting the incidence of hemorrhagic fever with renal syndrome. Am J Trop Med Hyg. 2012;87(2):364–370. doi:10.4269/ajtmh.2012.11-0472
42. Qi C, Zhang D, Zhu Y, et al. SARFIMA model prediction for infectious diseases: application to hemorrhagic fever with renal syndrome and comparing with SARIMA. BMC Med Res Methodol. 2020;20(1):243. doi:10.1186/s12874-020-01130-8
43. Ke G, Hu Y, Huang X, et al. Epidemiological analysis of hemorrhagic fever with renal syndrome in China with the seasonal-trend decomposition method and the exponential smoothing model. Sci Rep. 2016;6:39350. doi:10.1038/srep39350
44. Wu W, Guo J, An S, et al. Comparison of two hybrid models for forecasting the incidence of hemorrhagic fever with renal syndrome in Jiangsu Province, China. PLoS One. 2015;10(8):e0135492. doi:10.1371/journal.pone.0135492
45. Pao HT. Forecasting energy consumption in Taiwan using hybrid nonlinear models. Energy. 2009;34(10):1438–1446. doi:10.1016/j.energy.2009.04.026
46. Wang Y, Xu C, Ren J, et al. Secular seasonality and trend forecasting of tuberculosis incidence rate in China using the advanced error-trend-seasonal framework. Infect Drug Resist. 2020;13:733–747. doi:10.2147/IDR.S238225
47. Zhang S, Diao M, Yu W, Pei L, Lin Z, Chen D. Estimation of the reproductive number of novel coronavirus (COVID-19) and the probable outbreak size on the Diamond Princess cruise ship: a data-driven analysis. Int J Infect Dis. 2020;93:201–204. doi:10.1016/j.ijid.2020.02.033
48. Yang L, Bi ZW, Kou ZQ, et al. Time-series analysis on human brucellosis during 2004–2013 in Shandong Province, China. Zoonoses Public Health. 2015;62(3):228–235. doi:10.1111/zph.12145
49. Zhang X, Zhang T, Pei J, Liu Y, Li X, Medrano-Gracia P. Time series modelling of syphilis incidence in China from 2005 to 2012. PLoS One. 2016;11(2):e0149401. doi:10.1371/journal.pone.0149401
50. Cortes F, Turchi Martelli CM, Arraes de Alencar Ximenes R, et al. Time series analysis of dengue surveillance data in two Brazilian cities. Acta Trop. 2018;182:190–197. doi:10.1016/j.actatropica.2018.03.006
51. Wang K, Song W, Li J, Lu W, Yu J, Han X. The use of an autoregressive integrated moving average model for prediction of the incidence of dysentery in Jiangsu, China. Asia Pac J Public Health. 2016;28(4):336–346. doi:10.1177/1010539516645153
52. Wang H, Tian CW, Wang WM, Luo XM. Time-series analysis of tuberculosis from 2005 to 2017 in China. Epidemiol Infect. 2018;146(8):935–939. doi:10.1017/S0950268818001115
53. Yu C, Xu C, Li Y, Yao S, Bai Y. Time series analysis and forecasting of the hand-foot-mouth disease morbidity in China using an advanced exponential smoothing state space TBATS model. Infect Drug Resist. 2021;14:2809–2821. doi:10.2147/idr.s304652
54. Zhang SQ, Zhou ZH. Flexible transmitter network. 2020.
55. Fiorucci JA, Pellegrini TR, Louzada F, Petropoulos F, Koehler AB. Models for optimising the theta method and their relationship to state space models. Int J Forecasting. 2016;32(4):1151–1161. doi:10.1016/j.ijforecast.2016.02.005
56. Zhao Y, Li M, Yuan S. Analysis of transmission and control of tuberculosis in Mainland China, 2005–2016, based on the age-structure mathematical model. Int J Environ Res Public Health. 2017;14(10):1192. doi:10.3390/ijerph14101192
57. Joshi YP, Kim EH, Cheong HK. The influence of climatic factors on the development of hemorrhagic fever with renal syndrome and leptospirosis during the peak season in Korea: an ecologic study. BMC Infect Dis. 2017;17(1):406. doi:10.1186/s12879-017-2506-6
58. Zou LX, Sun L. Analysis of hemorrhagic fever with renal syndrome using wavelet tools in Mainland China, 2004–2019. Front Public Health. 2020;8:571984. doi:10.3389/fpubh.2020.571984
59. Zhang YH, Ge L, Liu L, et al. The epidemic characteristics and changing trend of hemorrhagic fever with renal syndrome in Hubei Province, China. PLoS One. 2014;9(3):e92700. doi:10.1371/journal.pone.0092700
60. Xiao H, Tian HY, Cazelles B, et al. Atmospheric moisture variability and transmission of hemorrhagic fever with renal syndrome in Changsha City, Mainland China, 1991–2010. PLoS Negl Trop Dis. 2013;7(6):e2260. doi:10.1371/journal.pntd.0002260
61. Wu X, Lu Y, Zhou S, Chen L, Xu B. Impact of climate change on human infectious diseases: empirical evidence and human adaptation. Environ Int. 2016;86:14–23. doi:10.1016/j.envint.2015.09.007
62. Wei Y, Wang Y, Li X, et al. Meteorological factors and risk of hemorrhagic fever with renal syndrome in Guangzhou, southern China, 2006–2015. PLoS Negl Trop Dis. 2018;12(6):e0006604. doi:10.1371/journal.pntd.0006604
63. Hofmann J, Weiss S, Kuhns M, Zinke A, Heinsberger H, Kruger DH. Importation of human seoul virus infection to Germany from Indonesia. Emerg Infect Dis. 2018;24(6):1099–1102. doi:10.3201/eid2406.172044
64. Jiang F, Wang L, Wang S, et al. Meteorological factors affect the epidemiology of hemorrhagic fever with renal syndrome via altering the breeding and hantavirus-carrying states of rodents and mites: a 9 years’ longitudinal study. Emerg Microbes Infect. 2017;6(11):e104. doi:10.1038/emi.2017.92
65. Jiang F, Zhang Z, Dong L, et al. Prevalence of hemorrhagic fever with renal syndrome in Qingdao City, China, 2010–2014. Sci Rep. 2016;6:36081. doi:10.1038/srep36081
66. Kim JH, Cheong HK. Increasing number of scarlet fever cases, South Korea, 2011–2016. Emerg Infect Dis. 2018;24(1):172–173. doi:10.3201/eid2401.171027
67. Li CP, Cui Z, Li SL, et al. Association between hemorrhagic fever with renal syndrome epidemic and climate factors in Heilongjiang Province, China. Am J Trop Med Hyg. 2013;89(5):1006–1012. doi:10.4269/ajtmh.12-0473
68. Wang L, Wang T, Cui F, et al. Hemorrhagic fever with renal syndrome, Zibo City, China, 2006–2014. Emerg Infect Dis. 2016;22(2):274–276.
69. Liang W, Gu X, Li X, et al. Mapping the epidemic changes and risks of hemorrhagic fever with renal syndrome in Shaanxi Province, China, 2005–2016. Sci Rep. 2018;8(1):749. doi:10.1038/s41598-017-18819-4
70. Wu H, Wang X, Xue M, et al. Spatial-temporal characteristics and the epidemiology of haemorrhagic fever with renal syndrome from 2007 to 2016 in Zhejiang Province, China. Sci Rep. 2018;8(1):10244. doi:10.1038/s41598-018-28610-8
71. Zhang WY, Guo WD, Fang LQ, et al. Climate variability and hemorrhagic fever with renal syndrome transmission in Northeastern China. Environ Health Perspect. 2010;118(7):915–920. doi:10.1289/ehp.0901504
 © 2021 The Author(s). This work is published and licensed by Dove Medical Press Limited. The
full terms of this license are available at https://www.dovepress.com/terms
and incorporate the Creative Commons Attribution
- Non Commercial (unported, 3.0) License.
By accessing the work you hereby accept the Terms. Non-commercial uses of the work are permitted
without any further permission from Dove Medical Press Limited, provided the work is properly
attributed. For permission for commercial use of this work, please see paragraphs 4.2 and 5 of our Terms.
© 2021 The Author(s). This work is published and licensed by Dove Medical Press Limited. The
full terms of this license are available at https://www.dovepress.com/terms
and incorporate the Creative Commons Attribution
- Non Commercial (unported, 3.0) License.
By accessing the work you hereby accept the Terms. Non-commercial uses of the work are permitted
without any further permission from Dove Medical Press Limited, provided the work is properly
attributed. For permission for commercial use of this work, please see paragraphs 4.2 and 5 of our Terms.