Back to Journals » Journal of Inflammation Research » Volume 16
Establishment and Validation of a Nomogram Prediction Model for the Severe Acute Pancreatitis
Authors Li B, Wu W ![]() , Liu A
, Liu A ![]() , Feng L
, Feng L ![]() , Li B
, Li B ![]() , Mei Y
, Mei Y ![]() , Tan L
, Tan L ![]() , Zhang C
, Zhang C ![]() , Tian Y
, Tian Y ![]()
Received 22 April 2023
Accepted for publication 1 July 2023
Published 8 July 2023 Volume 2023:16 Pages 2831—2843
DOI https://doi.org/10.2147/JIR.S416411
Checked for plagiarism Yes
Review by Single anonymous peer review
Peer reviewer comments 3
Editor who approved publication: Professor Ning Quan
Bo Li,1 Weiqing Wu,1 Aijun Liu,1 Lifeng Feng,1 Bin Li,1 Yong Mei,1 Li Tan,1 Chaoyang Zhang,2 Yangtao Tian1
1Department of Pancreatic Surgery, Shangluo Center Hospital, Shangluo, Shaanxi, 726000, People’s Republic of China; 2Department of Ultrasound Medicine, Shangluo Center Hospital, Shangluo, Shaanxi, 726000, People’s Republic of China
Correspondence: Yangtao Tian, Department of Pancreatic Surgery, Shangluo Center Hospital, 37 Shangyang, Shangzhou, Shangluo, Shaanxi, 726000, People’s Republic of China, Email [email protected]
Background: Severe acute pancreatitis (SAP) can progress to lung and kidney dysfunction, and blood clotting within 48 hours of its onset, and is associated with a high mortality rate. The aim of this study was to establish a reliable diagnostic prediction model for the early stage of severe pancreatitis.
Methods: The clinical data of patients diagnosed with acute pancreatitis from October 2017 to June 2022 at the Shangluo Central Hospital were collected. The risk factors were screened by least absolute shrinkage and selection operator (LASSO) regression analysis. A novel nomogram model was then established by multivariable logistic regression analysis.
Results: The data of 436 patients with acute pancreatitis, 45 (10.3%) patients had progressed to SAP. Through univariate and LASSO regression analyses, the neutrophils (P < 0.001), albumin (P < 0.001), blood glucose (P < 0.001), serum calcium (P < 0.001), serum creatinine (P < 0.001), blood urea nitrogen (P < 0.001) and procalcitonin (P = 0.005) were identified as independent predictive factors for SAP. The nomogram built on the basis of these factors predicted SAP with sensitivity of 0.733, specificity of 0.9, positive predictive value of 0.458 and negative predictive value of 0.967. Furthermore, the concordance index of the nomogram reached 0.889 (95% CI, 0.837– 0.941), and the area under the curve (AUC) in receiver operating characteristic curve (ROC) analysis was significantly higher than that of the APACHEII and ABISAP scoring systems. The established model was validated by plotting the clinical decision curve analysis (DCA) and clinical impact curve (CIC).
Conclusion: We established a nomogram to predict the progression of early acute pancreatitis to SAP with high discrimination and accuracy.
Keywords: acute pancreatitis, prediction model, risk factor, nomogram, decision curve analysis
Introduction
Acute pancreatitis (AP) is an abdominal inflammatory disease that is caused by various factors,1 such as biliary stones, alcoholic, hyperlipidemia, dietary, etc. It can potentially involve the tissues surrounding the pancreas or distant organs.2 While most patients with mild acute pancreatitis (MAP) recover after treatment,3 approximately 20%1,4 of the patients can rapidly progress to pancreatic necrosis accompanied by varying degrees of organ failure,2 resulting in serious complications and high mortality. The prognosis and mortality rate of AP depend on its severity,4 treatment strategies5 and complications. The first classification standard for the severity of AP was established in 1992,6 and according to the latest guidelines published in 2012,7 AP is classified into MAP, moderately severe acute pancreatitis (MSAP) and severe acute pancreatitis (SAP).
Studies show that 75%–80% of patients with AP can recover after intravenous infusion and symptomatic supportive therapy.5 The disease is self-limiting and usually resolves within 1 week.1,5 However, it may progress to varying degrees of complications and even multiple organ failure in some patients, resulting in mortality rates of up to 30%.5,8 Early diagnosis and determination of the severity of the disease are crucial for timely intervention. The Bedside Index of Severity in Acute Pancreatitis (BISAP) and the Acute Physiology and Chronic Health Evaluation II (APACHE II) scales are most commonly used9,10 to evaluating the severity of AP. However, these scoring systems have disadvantages, such as numerous and complex indicators, lack of convenience, and inability to assess the severity of AP within 24 hours.9,11 Moreover, many indicators lack specificity, which reduces the accuracy of the scoring system. In recent years, several studies12–14 have shown that C-reactive protein,15 serum procalcitonin,16 neutrophil and lymphocyte ratio,17 red blood cell distribution width,14 mean platelet volume, hemoglobin content, prothrombin time18 and D-dimer are potential predictors of SAP, although the thresholds of these single predictors are inconsistent across the studies. In addition, abdominal computed tomography (CT), based on imaging features of the pancreas and its surroundings, can be used as a diagnostic criterion for AP.19–21 But CT is expensive and the imaging features develop after 48 hours of onset. It is crucial to identify simple, inexpensive and easy-to-measure clinical indicators that can be used to diagnose AP and determine its severity within 24 hours of onset.
Although AP is one of the most common acute peritonitis,22 MAP and MSAP are also highly prevalent,23,24 with reported incidence of more than 70%.25 SAP is characterized by disseminated intravascular coagulation (DIC), multi-organ failure, severe metabolic disorders, pancreatic necrosis, pancreatic abscess and pseudocysts, and develops in approximately 20% of the AP patients, with a high fatality rate.1 The cure rate of SAP has improved in recent years with advances in surgical treatment,26 monitoring methods, antibiotics and inhibitory drugs. Currently, non-surgical treatment is recommended in the early stage of the lesions, whereas surgical intervention is required for secondary infections in the later stage. According to the current definition and classification of SAP,27–29 it can only be accurately diagnosed after a long period of monitoring. The aim of this study was to identify early risk factors of SAP and establish a diagnostic model through retrospective analysis of patients with AP. We constructed a predictive nomogram, which performed better compared to the APACHEII and BISAP scoring systems. The predictive performance of the model was verified through consistency index (C-index), calibration curve, decision curve analysis (DCA), clinical impact curve (CIC), and bootstrap internal validation.
Materials and Methods
Patients
The data of 436 inpatients diagnosed with AP from October 2017 to June 2022 at the Shangluo Central Hospital was retrospectively analyzed. All enrolled patients agreed to participate in this study, and signed the informed consent form. The included patients met at least two out of the following inclusion criteria: (1) typical clinical symptoms of AP with persistent abdominal pain, (2) serum amylase and/or lipase levels greater than three times the upper limit of normal, and (3) abdominal ultrasound and/or CT images showing characteristic changes in pancreatitis. The other inclusion criteria were as follows: (1) availability of complete laboratory parameters and clinical data obtained within 24 hours of admission, (2) the first onset of AP, and (3) age ≥ 18 years. The criteria for exclusion was any of the following: (1) course of disease at the time of admission longer than 48 hour, (2) history of abdominal trauma, (3) history of combined pancreatic surgery, (4) hematological diseases, (5) malignant tumors or radiotherapy and chemotherapy, and (6) pregnancy. This study was approved by the Ethics Committee of Shangluo Central Hospital. The patients were divided into SAP (n=45) and non-SAP (n=391) groups according to the revised 2012 Atlanta Acute Pancreatitis Classification Criteria7 and the 36th International Symposium on Intensive Care and Emergency Medicine.27
Data Collection
The data were collected retrospectively from the electronic medical record archives of Shangluo Central Hospital, and included demographic features (gender, age), body mass index (BMI), etiology (biliary, alcoholic, dietary, hyperlipemia, and others), past history (hypertension, diabetes), hospitalization days (HD) and hospitalization expenses (HE). The laboratory indices, including white blood cells (WBC), neutrophils (Neut), red blood cells (RBC), D-dimers, total bilirubin (TBil), hemoglobin (Hb), fibrinogen (Fib), platelet distribution width (PDW), alanine aminotransferase (ALT), aspartate transaminase (AST), platelet (PLT), blood glucose (BG), serum calcium (Ca2+), serum amylase (AMY), serum lipase (LIP), serum creatinine (sCr), blood urea nitrogen (BUN), prothrombin time (PT), international standardized ratio (INR), platelet (PLT), erythrocyte volume distribution width (RDW), albumin (ALB), triglycerides (TG), high-density lipoprotein cholesterol (HDL), low-density lipoprotein cholesterol (LDL), total cholesterol (TC), C-reactive protein (CRP), procalcitonin (PCT), were recorded within 24 hours of admission and the highest or lowest values were extracted for analysis. The APACHE II and BISAP scores were also recorded. Excluding HD, HE, APACHEII and BISAP scoring systems, there were a total of 33 predictors.
Statistical Analysis
Continuous variables conforming to normal distribution are described using mean and standard deviation, and Student’s t-test was used for intergroup comparisons. The variables with skewed distribution are presented as median and interquartile range, and compared using the Mann–Whitney U-test. Categorical variables are decreased as ratios and compared using Chi-square test or Fisher’s exact test. The risk factors were screened through univariate logistic regression analysis, and the independent predictors of SAP were filtered using the least absolute shrinkage and selection operator (LASSO) regression model and analyzed in a step-by-step backward manner. The diagnostic prediction model of SAP was established by multivariate logistic regression analysis, and the nomogram was constructed using R software. The receiver operating characteristic (ROC) curves for the nomogram, APACHEII and BISAP scoring systems were plotted, and the optimal cut-off values, sensitivity, specificity, positive predictive value (PPV), negative predictive value (NPV), positive likelihood ratio (PLR) and negative likelihood ratio (NLR) were calculated. P<0.05 was considered statistically significant. The accuracy of the models was validated using calibration curves and Hosmer–Lemeshow tests. The clinical utility of the model was evaluated by plotting DCA and CIC, and internal validation was performed by 1000 times repeated sampling using the Bootstrap method. The SPSS 26.0 software (SPSS Inc., Chicago, IL, USA) and R 4.1.2 software (http://www.r-project.org/) were used for all statistical analyses.
Results
Demographic and Clinical Characteristics
A total of 436 patients were included in this study, of which 45 had SAP, corresponding to a prevalence rate of 10.3%. The mean age of the cohort was 50.2 ± 17 years, the male-to-female ratio was 1.58:1 (267/169), and the mean BMI was 25.3 ± 3.4 kg/m2. Comorbidities included hypertension (89 cases) and diabetes mellitus (73 cases). Ninety-four cases of AP involved the biliary tract, alcoholism, diet and hyperlipidemia were responsible for 37, 94 and 44 cases respectively, and 167 cases had other etiologies. The average HD was 10.8 days and average HE was 17228 RMB. There was no significant difference between the SAP and non-SAP groups in terms of sex (P=0.25), diabetes (P=0.14), etiology (P=0.074) and composition (P<0.05). In the non-SAP group, the HD was 9 days (IQR: 6–12), HE was 9119 RMB (IQR: 6383–13800), BMI was 25.2±3.4 kg/m2 and prevalence of hypertension was 18.9% (n=74). Patients with SAP were hospitalized for a longer duration, with average HD of 19 days (IQR: 12–23.5), which corresponded to greater HE of 40759 RMB (IQR: 22781–64788). The average BMI in this group was also higher at 26.6±3.2 kg/m2, although the prevalence of hypertension was lower at 33.3% (n=15). The above differences were all statistically significant (P<0.05). The data are summarized in Table 1.
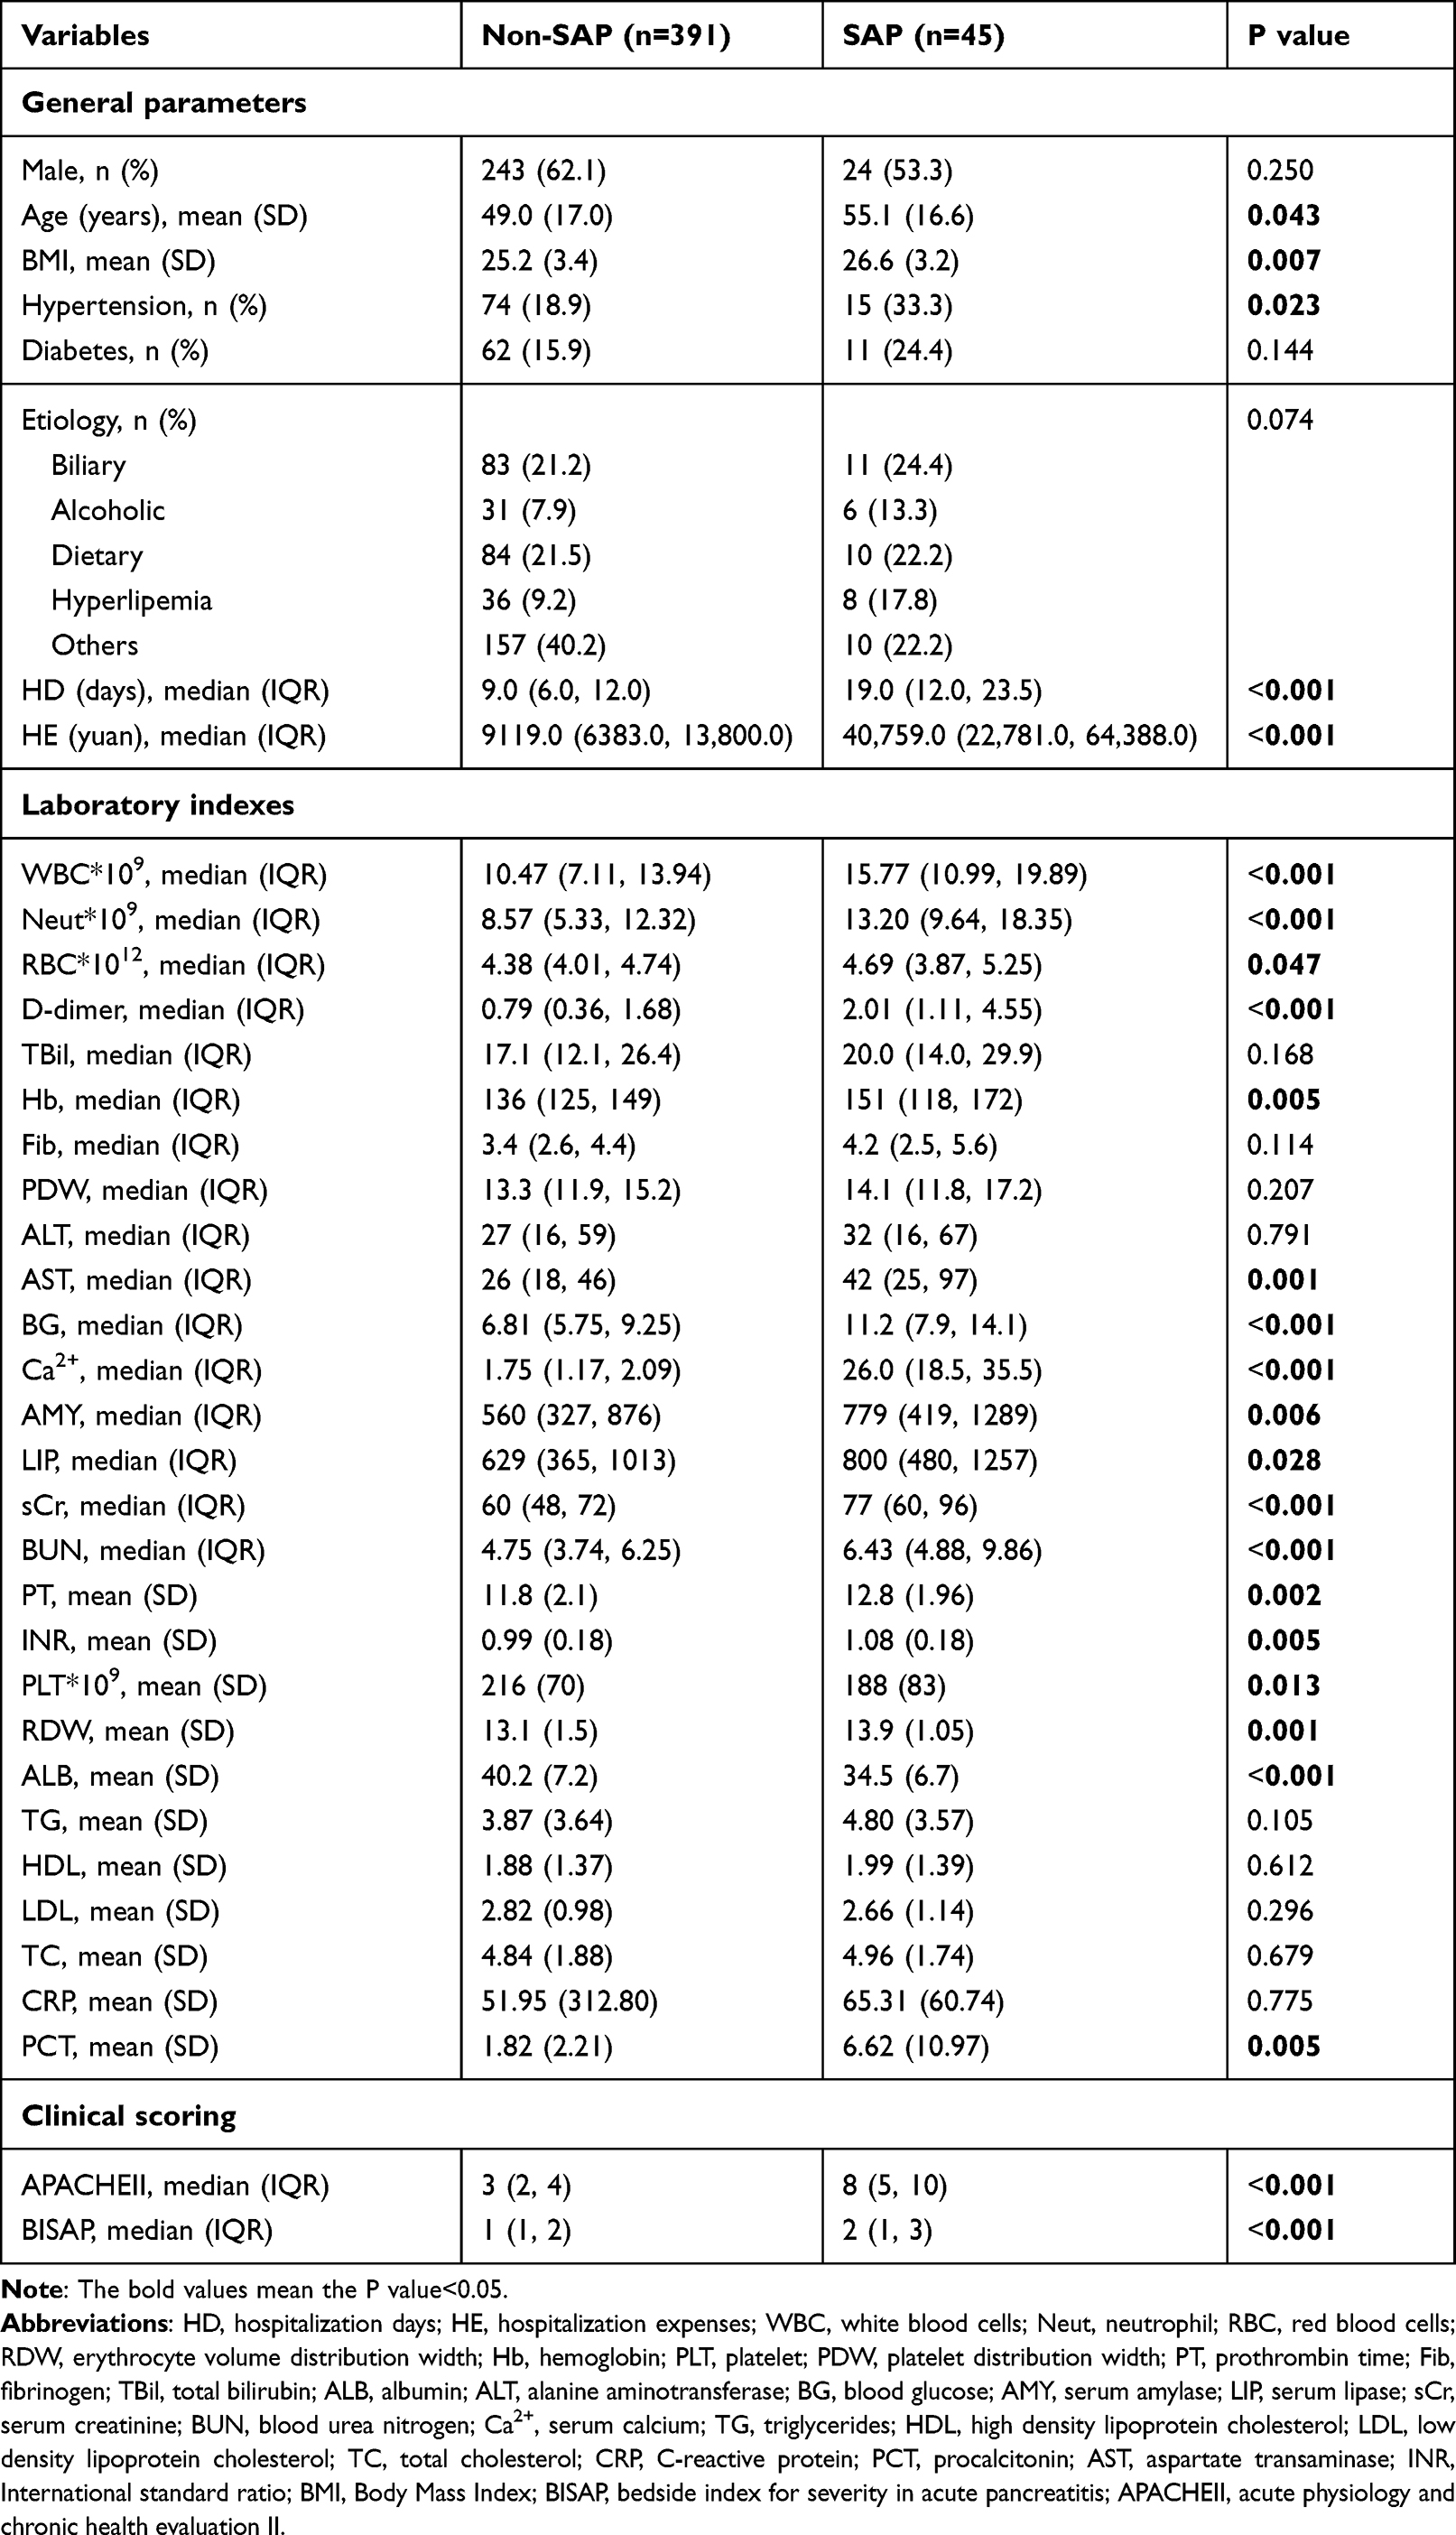 |
Table 1 Demographic and Clinical Characteristics of Patients with AP |
Correlation Between SAP and Clinical Parameters
After excluding parameters that were obtained following hospitalization for more than 24 hours, and the HD, HE, and APACHE II and BISAP scores, age (P=0.034), BMI (P = 0.007), hypertension (P = 0.023), WBC (P < 0.001), neutrophils (P < 0.001), RBC (P = 0.047), D-dimer (P < 0.001), Hb (P = 0.005), AST (P = 0.001), BG (P < 0.001), Ca2+ (P < 0.001), AMY (P = 0.006), LIP (P = 0.028), sCr (P < 0.001), BUN (P < 0.001), PT (P = 0.002), INR (P = 0.005), PLT (P = 0.013), RDW (P = 0.001), ALB (P < 0.001) and PCT (P = 0.005) were found to show significant positive correlation with SAP.
Construction of a Predictive Nomogram for SAP
The variables identified above were further screened by LASSO binary logistic regression based on 1 standard error criteria of lambda (Figure 1A and B). A total of seven independent risk factors associated with SAP were obtained, including neutrophils, ALB, BG, Ca, sCr, BUN and PCT. Indeed, the SAP patients had significantly higher neutrophil counts (Figure 2A), along with higher levels of BG (Figure 2B), ALB (Figure 2C), Ca2+ (Figure 2D), sCr (Figure 2E), BUN (Figure 2F) and PCT (Figure 2G) within 24 hours of admission for AP compared to patients that did not progress to SAP. Therefore, these variables can be used to predict progression to SAP within 24 hours of admission. Multivariate logistic regression analysis was then performed on these seven variables, and a multi-factor risk model was constructed according to the stepwise backward method (Table 2). Neutrophils, ALB, BG (Figure 1B), Ca2+, sCr, BUN and PCT were integrated to build a novel predictive nomogram (Figure 3). The C-index of the formulated nomogram was 0.889 (95% CI, 0.837–0.941), which was significantly higher than that of each indicator alone [neutrophils: 0.730 (95% CI, 0.647–0.814); ALB: 0.747 (95% CI, 0.667–0.826); BG: 0.741 (95% CI, 0.664–0.818); Ca2+: 0.728 (95% CI, 0.643 −0.813); sCr: 0.711 (95% CI, 0.626–0.797); BUN: 0.705 (95% CI, 0.616–0.795); PCT: 0.743 (95% CI, 0.664–0.822)].
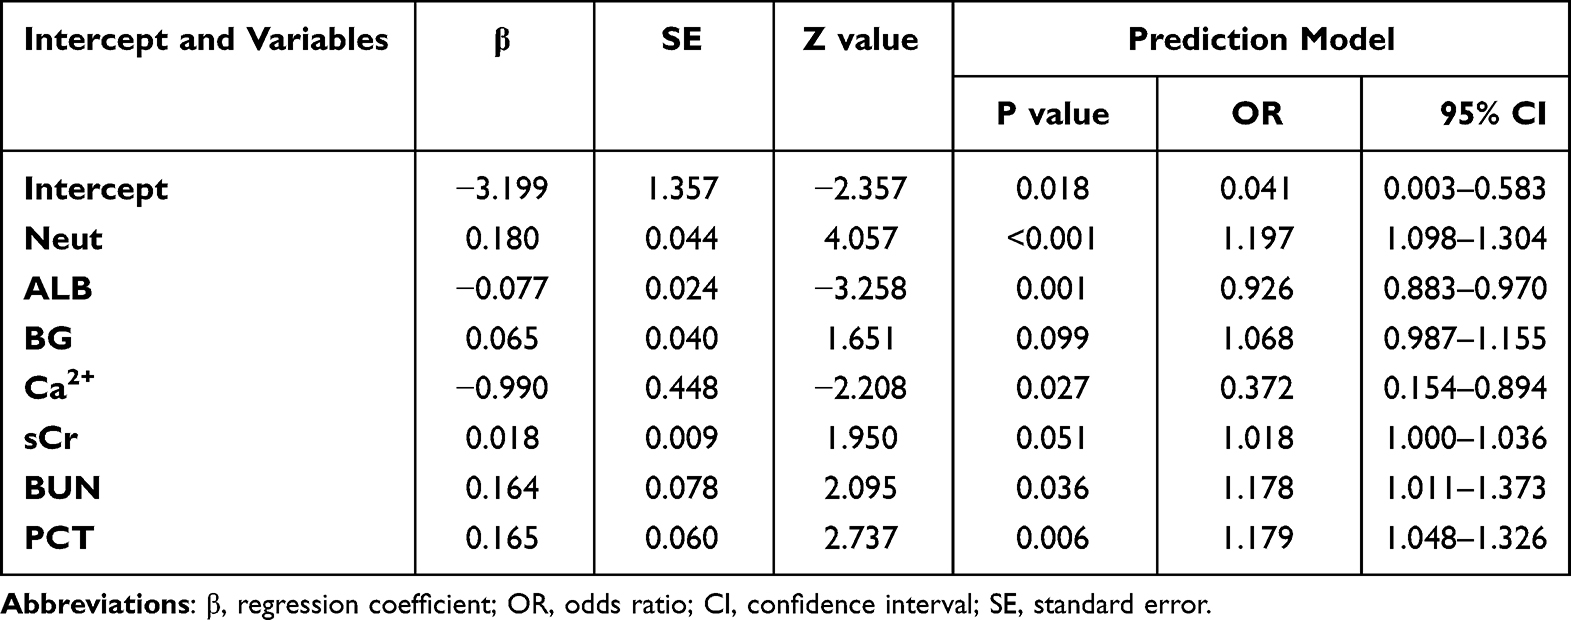 |
Table 2 Multivariate Logistic Regression Analysis of the Predictors of SAP |
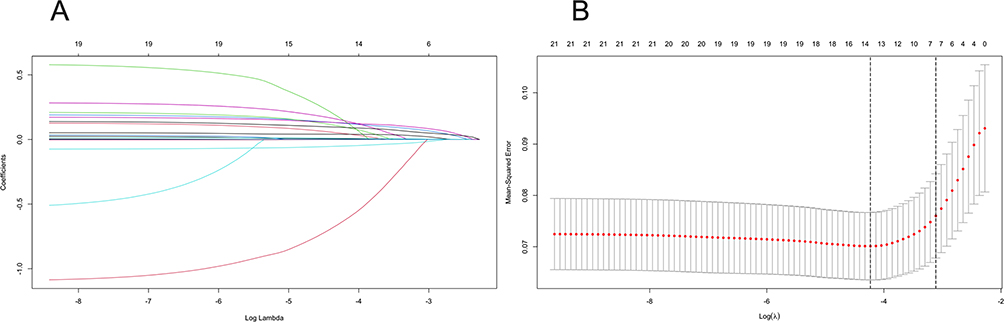 |
Figure 1 Identification of the risk factors of SAP by LASSO regression. (A) Least absolute shrinkage and selection operator coefficient profiles of the 21 candidate variables. For the optimal lambda, 7 variables with a non-0 coefficient were selected. (B) Following verification of the optimal parameter (lambda) in the least absolute shrinkage and selection operator model, dashed vertical line was plotted according to 1 standard error criterion Likelihood deviance (binomial) curve and log (lambda). |
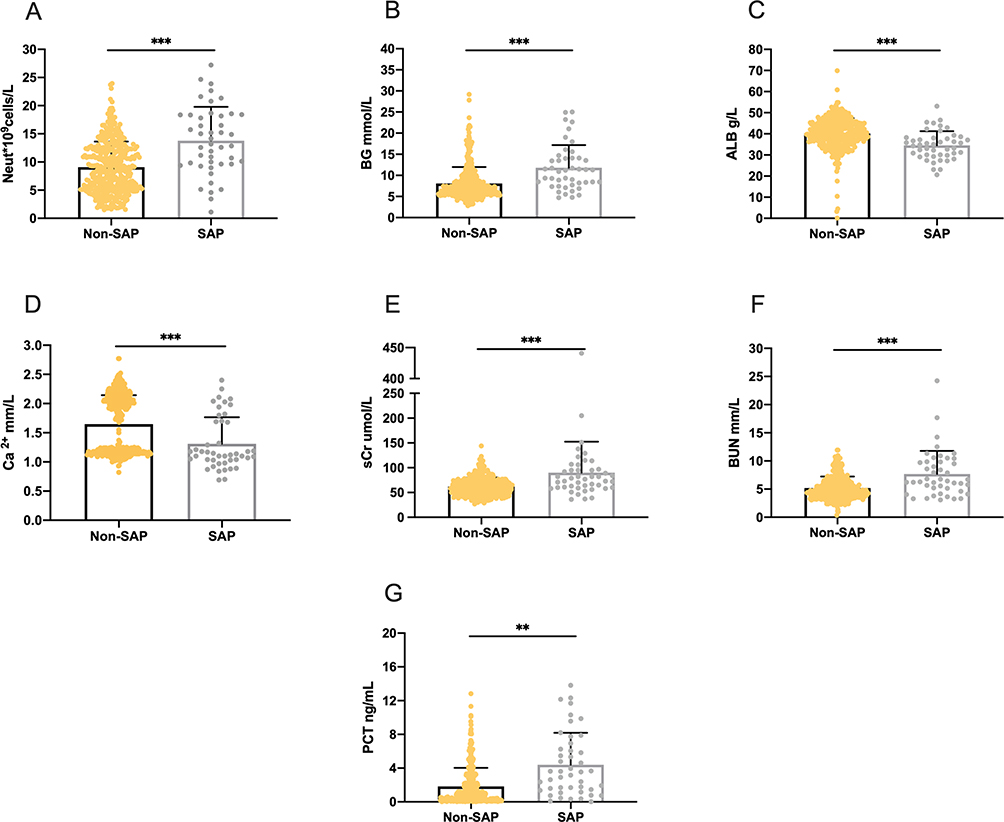 |
Figure 2 Quantification of (A) neutrophils, (B) BG, (C) ALB, (D) Ca2+, (E) sCr, (F) BUN and (G) PCT distinguishing patients with SAP from those without SAP. The error bars represent median ± standard deviation. Neut, neutrophil; ALB, albumin; Ca2+, serum calcium; BG, blood glucose; sCr, serum creatinine; BUN, blood urea nitrogen; PCT, procalcitonin; SAP, severe acute pancreatitis. **P < 0.01; ***P < 0.001. |
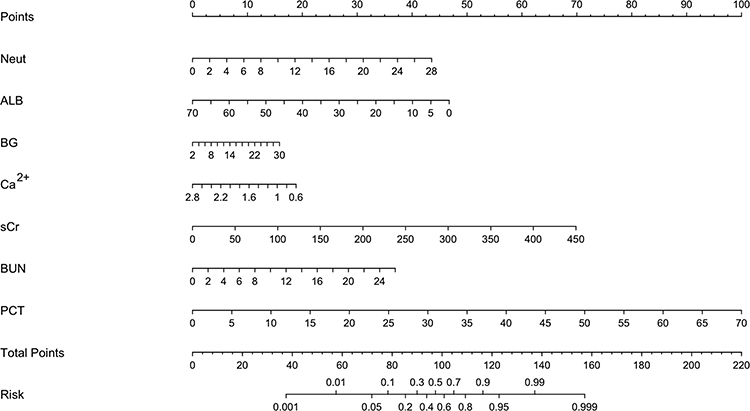 |
Figure 3 Predictive nomogram for the probability of SAP. |
We compared the predictive performance of the nomogram with that of APACHEII and BISAP by plotting ROC curves. As shown in Figure 4A, the nomogram had the highest area under the curve (AUC) of 0.889 (95% CI, 0.837–0.941), followed by APACHEII (0.853; 95% CI, 0.794–0.911) and BISAP (0.752; 95% CI, 0.767–0.828). Furthermore, the nomogram had the best predictive performance with sensitivity 0.733, specificity 0.9, PPV 0.458, NPV 0.967, PLR 7.352 and NLR 0.296 (Table 3). The parameters of the ROC curves at the nomogram cut-off point are shown in Table 2. The bootstrap method of self-sampling 1000 times was used for internal verification, and calibration curves showed good consistency between the actual and nomogram-predicted SAP (Figure 4B–D).
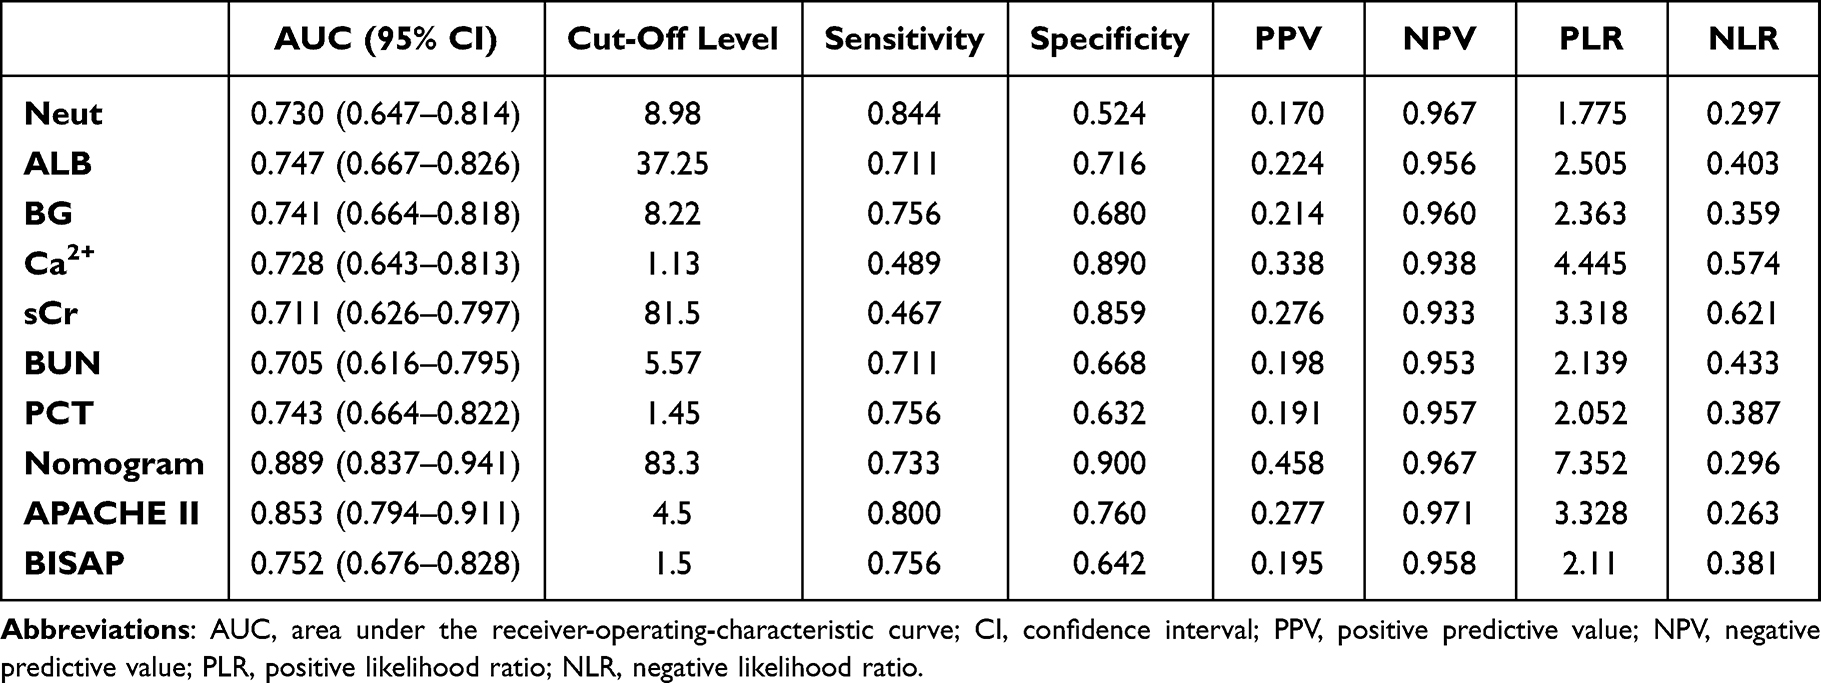 |
Table 3 Discriminatory Performance of Neutrophils, ALB, BG, Ca2+, sCr, BUN, PCT, APACHE II, BISAP and the Formulated Nomogram for Identifying Patients with SAP |
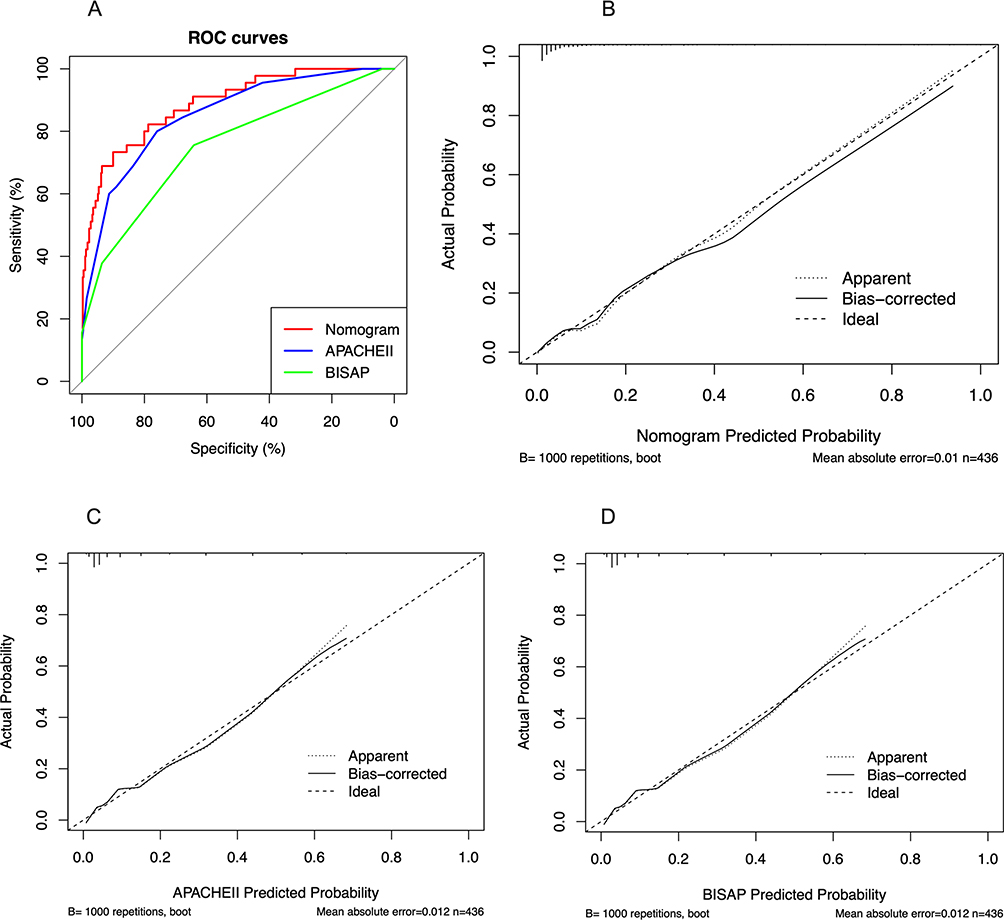 |
Figure 4 The (A) ROC and (B) calibration curves of the nomogram. The calibration curves of (C) APACHEII and (D) BISAP. |
DCA curves were plotted to further verify the predictive accuracy of the nomogram. As shown in Figure 5A, the nomogram model had greater net benefits and a wider range of high-risk thresholds compared to the other two scoring systems. The CIC was also plotted for the nomogram and the seven predictors, which indicated superior net benefits of the combined nomogram compared to each individual indicator, along with a wider range of high-risk thresholds (Figure 5B–I). In conclusion, the nomogram model based on routine clinical parameters can accurately predict SAP early during onset.
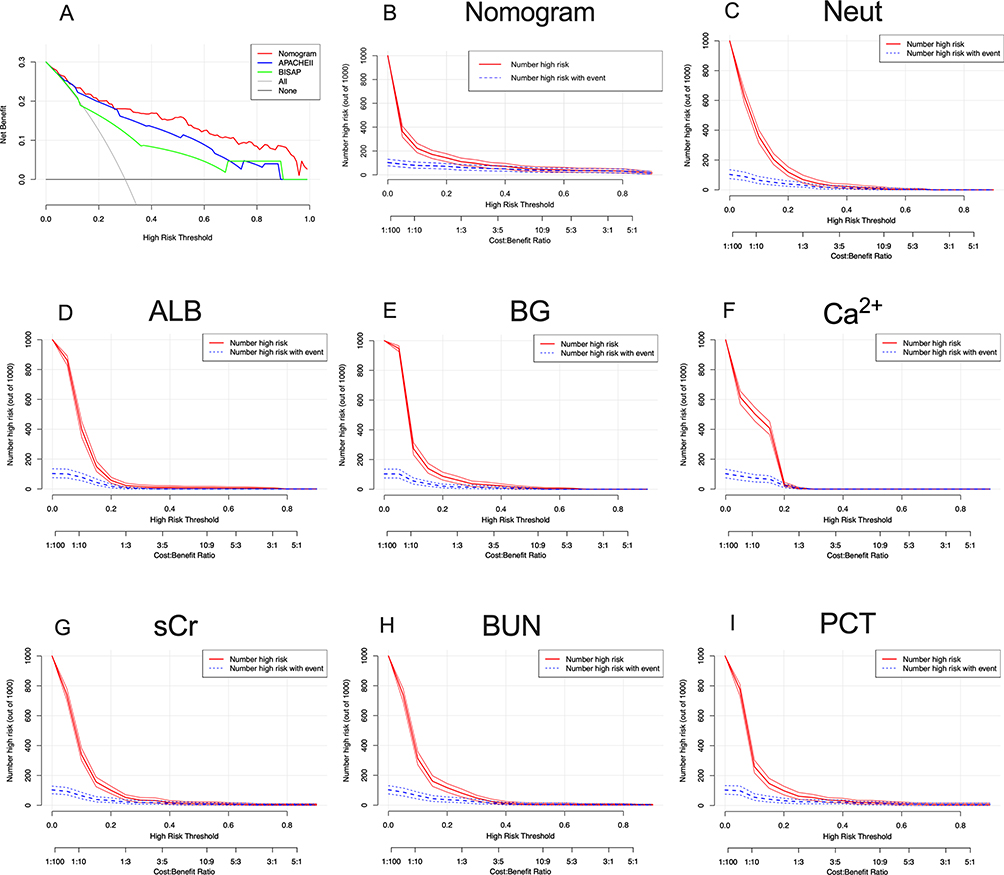 |
Figure 5 The (A) decision curve analysis and (B–I) clinical impact curves of the nomogram and risk factors. |
Discussion
SAP is characterized by acute onset, rapid progression, and severe complications. It not only prolongs the hospital stay and increases the financial burden on patients, but can also be fatal due to the complications. Therefore, it is crucial to identify SAP in its early stages in order to start the treatment a timely manner and prevent complications. Early identification of SAP patients can help with risk stratification and management to promote rapid recovery, thereby shortening hospital stay and reducing hospital costs. The APACHE II and BISAP scoring systems are commonly used to assess disease severity. However, the APACHE II score is designed for critically ill patients in intensive care units, and is based on multiple laboratory indicators, some of which cannot be measured within 24 hours of admission. Therefore, it is complicated and cumbersome to use, and has a high false positive rate. In this study, we screened 7 predictors of SAP, including neutrophils, ALB, BG, Ca2+, sCr, BUN and PCT, was established and verified, which had good predictive value.
The neutrophil count showed the strongest discriminatory power for SAP at the cut-off value of 8.98, and predicted SAP with 84.4% sensitivity and 52.4% specificity. Elevated neutrophil count was significantly associated with longer hospital stays and more complications, and was identified as an independent predictor of SAP severity. However, exercise, emotional stimulation, childbirth, smoking, chronic inflammation, such as ulcerative colitis, gout, etc., and other factors can also increase the neutrophil count. Therefore, elevated neutrophil count by itself has low predictive specificity for SAP and a high false positive rate. Furthermore, we and others11,17,30 have found that the increase in neutrophils is not only an early predictor of SAP, but also an indicator of organ failure. Some studies13,31,32 have shown that the neutrophil to lymphocyte ratio (NLR) is a reliable parameter of the systemic inflammatory response, and is routinely tested in critically ill patients with systemic multi-organ failure. However, the ability of NLR and the neutrophil count to predict SAP within 24 hours of onset needs to be validated through multicenter studies.
AP is often accompanied by gastrointestinal symptoms, and inadequate fluid intake and loss results in hypovolemia. In addition, increased protein breakdown and the persistent negative nitrogen balance during AP can also lead to hypoproteinemia.33–35 In this study, ALB predicted the severity of AP with an AUC of 0.747, PLR of 2.505 and NLR of 0.403. Patients in the early stage of AP with ALB < 37.25 g/L may progress to SAP. The incidence of organ failure and pancreatic necrosis in AP patients complicated by hypoproteinemia is significantly higher than that of patients without hypoproteinemia,23,35–37 which is consistent with our findings. In summary, ALB is correlates negatively with the severity of AP,14,38 and can be used to predict the same.
Pancreatitis affects the endocrine and exocrine functions of the organ, which on turn influences eating behavior and metabolism.39,40 Inadequate insulin secretion and collective hypermetabolism lead to a rapid increase41–43 in BG levels, especially in patients with necrotizing pancreatitis,44–46 which may even progress to pancreatic diabetes.25 Therefore, BG can also be used as a marker for the severity of pancreatitis,47 and was identified as such in our study as well. However, BG can be elevated by other pathological factors, which lowers its predictive performance for SAP. Consistent with this, BG was integrated into the nomogram along with other predictive factors to improve the predictive ability.
Studies show that Ca2+ level is a determinant of the exocrine functions of the pancreas, as well as the pathological progression of AP.33,48 In the past decade, various strategies have been developed to simultaneously monitor the changes in Ca2+ levels in the acinar environment.33,49 Furthermore, SAP is often associated with lower serum calcium levels,30 and hypocalcemia can in fact predict SAP15,50 across all age groups.48,51,52 In our study as well, Ca2+ was identified as an independent predictor of SAP at the cut-off level of 1.13 and with specificity of 0.89. Thus, low calcium levels in the blood can predict the severity of AP with high accuracy.
There are reports2,8,53 indicating that sCr is a prognostic marker for SAP and can be used to determine the risk of SAP-induced multi-organ failure.18 We found that sCr levels in the first 24 hours of admission predicted SAP fairly accurately with an AUC of 0.711 (95% CI, 0.626–0.797), which is higher than that reported by other studies.26,29 Although previous studies have shown that sCr is associated with the death outcomes of SAP,10 it was not identified an independent risk factor in our study.
Patients with AP often experience hypovolemia and hemoconcentration on admission are caused by rapid changes of vascular permeability and other factors, and prerenal azotemia that increases BUN levels. Studies54,55 show that high levels of BUN on admission portend an increased risk of death from AP. Brigham et al56 found that BUN level can predict persistent circulatory failure in the early stage of AP, as well as organ failure and pancreatic necrosis in SAP. An increase in BUN within 24 hours of admission predicts SAP with greater accuracy compared to high sCr levels.57 We also found a positive correlation between high levels of BUN at 24 hours of admission and the occurrence of SAP, and also identified it is an independent predictor for SAP.
Serum procalcitonin levels usually peak around 24 hours of the onset of infection, and is also a useful predictive marker for SAP.16,58,59 We found that procalcitonin level within 24 hours of admission predicted SAP with sensitivity and specificity of 0.756 and 0.632, respectively, which is consistent with an earlier study.60 Co-existence of bacterial infection can exacerbate AP, especially if biliary pancreatitis is complicated by cholangitis or liver abscess. Since bacterial cultures do not yield rapid results and the positive rate is low, changes in procalcitonin levels can be used as a surrogate marker of bacterial infection and early inflammation,55,61 and can predict peripancreatic infection or inflammation caused by pancreatic tissue necrosis.
We constructed a nomogram for predicting the severity of AP by integrating multiple clinical indicators. The nomogram showed greater predictive accuracy compared to the APACHEII and BISAP scoring systems, and there was good agreement between the predicted and observed values. Furthermore, DCA of the nomogram model indicated a broader range of high-risk thresholds than APACHEII and BISAP. When the threshold probability is greater than 30%, the corresponding treatment measures can benefit AP patients overall, thus improving clinical decision-making. Other studies have shown19–21 that CT images can diagnose and grade the severity of SAP. However, the abdominal CT features in AP patients usually appear 48 hours after onset, and have little predictive value in the first 24 hours. Moreover, abdominal CT is inconvenient and expensive, and largely ineffective for early decision-making.
However, our study still has certain limitations. First, the sample size of this study was small, and some patients with SAP were not transferred to Shangluo Central Hospital within 24 hours of onset and therefore lacked the data for that time window. This might have introduced some selection bias. Second, the existence of many scoring systems62 itself indicated that they are all imperfect, and our research is no exception. This was a single-center retrospective study that was only validated internally and lacked external validation. Therefore, our findings will have to be validated through studies on large, multi-center cohorts, or related meta-analyses. Finally, some studies62–64 have shown that the 48-hour component is an inherent advantage that is supported by the Revised Atlanta Classification. But the pathophysiology of AP is an evolving disease that needs to be reassessed at any time. We only established a nomogram for predicting SAP, and it remains to be ascertained whether early clinical treatment can reduce the complications or severity of SAP.
In summary, we established a nomogram model integrating the clinical and laboratory parameters measured within 24 hours of the onset of AP to accurately predict the probability of SAP. This is a promising tool that can help clinicians develop individualized treatment plans for AP patients, thereby improving patient outcomes, saving medical resources and costs, and promoting early recovery.
Data Sharing Statement
The data that support the findings of this study are available on request from the corresponding author.
Ethics Approval and Consent to Participate
According to the principles of the Helsinki Declaration, the protocol of this study was approved by the Ethics Committee of Shangluo Central Hospital (KY2023007) in March 2023. All enrolled patients were informed about the study procedures and signed an informed consent form.
Author Contributions
All authors made a significant contribution to the work reported, whether that is in the conception, study design, execution, acquisition of data, analysis and interpretation, or in all these areas; took part in drafting, revising or critically reviewing the article; gave final approval of the version to be published; have agreed on the journal to which the article has been submitted; and agree to be accountable for all aspects of the work.
Funding
There is no funding to report.
Disclosure
The authors declare that they have no competing interests.
References
1. Boxhoorn L, Voermans RP, Bouwense SA, et al. Acute pancreatitis. Lancet. 2020;396:726–734. doi:10.1016/s0140-6736(20)31310-6
2. Schepers NJ, Bakker OJ, Besselink MG, et al. Impact of characteristics of organ failure and infected necrosis on mortality in necrotising pancreatitis. Gut. 2019;68:1044–1051. doi:10.1136/gutjnl-2017-314657
3. Gurusamy KS, Belgaumkar AP, Haswell A, et al. Interventions for necrotising pancreatitis. Cochrane Database Syst Rev. 2016;4:CD011383. doi:10.1002/14651858.CD011383.pub2
4. van Brunschot S, Hollemans RA, Bakker OJ, et al. Minimally invasive and endoscopic versus open necrosectomy for necrotising pancreatitis: a pooled analysis of individual data for 1980 patients. Gut. 2018;67:697–706. doi:10.1136/gutjnl-2016-313341
5. Bang JY, Wilcox CM, Arnoletti JP, et al. Superiority of endoscopic interventions over minimally invasive surgery for infected necrotizing pancreatitis: meta-analysis of randomized trials. Dig Endosc. 2020;32:298–308. doi:10.1111/den.13470
6. Bakker OJ, Issa Y, van Santvoort HC, et al. Treatment options for acute pancreatitis. Nat Rev Gastroenterol Hepatol. 2014;11:462–469. doi:10.1038/nrgastro.2014.39
7. Banks PA, Bollen TL, Dervenis C, et al. Classification of acute pancreatitis--2012: revision of the Atlanta classification and definitions by international consensus. Gut. 2013;62:102–111. doi:10.1136/gutjnl-2012-302779
8. van Dijk SM, Hallensleben NDL, van Santvoort HC, et al. Acute pancreatitis: recent advances through randomised trials. Gut. 2017;66:2024–2032. doi:10.1136/gutjnl-2016-313595
9. Valverde-Lopez F, Matas-Cobos AM, Alegria-Motte C, et al. BISAP, RANSON, lactate and others biomarkers in prediction of severe acute pancreatitis in a European cohort. J Gastroenterol Hepatol. 2017;32:1649–1656. doi:10.1111/jgh.13763
10. Leppaniemi A, Tolonen M, Tarasconi A, et al. 2019 WSES guidelines for the management of severe acute pancreatitis. World J Emerg Surg. 2019;14:27. doi:10.1186/s13017-019-0247-0
11. Dancu GM, Popescu A, Sirli R, et al. The BISAP score, NLR, CRP, or BUN: which marker best predicts the outcome of acute pancreatitis? Medicine. 2021;100:e28121. doi:10.1097/MD.0000000000028121
12. van Santvoort HC, Bakker OJ, Bollen TL, et al. A conservative and minimally invasive approach to necrotizing pancreatitis improves outcome. Gastroenterology. 2011;141:1254–1263. doi:10.1053/j.gastro.2011.06.073
13. Lee SH, Lee TY, Jeong JH, et al. Clinical significance of the neutrophil-lymphocyte ratio as an early predictive marker for adverse outcomes in patients with acute cholangitis. Medicina. 2022;59:58. doi:10.3390/medicina58020255
14. Karabuga B, Gemcioglu E, Konca Karabuga E, et al. Comparison of the predictive values of CRP, CRP/albumin, RDW, neutrophil/lymphocyte, and platelet/lymphocyte levels in determining the severity of acute pancreatitis in patients with acute pancreatitis according to the BISAP score. Bratisl Lek Listy. 2022;123:129–135. doi:10.4149/BLL_2022_020
15. Tian F, Li H, Wang L, et al. The diagnostic value of serum C-reactive protein, procalcitonin, interleukin-6 and lactate dehydrogenase in patients with severe acute pancreatitis. Clin Chim Acta. 2020;510:665–670. doi:10.1016/j.cca.2020.08.029
16. Yang DJ, Lu HM, Liu Y, et al. Development and validation of a prediction model for moderately severe and severe acute pancreatitis in pregnancy. World J Gastroenterol. 2022;28:1588–1600. doi:10.3748/wjg.v28.i15.1588
17. Kong W, He Y, Bao H, et al. Diagnostic value of neutrophil-lymphocyte ratio for predicting the severity of acute pancreatitis: a meta-analysis. Dis Markers. 2020;2020:9731854. doi:10.1155/2020/9731854
18. Li Y, Zhao Y, Feng L, et al. Comparison of the prognostic values of inflammation markers in patients with acute pancreatitis: a retrospective cohort study. BMJ Open. 2017;7:e013206. doi:10.1136/bmjopen-2016-013206
19. Ha J, Choi SH, Byun JH, et al. Meta-analysis of CT and MRI for differentiation of autoimmune pancreatitis from pancreatic adenocarcinoma. Eur Radiol. 2021;31:3427–3438. doi:10.1007/s00330-020-07416-1
20. Liu N, He J, Hu X, et al. Acute necrotising pancreatitis: measurements of necrosis volume and mean CT attenuation help early prediction of organ failure and need for intervention. Eur Radiol. 2021;31:7705–7714. doi:10.1007/s00330-021-07840-x
21. Zver T, Calame P, Koch S, et al. Early prediction of acute biliary pancreatitis using clinical and abdominal CT features. Radiology. 2022;302:118–126. doi:10.1148/radiol.2021210607
22. van Grinsven J, van Brunschot S, van Santvoort HC, et al. The value of a 24/7 online nationwide multidisciplinary expert panel for acute necrotizing pancreatitis. Gastroenterology. 2017;152:685–688 e6. doi:10.1053/j.gastro.2017.01.040
23. Buxbaum JL, Quezada M, Da B, et al. Early aggressive hydration hastens clinical improvement in mild acute pancreatitis. Am J Gastroenterol. 2017;112:797–803. doi:10.1038/ajg.2017.40
24. Dellinger EP, Forsmark CE, Layer P, et al. Determinant-based classification of acute pancreatitis severity. Ann Surg. 2012;256:875–880. doi:10.1097/SLA.0b013e318256f778
25. Schmidt PN, Roug S, Hansen EF, et al. Spectrum of microorganisms in infected walled-off pancreatic necrosis - impact on organ failure and mortality. Pancreatology. 2014;14:444–449. doi:10.1016/j.pan.2014.09.001
26. Wang M, Wei A, Guo Q, et al. Clinical outcomes of combined necrotizing pancreatitis versus extrapancreatic necrosis alone. Pancreatology. 2016;16:57–65. doi:10.1016/j.pan.2015.10.010
27. MacTavish P, McPeake J, Devine H. Classification of pain and its treatment at an intensive care rehabilitation clinic. Crit Care. 2016;20:94. doi:10.1186/s13054-016-1208-6
28. Koutroumpakis E, Wu BU, Bakker OJ, et al. Admission hematocrit and rise in blood urea nitrogen at 24 h outperform other laboratory markers in predicting persistent organ failure and pancreatic necrosis in acute pancreatitis: a post hoc analysis of three large prospective databases. Am J Gastroenterol. 2015;110:1707–1716. doi:10.1038/ajg.2015.370
29. Zubia-Olaskoaga F, Maravi-Poma E, Urreta-Barallobre I, et al. Comparison between revised Atlanta classification and determinant-based classification for acute pancreatitis in intensive care medicine. Why do not use a modified determinant-based classification? Crit Care Med. 2016;44:910–917. doi:10.1097/CCM.0000000000001565
30. Ceranic DB, Zorman M, Skok P. Interleukins and inflammatory markers are useful in predicting the severity of acute pancreatitis. Bosn J Basic Med Sci. 2020;20:99–105. doi:10.17305/bjbms.2019.4253
31. Pian G, Li H, Piao Y. Clinical significance of inflammation markers in predicting the severity of acute pancreatitis. Pancreas. 2021;50:201–205. doi:10.1097/MPA.0000000000001749
32. Wang Y, Fuentes HE, Attar BM, et al. Evaluation of the prognostic value of neutrophil to lymphocyte ratio in patients with hypertriglyceridemia-induced acute pancreatitis. Pancreatology. 2017;17:893–897. doi:10.1016/j.pan.2017.10.001
33. Petersen OH, Gerasimenko JV, Gerasimenko OV, et al. The roles of calcium and ATP in the physiology and pathology of the exocrine pancreas. Physiol Rev. 2021;101:1691–1744. doi:10.1152/physrev.00003.2021
34. Salerno F, Navickis RJ, Wilkes MM. Albumin infusion improves outcomes of patients with spontaneous bacterial peritonitis: a meta-analysis of randomized trials. Clin Gastroenterol Hepatol. 2013;11:123–30 e1. doi:10.1016/j.cgh.2012.11.007
35. Fei Y, Gao K, Tu J, et al. Predicting and evaluation the severity in acute pancreatitis using a new modeling built on body mass index and intra-abdominal pressure. Am J Surg. 2018;216:304–309. doi:10.1016/j.amjsurg.2017.04.017
36. Salerno F, Navickis RJ, Wilkes MM, Bramer WM, van der Woude CJ. Albumin treatment regimen for type 1 hepatorenal syndrome: a dose–response meta-analysis. BMC Gastroenterol. 2015;15:15. doi:10.1186/s12876-015-0389-9
37. Kaplan M, Ates I, Akpinar MY, et al. Predictive value of C-reactive protein/albumin ratio in acute pancreatitis. Hepatobiliary Pancreat Dis Int. 2017;16:424–430. doi:10.1016/s1499-3872(17)60007-9
38. Yue W, Liu Y, Ding W, et al. The predictive value of the prealbumin-to-fibrinogen ratio in patients with acute pancreatitis. Int J Clin Pract. 2015;69:1121–1128. doi:10.1111/ijcp.12682
39. Kerem M, Bedirli A, Pasaoglu H, et al. Role of ghrelin and leptin in predicting the severity of acute pancreatitis. Dig Dis Sci. 2007;52:950–955. doi:10.1007/s10620-006-9150-0
40. Wei D, Yin C, Lu S, et al. The effect of insulin pump combined with ulinastatin on the levels of PCT, TG, PTX-3, and CX3CL1 in patients with diabetic ketoacidosis and pancreatitis. Medicine. 2021;100:e25141. doi:10.1097/MD.0000000000025141
41. He F, Zhu HM, Li BY, et al. Factors predicting the severity of acute pancreatitis in elderly patients. Aging Clin Exp Res. 2021;33:183–192. doi:10.1007/s40520-020-01523-1
42. He Q, Ding J, He S, et al. The predictive value of procalcitonin combined with C-reactive protein and D dimer in moderately severe and severe acute pancreatitis. Eur J Gastroenterol Hepatol. 2022;34:744–750. doi:10.1097/MEG.0000000000002376
43. He SS, Li D, He QY, et al. Establishment of early multi-indicator prediction models of moderately severe acute pancreatitis and severe acute pancreatitis. Gastroenterol Res Pract. 2022;2022:5142473. doi:10.1155/2022/5142473
44. Hong W, Lillemoe KD, Pan S, et al. Development and validation of a risk prediction score for severe acute pancreatitis. J Transl Med. 2019;17:146. doi:10.1186/s12967-019-1903-6
45. Hong W, Lu Y, Zhou X, et al. Usefulness of random forest algorithm in predicting severe acute pancreatitis. Front Cell Infect Microbiol. 2022;12:893294. doi:10.3389/fcimb.2022.893294
46. Jin Z, Xu L, Wang X, et al. Risk factors for worsening of acute pancreatitis in patients admitted with mild acute pancreatitis. Med Sci Monit. 2017;23:1026–1032. doi:10.12659/msm.900383
47. Karpavicius A, Dambrauskas Z, Gradauskas A, et al. The clinical value of adipokines in predicting the severity and outcome of acute pancreatitis. BMC Gastroenterol. 2016;16:99. doi:10.1186/s12876-016-0514-4
48. Frick TW. The role of calcium in acute pancreatitis. Surgery. 2012;152:S157–63. doi:10.1016/j.surg.2012.05.013
49. Pandol SJ, Gottlieb RA. Calcium, mitochondria and the initiation of acute pancreatitis. Pancreatology. 2022;22:838–845. doi:10.1016/j.pan.2022.07.011
50. Sutton R, Criddle D, Raraty MG, et al. Signal transduction, calcium and acute pancreatitis. Pancreatology. 2003;3:497–505. doi:10.1159/000075581
51. Zhong Y, Yu Z, Wang L, et al. Combined detection of procalcitonin, heparin-binding protein, and interleukin-6 is a promising assay to diagnose and predict acute pancreatitis. J Clin Lab Anal. 2021;35:e23869. doi:10.1002/jcla.23869
52. Staubli SM, Oertli D, Nebiker CA. Laboratory markers predicting severity of acute pancreatitis. Crit Rev Clin Lab Sci. 2015;52:273–283. doi:10.3109/10408363.2015.1051659
53. Xiao AY, Tan ML, Wu LM, et al. Global incidence and mortality of pancreatic diseases: a systematic review, meta-analysis, and meta-regression of population-based cohort studies. Lancet Gastroenterol Hepatol. 2016;1:45–55. doi:10.1016/s2468-1253(16)30004-8
54. Pando E, Alberti P, Mata R, et al. Early Changes In Blood Urea Nitrogen (BUN) can predict mortality in acute pancreatitis: comparative study between BISAP Score, APACHE-II, and other laboratory markers-A prospective observational study. Can J Gastroenterol Hepatol. 2021;2021:6643595. doi:10.1155/2021/6643595
55. Silva-Vaz P, Abrantes AM, Morgado-Nunes S, et al. Evaluation of prognostic factors of severity in acute biliary pancreatitis. Int J Mol Sci. 2020;22:21. doi:10.3390/ijms21124300
56. Wu BU, Johannes RS, Sun X, et al. The early prediction of mortality in acute pancreatitis: a large population-based study. Gut. 2008;57:1698–1703. doi:10.1136/gut.2008.152702
57. Hong W, Dong L, Huang Q, et al. Prediction of severe acute pancreatitis using classification and regression tree analysis. Dig Dis Sci. 2011;56:3664–3671. doi:10.1007/s10620-011-1849-x
58. Silva-Vaz P, Abrantes AM, Castelo-Branco M, et al. Multifactorial scores and biomarkers of prognosis of acute pancreatitis: applications to research and practice. Int J Mol Sci. 2020;22:21. doi:10.3390/ijms21010338
59. Sternby H, Hartman H, Johansen D, et al. Predictive capacity of biomarkers for severe acute pancreatitis. Eur Surg Res. 2016;56:154–163. doi:10.1159/000444141
60. Ye JF, Zhao YX, Ju J, et al. Building and verifying a severity prediction model of acute pancreatitis (AP) based on BISAP, MEWS and routine test indexes. Clin Res Hepatol Gastroenterol. 2017;41:585–591. doi:10.1016/j.clinre.2016.11.013
61. Zhou Y, Han F, Shi XL, et al. Prediction of the severity of acute pancreatitis using machine learning models. Postgrad Med. 2022:1–8. doi:10.1080/00325481.2022.2099193
62. Kiat TTJ, Gunasekaran SK, Junnarkar SP, et al. Are traditional scoring systems for severity stratification of acute pancreatitis sufficient? Ann Hepatobiliary Pancreat Surg. 2018;22:105–115. doi:10.14701/ahbps.2018.22.2.105
63. Chan KS, Shelat VG. Diagnosis, severity stratification and management of adult acute pancreatitis-current evidence and controversies. World J Gastrointest Surg. 2022;14:1179–1197. doi:10.4240/wjgs.v14.i11.1179
64. Ong Y, Shelat VG. Ranson score to stratify severity in acute pancreatitis remains valid - old is gold. Expert Rev Gastroenterol Hepatol. 2021;15:865–877. doi:10.1080/17474124.2021.1924058
 © 2023 The Author(s). This work is published and licensed by Dove Medical Press Limited. The
full terms of this license are available at https://www.dovepress.com/terms
and incorporate the Creative Commons Attribution
- Non Commercial (unported, 3.0) License.
By accessing the work you hereby accept the Terms. Non-commercial uses of the work are permitted
without any further permission from Dove Medical Press Limited, provided the work is properly
attributed. For permission for commercial use of this work, please see paragraphs 4.2 and 5 of our Terms.
© 2023 The Author(s). This work is published and licensed by Dove Medical Press Limited. The
full terms of this license are available at https://www.dovepress.com/terms
and incorporate the Creative Commons Attribution
- Non Commercial (unported, 3.0) License.
By accessing the work you hereby accept the Terms. Non-commercial uses of the work are permitted
without any further permission from Dove Medical Press Limited, provided the work is properly
attributed. For permission for commercial use of this work, please see paragraphs 4.2 and 5 of our Terms.
Recommended articles
Predicting the Risk of Unplanned Readmission at 30 Days After PCI: Development and Validation of a New Predictive Nomogram
Xu W, Tu H, Xiong X, Peng Y, Cheng T
Clinical Interventions in Aging 2022, 17:1013-1023
Published Date: 5 July 2022
Development and Validation of a Nomogram for Predicting 28-Day Mortality on Admission in Elderly Patients with Severe Community-Acquired Pneumonia
Song Y, Wang X, Lang K, Wei T, Luo J, Song Y, Yang D
Journal of Inflammation Research 2022, 15:4149-4158
Published Date: 21 July 2022
Clinical Prediction Score for Early Diagnosis of Acute Pancreatitis in Emergency Departments
Liengswangwong W, Preechakul P, Yuksen C, Jenpanitpong C, Tienpratarn W, Watcharakitpaisan S
Open Access Emergency Medicine 2022, 14:355-366
Published Date: 26 July 2022
A Prediction Nomogram for Severe Obstructive Sleep Apnea in Snoring Patients: A Retrospective Study
Teng G, Zhang R, Zhou J, Wang Y, Zhang N
Nature and Science of Sleep 2023, 15:231-243
Published Date: 17 April 2023
Analysis of Risk Factors and Development of a Predictive Model for Delirium in ICU Patients: Construction, Validation, and Clinical Implications
Li X, Zhang W, Wang T, Qiu Z, Sun X, Qu W, Zhang G
International Journal of General Medicine 2025, 18:3727-3737
Published Date: 5 July 2025