Back to Journals » Diabetes, Metabolic Syndrome and Obesity » Volume 15
Establishment and Validation of a Nomogram Model for Prediction of Diabetic Nephropathy in Type 2 Diabetic Patients with Proteinuria
Authors Zhou DM, Wei J, Zhang TT, Shen FJ, Yang JK
Received 17 January 2022
Accepted for publication 23 March 2022
Published 8 April 2022 Volume 2022:15 Pages 1101—1110
DOI https://doi.org/10.2147/DMSO.S357357
Checked for plagiarism Yes
Review by Single anonymous peer review
Peer reviewer comments 2
Editor who approved publication: Professor Ming-Hui Zou
Dong-mei Zhou,1,2,* Jing Wei,2,* Ting-ting Zhang,2 Feng-jie Shen,2 Jin-Kui Yang1
1Department of Endocrinology, Beijing Tongren Hospital, Capital Medical University, Beijing, 100730, People’s Republic of China; 2Department of Endocrinology, The Affiliated Hospital of Xuzhou Medical University, Xuzhou, 221000, People’s Republic of China
*These authors contributed equally to this work
Correspondence: Jin-Kui Yang, Department of Endocrinology, Beijing Tongren Hospital, Capital Medical University, Beijing, 100730, People’s Republic of China, Email [email protected]
Purpose: To establish and validate the nomogram model for predicting diabetic nephropathy (DN) in type 2 diabetes mellitus (T2DM) patients with proteinuria.
Methods: A total of 102 patients with T2DM and proteinuria who underwent renal biopsy were included in this study. According to pathological classification of the kidney, the patients were divided into two groups, namely, a DN group (52 cases) and a non-diabetic renal disease (NDRD) group (50 cases). The clinical data were collected, and the factors associated with diabetic nephropathy (DN) were analyzed with multivariate logistic regression. A nomogram model for predicting DN risk was constructed by using R4.1 software. Receiver operator characteristic (ROC) curves were generated, and the K-fold cross-validation method was used for validation. A consistency test was performed by generating the correction curve.
Results: Systolic blood pressure (SBP), diabetic retinopathy (DR), hemoglobin (Hb), fasting plasma glucose (FPG) and triglyceride/cystatin C (TG/Cys-C) ratio were independent factors for DN in T2DM patients with proteinuria (P< 0.05). The nomogram model had good prediction efficiency. If the total score of the nomogram exceeds 200, the probability of DN is as high as 95%. The area under the ROC curve was 0.9412 (95% confidence interval (CI) = 0.8981– 0.9842). The 10-fold cross-validation showed that the prediction accuracy of the model was 0.8427. The Hosmer-Lemeshow (H-L) test showed that there was no significant difference between the predicted value and the actual observed value (X2 = 6.725, P = 0.567). The calibration curve showed that the fitting degree of the DN nomogram prediction model was good.
Conclusion: The nomogram model constructed in the present study improves the diagnostic efficiency of DN in T2DM patients with proteinuria, and it has a high clinical value.
Keywords: diabetic nephropathy, non-diabetic renal disease, nomogram model, type 2 diabetes mellitus
Introduction
Diabetic nephropathy (DN) is a chronic kidney disease (CKD) caused by diabetes mellitus (DM). The pathogenesis of DN is complex, and its clinical characteristics are increased with persistent albumin (ALB) excretion and/or progressive decline of glomerular filtration rate (GFR), eventually developing into end-stage renal disease (ESRD). DN is the main cause of ESRD, and approximately 30–50% of ESRD in the world is caused by DN.1 DN has become the primary cause of ESRD in middle-aged and elderly people in China.2 The occurrence, development, treatment and prognosis of DN are different from those of non-diabetic renal disease (NDRD). Therefore, a clear understanding of whether the kidney damage in DM is caused by DN, NDRD or DN combined with NDRD should be obtained before diagnosing DN.3 Renal biopsy is the gold standard for differentiating DN and NDRD,4 but considering the high degree of invasive renal biopsy, renal biopsy is generally performed only when NDRD is suspected.5 Therefore, the present study focused on how to identify DN and NDRD more accurately in T2DM patients with kidney injury. Based on the pathological diagnosis of renal biopsy in patients with T2DM, the present study explored the related factors of DN and established a nomogram model to predict the risk of DN to guide the clinical screening of DN high-risk groups and formulate more targeted intervention strategies.
Methods
Patients and Study Design
According to inclusion and exclusion criteria, 102 T2DM patients with proteinuria who were hospitalized in the Department of Nephrology of four hospitals in Xuzhou from January 2013 to October 2021 were selected as research subjects. The inclusion criteria were as follows: 1) T2DM was diagnosed according to the 2013 American Diabetes Association (ADA) criteria;6 2) proteinuria was diagnosed when the urinary albumin to creatinine ratio (UACR) > 30 mg/g; 3) ultrasound-guided fine needle renal biopsy (male or female) was completed; and 4) age > 18 years old with clear pathological results. The exclusion criteria were as follows: 1) type 1 diabetes, gestational diabetes mellitus and other special types of diabetes mellitus; 2) acute complications, such as diabetic ketoacidosis and hyperosmolar coma; 3) patients who had taken beta triglyceride lowering drugs within 3 months before renal biopsy; 4) complications with serious infection of other systems, failure of important organs, diseases of systemic immune system and malignant tumors; 5) proteinuria appeared before diagnosis of T2DM; 6) pathological results of renal biopsy showed DN combined with NDRD; and 7) patients with incomplete important data or missing target variable indicators.
This study was approved by the Ethics Committee of the Affiliated Hospital of Xuzhou Medical University (Ethics No. XYFY2021-KL073-01), following the Declaration of Helsinki. Written informed consent was waived due to the retrospective nature and low risk of the study.
According to the inclusion and exclusion criteria, a total of 102 patients were included. According to the pathological results of renal biopsy, the patients were divided into a DN group (52 cases) and an NDRD group (50 cases).
Clinical and Laboratory Data
Hemoglobin (Hb) was detected by a XE-5000 automatic blood analyzer (Japan), and fasting plasma glucose (FPG), ALB, cholesterol, triglyceride (TG), blood uric acid, blood creatinine, high density lipoprotein-c (HDL-c), low density lipoprotein-c (LDL-c), alanine aminotransferase, aspartate aminotransferase, total bilirubin, direct bilirubin and cystatin C (Cys-C) were detected by a cobas 8000 automatic biochemical analyzer (Roche, Germany). The ratio of TG and cystatin C was calculated. The glycosylated hemoglobin (HbA1C) was detected by high-performance liquid exchange chromatography with a HCL-723G8 analyzer (Japan), and fibrinogen was determined by the coagulation method with an automated hemagglutination test (Germany). The estimated GFR (eGFR) was estimated using the formula of kidney disease diet improvement (MDRD).7
Statistical Analyses
IBM SPSS statistical software (Version 22) and R software (Version 1.4.1106) were used to analyze the data. The rate or composition ratio were compared by the χ2 test. The clinical variables were analyzed by univariate logistic regression. The variables included in the multivariate logistic regression model were determined based on the results and professional knowledge. The stepwise regression method was used for analysis, and the statistically significant indexes were selected for the construction of a nomogram.
Based on the independent factors of DN, R software was used to establish the nomogram prediction model, using the area under the curve (AUC) of the receiver operator characteristic curve (ROC) to evaluate the performance of the nomogram prediction model. The K-fold cross-validation test was used to evaluate the accuracy of the model. The accuracy of the model was tested by the Hosmer-Lemeshow (H-L) test. The calibration curve, including 2000 bootstrap samples, was used for the internal verification of the nomogram prediction model.
Results
Patient Characteristics
Compared to the NDRD group, the DN group had significantly higher systolic blood pressure (SBP), higher diastolic blood pressure (DBP), longer duration of diabetes, higher FPG, higher Cys-C, higher serum creatinine (Scr), increased hypertension, increased diabetic retinopathy (DR), lower age, lower Hb, lower total cholesterol (TC) levels, lower TG levels, lower LDL-C levels, lower TG/Cys-C ratio and lower eGFR (P < 0.05). The results of the comparison of clinical characteristics between the two groups are shown in Table 1.
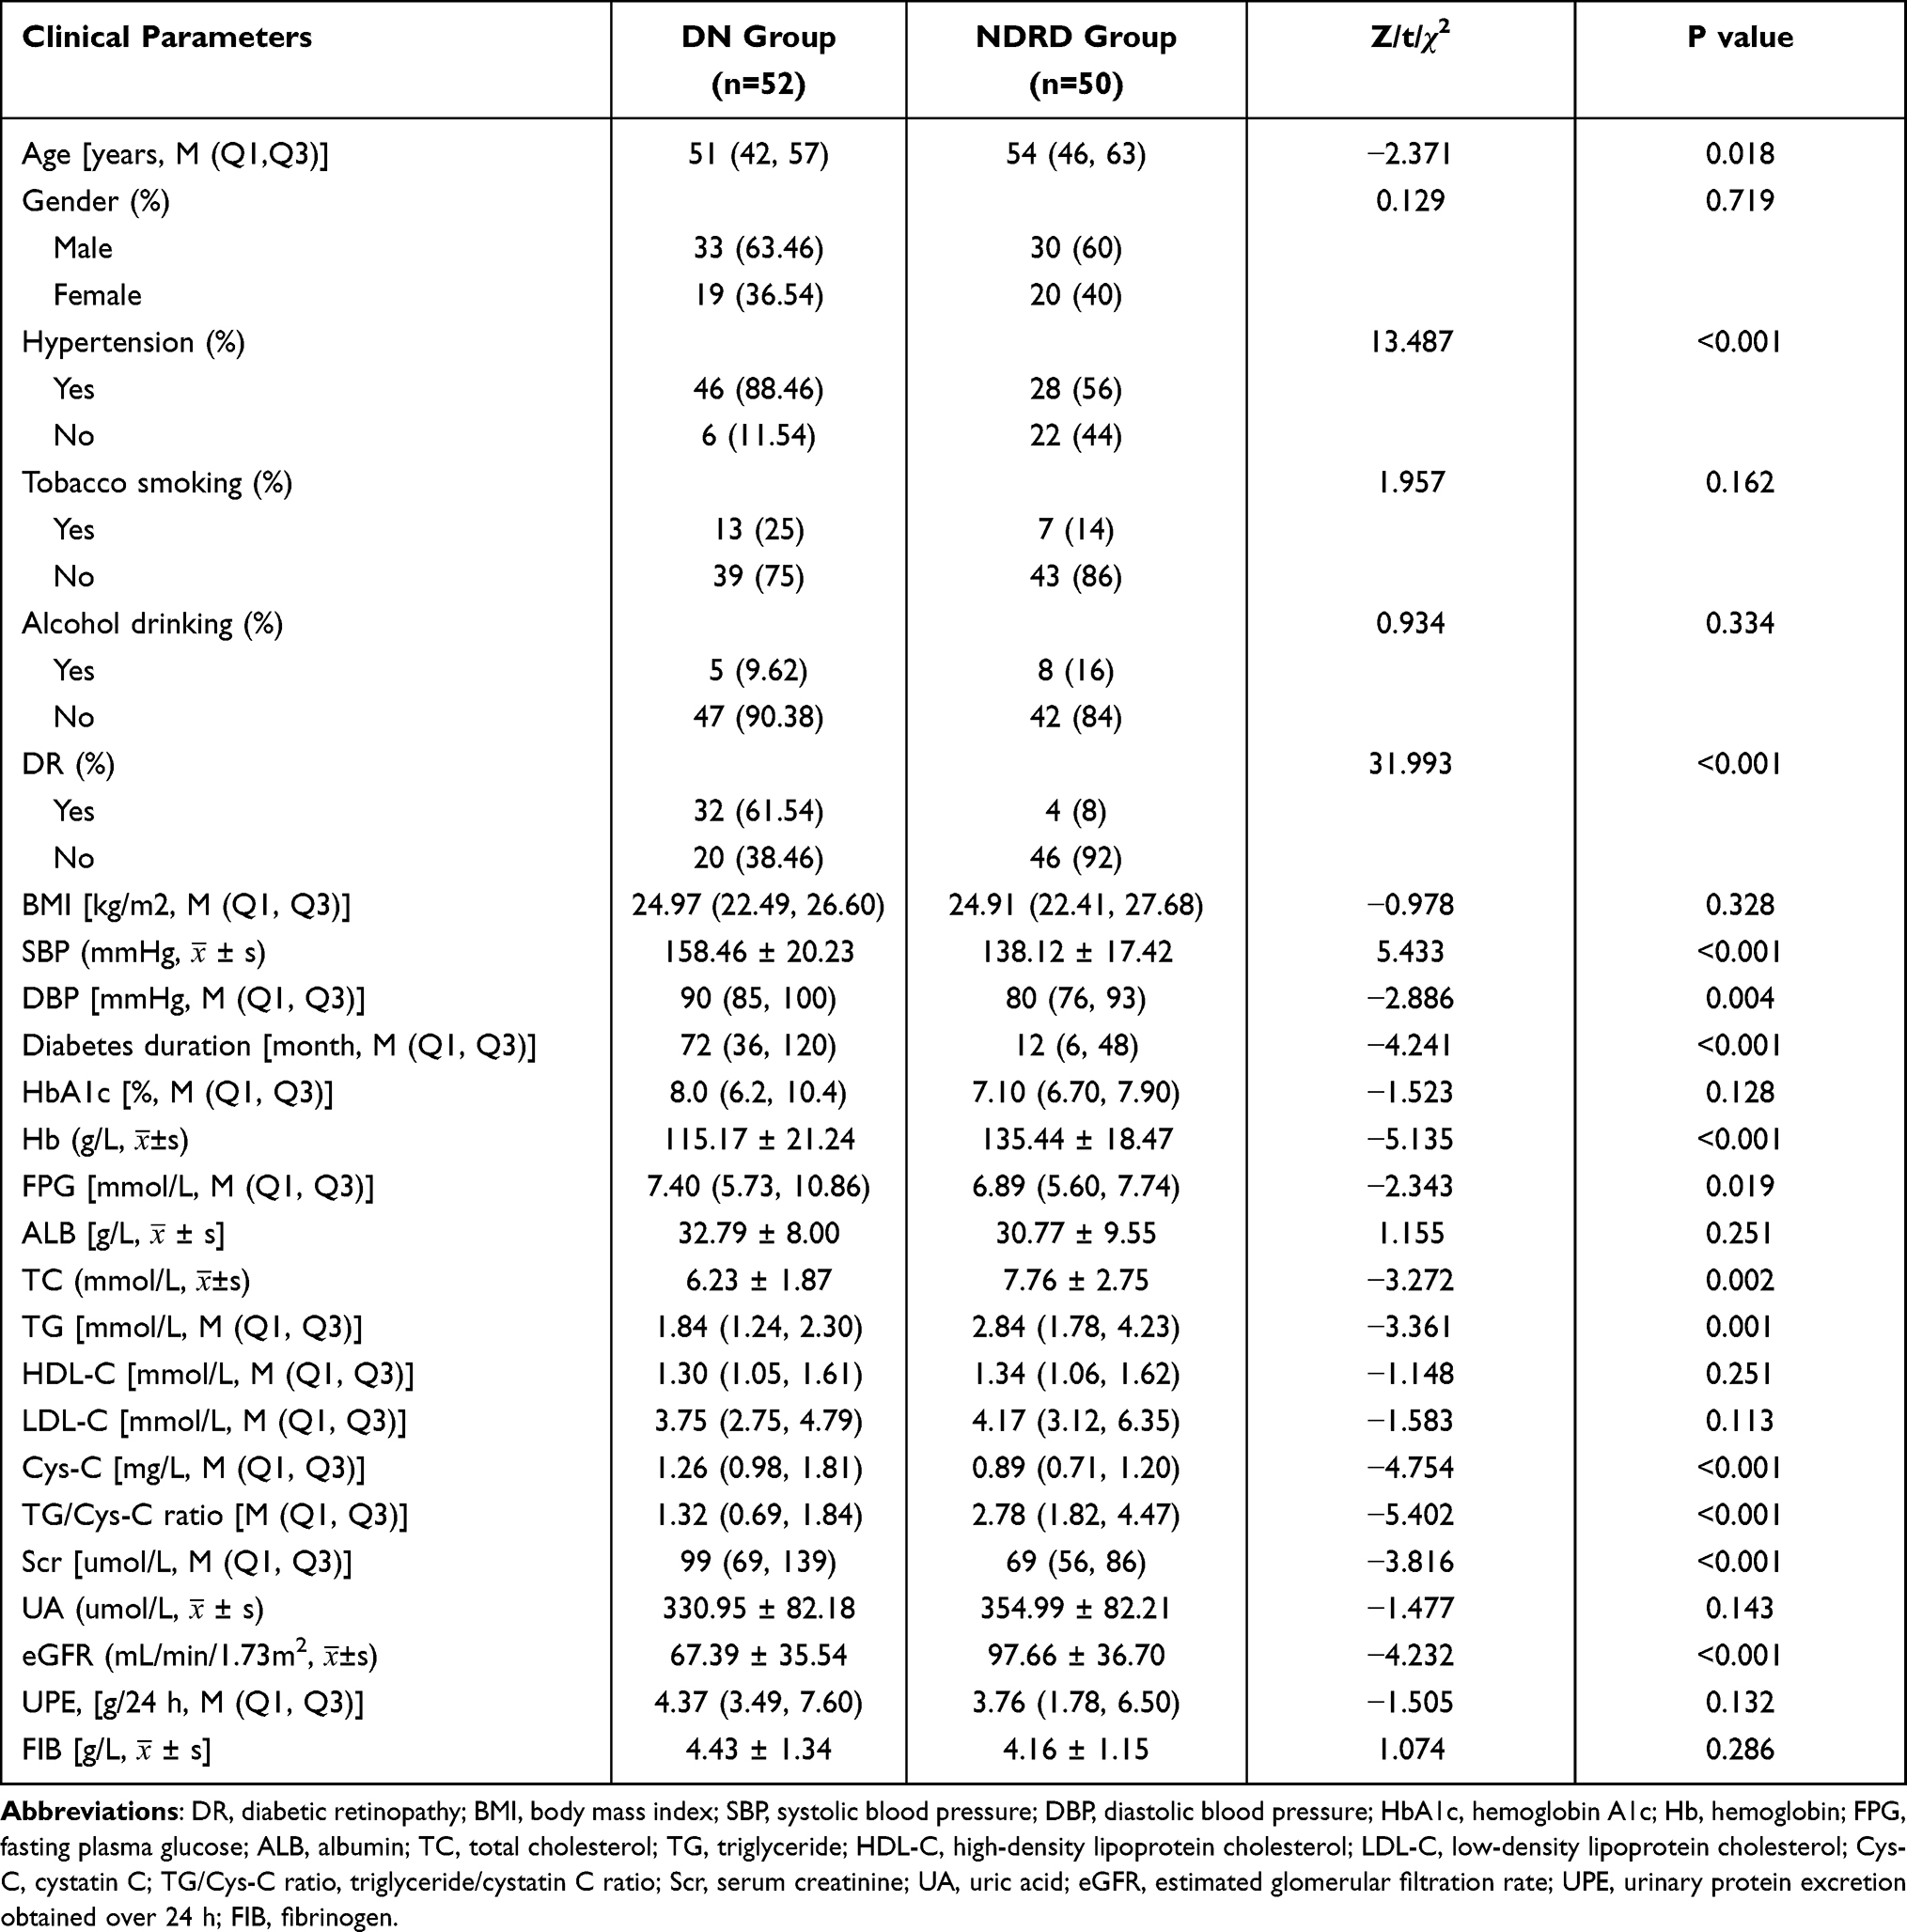 |
Table 1 Comparison of Clinical Characteristics Between the Two Groups |
Analysis of DN-Related Factors
The clinical variables of T2DM patients with proteinuria were included in univariate logistic regression. The related factors of DN included age, hypertension, SBP, DBP, duration of diabetes, DR, HbA1C, Hb, FPG, TC, TG, LDL-C, Cys-C, TG/Cys-C ratio, Scr and eGFR (Table 2).
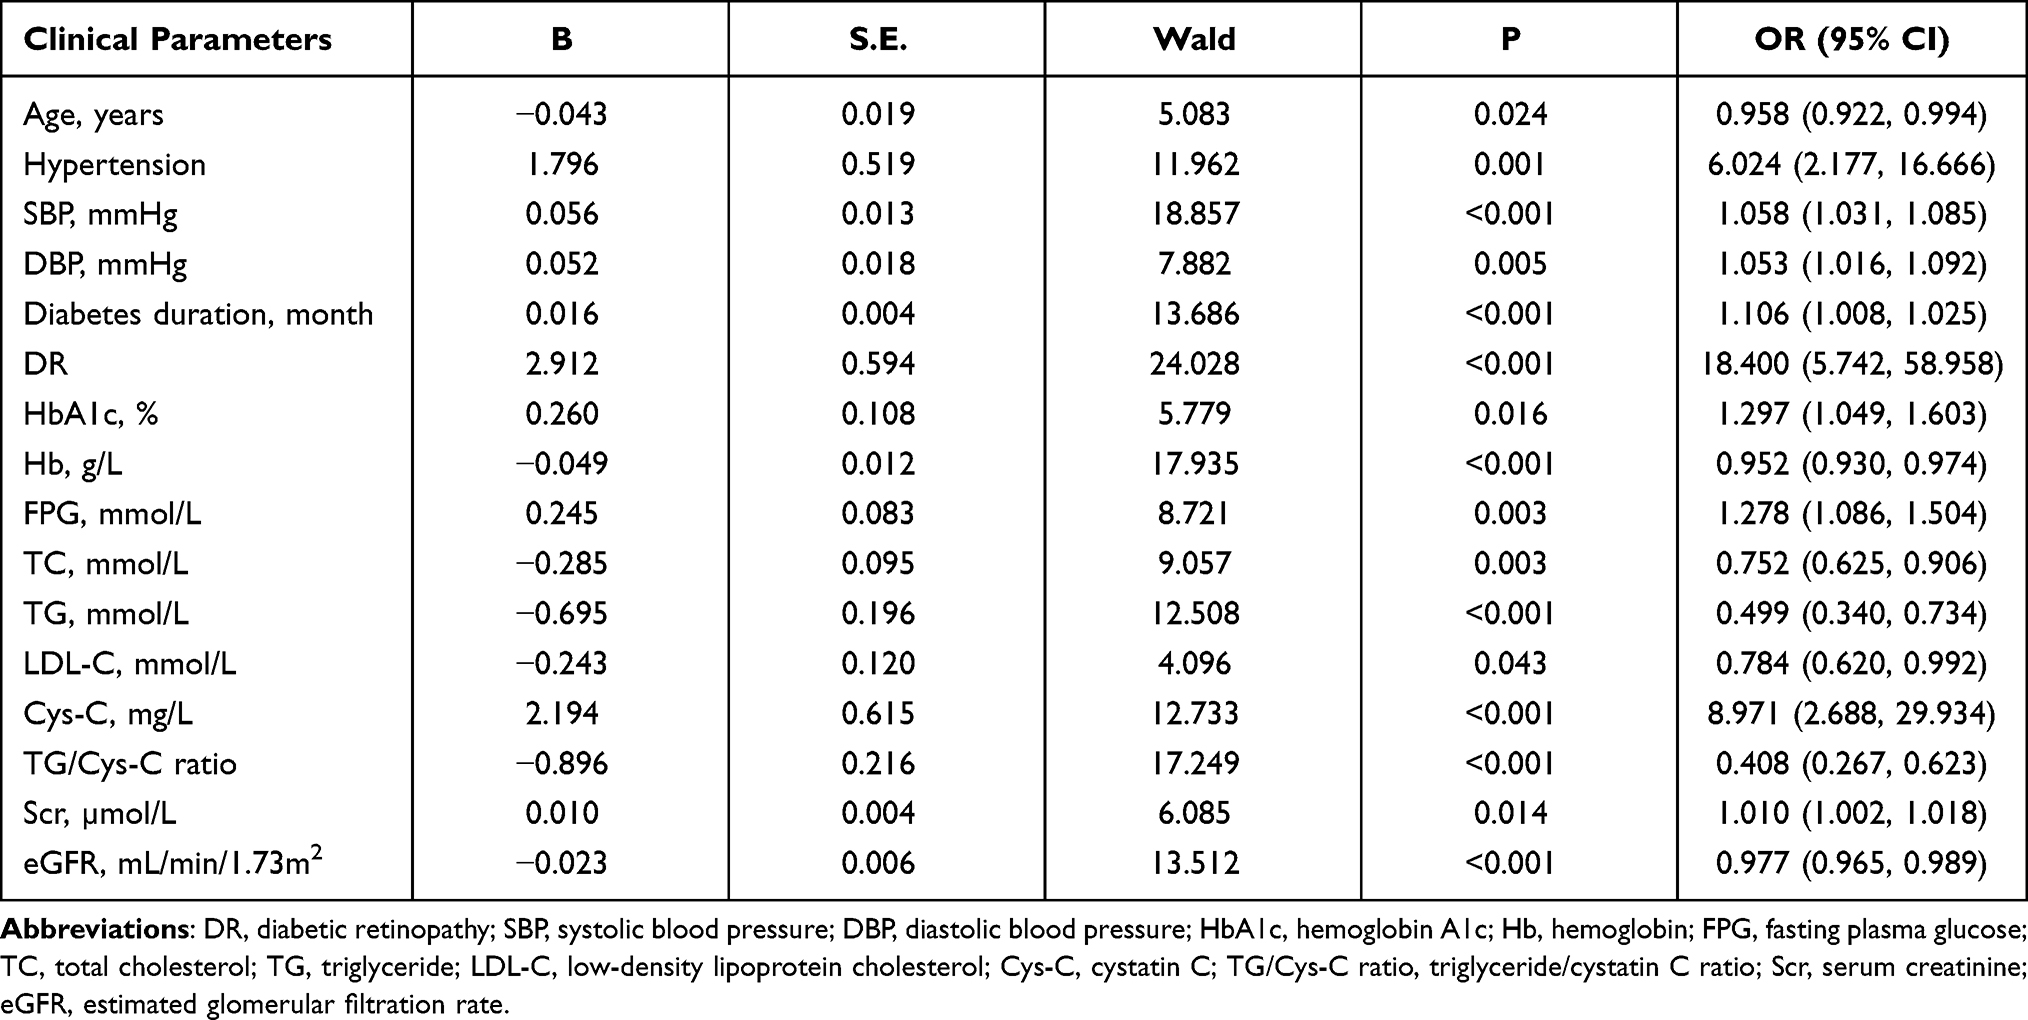 |
Table 2 Results of DN Univariate Logistic Regression Analysis |
DN Independent Factors Analysis
The related factors screened out in the single factor regression analysis were further used for stepwise regression analysis. The multivariate logistic regression analysis showed that the correlation among SBP, DR, Hb, FPG and TG/Cys-C ratio were independent factors for DN in T2DM patients with proteinuria, and they were related to the occurrence of DN (P < 0.05) (Table 3).
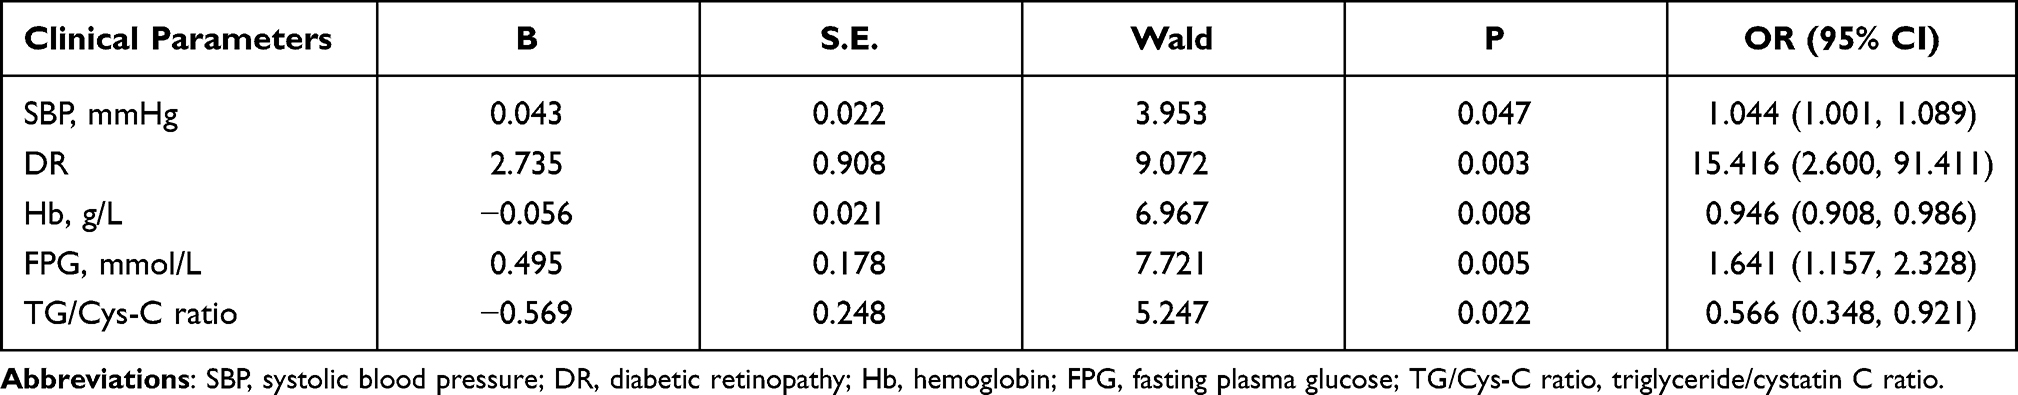 |
Table 3 Results of Multivariate Logistic Regression Analysis of DN |
Establishment and Verification of a Nomogram Model for Predicting DN
According to the results of the multivariate logistic regression analysis, five independent factors of DN (SBP, DR, Hb, FPG and TG/Cys-C ratio) of T2DM patients with proteinuria were input into R4.1 software to establish a nomogram model for predicting the risk of DN (Figure 1). According to the scale above the nomogram corresponding to each risk factor, the single score of each factor was obtained, and the total score was obtained by adding the individual scores. The individual scores were compared to the total score in descending order to obtain the probability of predicting DN. The total score ranged from 128 to 220, and the corresponding risk rate ranged from 0.05 to 0.99. Higher total scores indicated greater risks of DN in T2DM patients with proteinuria.
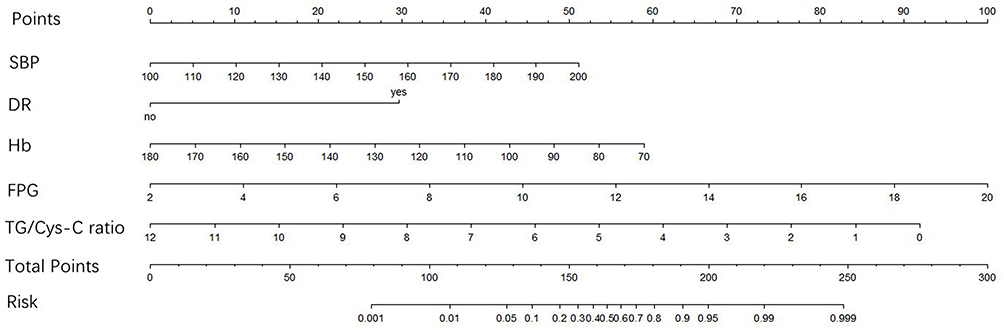 |
Figure 1 Nomogram model for predicting DN. Abbreviations: SBP, systolic blood pressure; DR, diabetic retinopathy; Hb, hemoglobin; FPG, fasting plasma glucose; TG/Cys-C ratio, triglyceride/cystatin C ratio. |
K-Fold Cross-Validation
The data in the model were randomly divided into a training set and a test set according to a 7:3 ratio. The 10-fold cross-validation showed that the prediction accuracy of the model was 0.8427 (kappa = 0.6859), which indicated that the construction of the model had high accuracy.
Discrimination Verification of the Nomogram
Based on the nomogram prediction model, the ROC curve was generated (Figure 2), and the AUC was calculated, resulting in an AUC value of 0.9412 (95% confidence interval (CI) = 0.8981–0.9842). According to the maximum value of the Youden index, the sensitivity, specificity, positive predictive value and negative predictive value of the model were 80.8%, 96.0%, 95.5% and 82.8%, respectively, which indicated that the nomogram model had good discrimination.
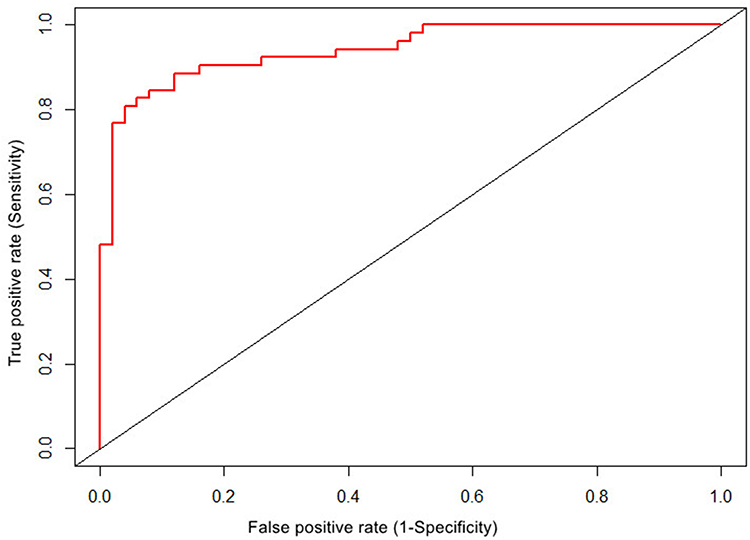 |
Figure 2 ROC curve of DN risk prediction efficiency. The abscissa represents the false positive rate, which is also (1-specificity), the ordinate represents the true positive rate, which is also the sensitivity, and the area under the red curve represents the area under the ROC curve. |
Calibration Verification of the Nomogram
The calibration curve of the nomogram prediction model is shown in Figure 3. The diagonal dotted line represents the perfect prediction of the ideal model, and the thin dotted line represents the performance of the nomogram. A fitting closer to the diagonal dotted line represents a better prediction. The H-L test showed no significant difference between the predicted value and the actual observed value (X2 = 6.725, P = 0.567). The calibration chart showed that the fitting degree of the DN nomogram prediction model was good.
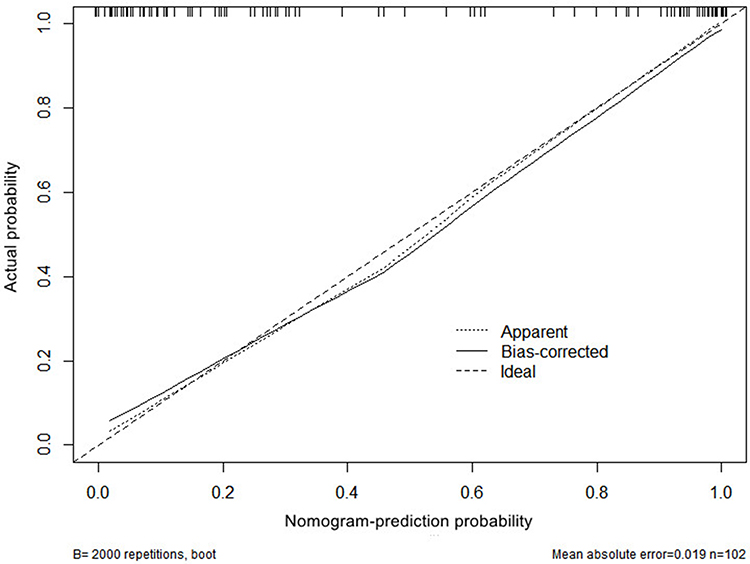 |
Figure 3 Calibration curve of nomogram model for predicting DN. New sample data set was obtained by using R4.1 software through Bootstraps method of independent sampling 2000 times, and calibration curve of DN occurrence risk line prediction was drawn. X-axis represents the probability of DN predicted by the nomogram model, and Y-axis represents the probability of DN actually diagnosed. |
Discussion
The diagnosis of DN lacks noninvasive and specific biomarkers. Renal biopsy is the basis for the diagnosis of DN. Previous studies have shown that NDRD has a better prognosis than DN.8 Identifying NDRD through renal biopsy is helpful to guide treatment and improve the prognosis.9 However, there is controversy about renal biopsy indications for proteinuria in T2DM, and there is no uniform standard at home and abroad.10,11 In the present study, the clinical data of T2DM patients with proteinuria were analyzed by univariate and multivariate logistic regression, which found that SBP, DR, Hb, FPG and TG/Cys-C ratio were independent factors for DN. Based on the above results, we constructed a DN risk evaluation model, which will help doctors intuitively analyze the risk weight of different levels of various factors on T2DM combined with DN. The nomogram model developed in the present study can realize individualized prediction. According to the score of the nomogram model, it can calculate the risk of DN in each T2DM patient with proteinuria to provide a differential diagnosis between DN and NDRD as well as formulate a personalized diagnosis and treatment plan as soon as possible.
The nomogram model in the present study contained the following five predictors: SBP, DR, Hb, TG/Cys-C ratio and FPG. Based on the nomogram prediction model, we generated the ROC curve and obtained an AUC value of 0.9412 (95% CI = 0.8981–0.9842). According to the maximum value of the Youden index, the sensitivity, specificity, positive prediction value and negative prediction value of the calculation model was 80.8%, 96.0%, 95.5% and 82.8%, respectively, which indicated that the nomogram model had good discrimination. The H-L test showed no significant difference between the predicted value and the actual observed value (X2 = 6.725, P = 0.567). The calibration curve showed that the nomogram prediction model fit well. As an example for the nomogram prediction model, suppose a T2DM patient has proteinuria, SBP of 160 mmHg, combined with DR, Hb of 90 g/L, FPG of 7.0 mmol/L and TG/Cys-C ratio of 3.0. As shown in Figure 1, the corresponding score of each parameter on the “points” axis is obtained, and “total points” is the sum of the scores of all parameters [32 (SBP) + 30 (combined DR) + 48 (Hb) + 28 (FPG) + 68 (TG/Cys-C ratio) =206]. The score corresponds to the “risk” axis, and the probability of DN in this patient is approximately 95%.
In this retrospective study based on renal biopsy, we investigated the clinical data and pathological features of patients with biopsy-confirmed DN and NDRD. In the present study, membranous nephropathy was the most common pathological type in patients with NDRD, which was similar to results previously reported in other Asian studies.12,13 In general, the distribution of glomerulopathy is related to age. A previous study stratifying NDRD patients according to age has reported that IgA nephropathy is dominant in patients under 60 years old, while membranous nephropathy is more common in patients over 60 years old.14 In the present study, the average age of NDRD patients was older than that of DN patients during renal biopsy. Thus, we considered that patients with NDRD may account for membrane nephropathy.
The TG/Cys-C ratio in T2DM patients with proteinuria takes into account abnormal lipid metabolism and renal insufficiency. These two indicators are related to the occurrence and development of DN. A previous meta-analysis has shown that TG levels in patients with NDRD are higher than those in patients with DN,15 but the specific mechanism needs to be further studied. Previous studies have shown that dyslipidemia plays an important role in the progression of type 2 diabetic nephropathy.16 Although the exact mechanism is unclear, TG levels are considered to be related to microvessels.17 The present study showed that the blood lipid level of NDRD patients was higher than that of DN patients. Although proteinuria will affect the blood TG level to a certain extent, there was no significant difference in the quantification of urinary protein between the two groups in the present study, thus not allowing the effect of proteinuria to be considered. Cys-C mainly exists in human nucleated cells and is a cystine protease inhibitor. Due to its small molecular weight, Cys-C passes through glomerular filtration, and only a few factors affect its filtration ability. Therefore, Cys-C reflects glomerular filtration and can be used as an ideal index to understand GFR.18 Previous studies have shown that Cys-C is a good biomarker of early nephropathy.19
In the univariate regression analysis, the TG level in the DN group was lower than that in the NDRD group, and the Cys-C level in the DN group was higher than that in the NDRD group. Here, we used the ratio of these two indexes for analysis. When the TG/Cys-C ratio was included in the regression, the results showed that the TG/Cys-C ratio was significantly better than the two indexes alone in distinguishing DN and NDRD. The multivariate regression analysis showed that the TG/Cys-C ratio was an independent protective factor for DN in T2DM patients with proteinuria. Each additional unit of the TG/Cys-C ratio decreased the risk of concurrent DN by 0.434 times. The area under the ROC curve of the diagnostic predictive value of the TG/Cys-C ratio for DN was 0.810 with a sensitivity and specificity of 80.8% and 70%, respectively. According to the maximum Youden index, the threshold of the diagnostic predictive value of the TG/Cys-C ratio for DN was 2.06. Thus, when the TG/Cys-C ratio is less than 2.06, T2DM patients with proteinuria are more likely to be diagnosed with DN. Conversely, when the TG/Cys-C ratio is greater than 2.06, T2DM patients with proteinuria are more likely to be diagnosed with NDRD. Currently, it is more meaningful to conduct renal biopsy for T2DM patients with proteinuria. Therefore, we suggest that the TG/Cys-C ratio may have clinical significance in the differential diagnosis of DN and NDRD, and it may have clinical guiding value in screening patients with NDRD. Therefore, the nomogram model shows that the TG/Cys-C ratio has a high predictive value for DN in T2DM patients with proteinuria.
DR is also one of the most common microvascular complications in T2DM patients. Multivariate regression analysis showed that the risk of DN in patients with DR was 14.416 times higher than that in patients without DR. Thus, the possibility of developing DN in patients with DR is more likely, which is consistent with the conclusion that most studies suggest that DR is closely related to DN.20 When T2DM patients have proteinuria and no DR, NDRD is considered more likely, and further renal biopsy is important. ADA guidelines suggest that patients without DR lesions should be diagnosed with DM combined with NDRD.21 As previous studies have shown, the absence of DR may be a useful indicator of renal biopsy in T2DM patients with proteinuria.22 A recent meta-analysis has shown that DR has high sensitivity and specificity in predicting DN.23 However, the absence of DR largely indicates the possibility of NDRD, but this does not completely exclude DN.24
The occurrence of DN is generally associated with hypertension. The present study found that the number of cases with DN combined with a history of hypertension was significantly higher than that in the NDRD group. The mean SBP in the DN group was higher than that in the NDRD group (158.46 ± 20.23 vs 138.12 ± 17.42, P < 0.001), which was consistent with other research conclusions.25 In the present study, multivariate regression analysis showed that SBP was an independent risk factor for DN in T2DM patients with proteinuria. Each additional unit of SBP increased the risk of DN by 0.044 times. The pathogenesis of hypertension in T2DM patients with proteinuria is usually complex, which may be due to the activation of renin and angiotensin aldosterone system as well as the effect of the diabetic environment on the release of reactive oxygen species and inflammatory mediators.26 Even the genetic relationship between hypertension and DN may play a role.27 Several prospective trials have shown that strict control of blood pressure in patients with DN reduces the incidence of macrovascular and microvascular complications.28 In addition, blood pressure measurement has great volatility, which may have led to some deviation in the present study, thus requiring verification by a large-scale multicenter study.
Anemia is a complication of CKD, especially in patients with DN. In the present study, the Hb level of the DN group was significantly lower than that of the DNRD group, and several clinical studies have confirmed the predictive value of anemia in the diagnosis of DN.26,29 Anemia is also a risk factor for ESRD, cardiovascular disease time and overall mortality in patients with DM.30 The Hb level of DN patients confirmed by renal biopsy was significantly lower than that of NDRD patients (115.17 ± 21.24 vs 135.44 ± 18.47, P < 0.001). Multivariate regression analysis showed that anemia was an independent risk factor for DN in T2DM patients with proteinuria. Animal experiments and in vitro studies have shown that renal hypoxia upregulates hypoxia inducible factor-1, erythropoietin gene and transcriptional regulators of heme oxygenase, nitric oxide synthase, extracellular matrix and apoptosis genes.31 Anemia is upregulated by renal hypoxia and induces the gene expression of collagen in renal fibroblasts, thereby increasing interstitial fibrosis. Anemia may also increase renal sympathetic nerve activity, resulting in increased glomerular pressure and increased urinary protein, further aggravating the deterioration of renal function.32 Therefore, Hb is also affected by renal function in patients with nephropathy. In the present study, the renal function damage of DN was more serious than that of NDRD. The present study found that among T2DM patients with proteinuria, DN patients had higher Scr level [99 (69, 139) vs 69 (56, 86)] and lower GFR [67.39 ± 35.54 vs 97.66 ± 36.70] compared to NDRD patients. These findings indicated that most patients with DN generally have renal biopsy in the late stage of the disease, which is consistent with previous studies.33 Compared to the NDRD group, the renal function of patients in the DN group was poor, and they had more serious anemia.
Hyperglycemia is also a major risk factor for DN in patients with DM.34 Studies have confirmed that changes in FPG and HbA1c are risk factors for progression to ESRD in patients with DM.35 HbA1c is the part of Hb that combines with glucose in the blood. HbA1c reflects the blood glucose control of patients in the previous 8–12 weeks. In the present study, there was no significant difference in the level of HbA1c between the DN and NDRD groups, which showed that the blood glucose control level of the two groups was similar. The FPG in the DN group was higher than that in NDRD group [7.40 (5.73, 10.86) vs 6.89 (5.60, 7.74), P < 0.05]. Multivariate regression analysis showed that FPG was an independent risk factor for DN in T2DM patients. Chronic hyperglycemia in diabetics will accelerate nonenzymatic glycation, which leads to tissue hypoxia and vasoactive substance release, resulting in hemodynamic changes. Chronic hyperglycemia is an important risk factor for DN.36 Therefore, more stringent glycemic control can significantly reduce the risk of diabetic microvascular complications.37
In summary, the present study established a nomogram model to predict DN risk based on five factors, including SBP, DR, Hb, FPG and TG/Cys-C ratio, resulting in a model with accurate identification and high clinical application value. The nomogram model has guiding significance for the identification of high-risk groups of DN and the formulation of intervention strategies. At the same time, our nomogram model is expected to provide a visual prediction tool for clinicians.
Regarding the main advantages of our research, we used DN and NDRD patients confirmed by renal biopsy, and we generated a nomogram prediction model of DN according to their routine biochemical indexes. Because the research content was similar to clinical practice, the nomogram prediction model may better guide clinicians.
The present study had several limitations. First, selection bias is inevitable in any retrospective study of biopsy-based clinicopathology. Therefore, the conclusions do not apply to the general population of diabetic patients. Secondly, this retrospective study could not avoid information bias. The medical history data of the patients were obtained from the internal electronic medical record system of the hospital, which may have poor accuracy of medical history records. In addition, the sample size of the renal biopsy patients in this study was small, indicating that the nomogram model for predicting the risk of DN needs to be further verified by a study with a larger sample size. Finally, the present study suggested that the nomogram can predict the occurrence probability of DN patients but cannot predict the course of disease and prognosis of DN. Further in-depth and detailed research and analysis are needed to provide better clinical guidance for the identification, diagnosis, treatment and prognosis of DN patients.
Ethics Statement
This study was approved by the Institutional Ethics Committee of the Affiliated Hospital of Xuzhou Medical University (Ethics No. XYFY2021-KL073-01).
Author Contributions
All authors made a significant contribution to the work reported as follows: conception, design and execution of the study; acquisition, analysis and interpretation of data; participated in drafting, revising or critically reviewing the article; gave final approval of the version to be published; agreed on the journal to which the article has been submitted; and agreed to be accountable for all aspects of the work. These authors contributed equally to the manuscript: Dong-mei Zhou and Jing Wei.
Disclosure
The authors declare that they have no conflicts of interest for this work.
References
1. Ruiz-Ortega M, Rodrigues-Diez RR, Lavoz C, Rayego-Mateos S. Diabetic nephropathy: diagnosis, prevention and treatment. J Clin Med. 2020;9:3. doi:10.3390/jcm9030813
2. Hou JH, Zhu HX, Zhou ML, et al. Changes in the spectrum of kidney diseases: an analysis of 40,759 biopsy-proven cases from 2003 to 2014 in China. Kidney Dis. 2018;4(1):10–19. doi:10.1159/000484717
3. Bilous RW, Gonzalez-Campoy JM, Fradkin JE, et al. KDOQI clinical practice guideline for diabetes and CKD: 2012 update. Am J Kidney Dis. 2012;60(5):850–886. doi:10.1053/j.ajkd.2012.07.005
4. Yang YZ, Wang JW, Wang F, et al. Incidence, development, and prognosis of diabetic kidney disease in China: design and methods. Chin Med J. 2017;130(2):199–202. doi:10.4103/0366-6999.198002
5. Umanath K, Lewis JB. Update on diabetic nephropathy: core curriculum 2018. Am J Kidney Dis. 2018;71(6):884–895. doi:10.1053/j.ajkd.2017.10.026
6. American Diabetes Association. Diagnosis and classification of diabetes mellitus. Diabetes Care. 2013;36 Suppl 1(Suppl 1):S67–74. doi:10.2337/dc13-S067
7. Levey AS, Coresh J, Greene T, et al. Expressing the modification of diet in renal disease study equation for estimating glomerular filtration rate with standardized serum creatinine values. Clin Chem. 2007;53(4):766–772. doi:10.1373/clinchem.2006.077180
8. Chang TI, Park JT, Kim JK, et al. Renal outcomes in patients with type 2 diabetes with or without coexisting non-diabetic renal disease. Diabetes Res Clin Pract. 2011;92(2):198–204. doi:10.1016/j.diabres.2011.01.017
9. Soleymanian T, Hamid G, Arefi M, et al. Non-diabetic renal disease with or without diabetic nephropathy in type 2 diabetes: clinical predictors and outcome. Ren Fail. 2015;37(4):572–575. doi:10.3109/0886022X.2015.1007804
10. Zhuo L, Ren W, Li W, Zou G, Lu J. Evaluation of renal biopsies in type 2 diabetic patients with kidney disease: a clinicopathological study of 216 cases. Int Urol Nephrol. 2013;45(1):173–179. doi:10.1007/s11255-012-0164-6
11. Bermejo S, Pascual J, Soler MJ. The current role of renal biopsy in diabetic patients. Minerva Med. 2018;109(2):116–125. doi:10.23736/S0026-4806.17.05446-5
12. Dong Z, Wang Y, Qiu Q, et al. Clinical predictors differentiating non-diabetic renal diseases from diabetic nephropathy in a large population of type 2 diabetes patients. Diabetes Res Clin Pract. 2016;121:112–118. doi:10.1016/j.diabres.2016.09.005
13. Vickers AJ, Cronin AM, Elkin EB, et al. Extensions to decision curve analysis, a novel method for evaluating diagnostic tests, prediction models and molecular markers. BMC Med Inform Decis Mak. 2008;8:53. doi:10.1186/1472-6947-8-53
14. Aldemir O, Turgut F, Gokce C. The association between methylation levels of targeted genes and albuminuria in patients with early diabetic kidney disease. Ren Fail. 2017;39(1):597–601. doi:10.1080/0886022X.2017.1358180
15. Liang S, Zhang XG, Cai GY, et al. Identifying parameters to distinguish non-diabetic renal diseases from diabetic nephropathy in patients with type 2 diabetes mellitus: a meta-analysis. PLoS One. 2013;8(5):e64184. doi:10.1371/journal.pone.0064184
16. Dominguez JH, Tang N, Xu W, et al. Studies of renal injury III: lipid-induced nephropathy in type II diabetes. Kidney Int. 2000;57(1):92–104. doi:10.1046/j.1523-1755.2000.00814.x
17. Zoppini G, Negri C, Stoico V, Casati S, Pichiri I, Bonora E. Triglyceride-high-density lipoprotein cholesterol is associated with microvascular complications in type 2 diabetes mellitus. Metabolism. 2012;61(1):22–29. doi:10.1016/j.metabol.2011.05.004
18. Ioannou K. Diabetic nephropathy: is it always there? Assumptions, weaknesses and pitfalls in the diagnosis. Hormones. 2017;16(4):351–361. doi:10.14310/horm.2002.1755
19. Elsayed MS, El Badawy A, Ahmed A, Omar R, Mohamed A. Serum cystatin C as an indicator for early detection of diabetic nephropathy in type 2 diabetes mellitus. Diabetes Metab Syndr. 2019;13(1):374–381. doi:10.1016/j.dsx.2018.08.017
20. Mou S, Wang Q, Liu J, et al. Prevalence of non-diabetic renal disease in patients with type 2 diabetes. Diabetes Res Clin Pract. 2010;87(3):354–359. doi:10.1016/j.diabres.2009.11.012
21. Tuttle KR, Bakris GL, Bilous RW, et al. Diabetic kidney disease: a report from an ADA Consensus Conference. Diabetes Care. 2014;37(10):2864–2883. doi:10.2337/dc14-1296
22. Huang F, Yang Q, Chen L, Tang S, Liu W, Yu X. Renal pathological change in patients with type 2 diabetes is not always diabetic nephropathy: a report of 52 cases. Clin Nephrol. 2007;67(5):293–297. doi:10.5414/CNP67293
23. He F, Xia X, Wu XF, Yu XQ, Huang FX. Diabetic retinopathy in predicting diabetic nephropathy in patients with type 2 diabetes and renal disease: a meta-analysis. Diabetologia. 2013;56(3):457–466. doi:10.1007/s00125-012-2796-6
24. Prakash J, Gupta T, Prakash S, et al. Non-diabetic renal disease in type 2 diabetes mellitus: study of renal - retinal relationship. Indian J Nephrol. 2015;25(4):222–228. doi:10.4103/0971-4065.144420
25. Zhou J, Chen X, Xie Y, et al. A differential diagnostic model of diabetic nephropathy and non-diabetic renal diseases. Nephrol Dial Transplant. 2008;23(6):1940–1945. doi:10.1093/ndt/gfm897
26. Jiang S, Fang J, Yu T, et al. Novel model predicts diabetic nephropathy in type 2 diabetes. Am J Nephrol. 2020;51(2):130–138. doi:10.1159/000505145
27. Agius E, Attard G, Shakespeare L, et al. Familial factors in diabetic nephropathy: an offspring study. Diabet Med. 2006;23(3):331–334. doi:10.1111/j.1464-5491.2006.01803.x
28. Sternlicht H, Bakris GL. Management of hypertension in diabetic nephropathy: how low should we go. Blood Purif. 2016;41(1–3):139–143. doi:10.1159/000441264
29. Yang Z, Feng L, Huang Y, et al. A differential diagnosis model for diabetic nephropathy and non-diabetic renal disease in patients with type 2 diabetes complicated with chronic kidney disease. Diabetes Metab Syndr Obes. 2019;12:1963–1972. doi:10.2147/DMSO.S223144
30. Liu MY, Chen XM, Sun XF, et al. Validation of a differential diagnostic model of diabetic nephropathy and non-diabetic renal diseases and the establishment of a new diagnostic model. J Diabetes. 2014;6(6):519–526. doi:10.1111/1753-0407.12150
31. Mohanram A, Toto RD. Outcome studies in diabetic nephropathy. Semin Nephrol. 2003;23(3):255–271. doi:10.1016/S0270-9295(03)00061-5
32. Mehdi U, Toto RD. Anemia, diabetes, and chronic kidney disease. Diabetes Care. 2009;32(7):1320–1326. doi:10.2337/dc08-0779
33. Popa O, Stefan G, Capusa C, et al. Non-diabetic glomerular lesions in diabetic kidney disease: clinical predictors and outcome in an Eastern European cohort. Int Urol Nephrol. 2021;53(4):739–747. doi:10.1007/s11255-020-02681-x
34. Retnakaran R, Cull CA, Thorne KI, et al. Risk factors for renal dysfunction in type 2 diabetes: UK Prospective Diabetes Study 74. Diabetes. 2006;55(6):1832–1839. doi:10.2337/db05-1620
35. Yang YF, Li TC, Li CI, et al. Visit-to-visit glucose variability predicts the development of end-stage renal disease in type 2 diabetes: 10-year follow-up of Taiwan diabetes study. Medicine. 2015;94(44):e1804. doi:10.1097/MD.0000000000001804
36. Hu Y, Shi R, Mo R, et al. Nomogram for the prediction of diabetic nephropathy risk among patients with type 2 diabetes mellitus based on a questionnaire and biochemical indicators: a retrospective study. Aging. 2020;12(11):10317–10336. doi:10.18632/aging.103259
37. Lou J, Jing L, Yang H, et al. Risk factors for diabetic nephropathy complications in community patients with type 2 diabetes mellitus in Shanghai: logistic regression and classification tree model analysis. Int J Health Plann Manage. 2019;34(3):1013–1024. doi:10.1002/hpm.2871
 © 2022 The Author(s). This work is published and licensed by Dove Medical Press Limited. The
full terms of this license are available at https://www.dovepress.com/terms
and incorporate the Creative Commons Attribution
- Non Commercial (unported, 3.0) License.
By accessing the work you hereby accept the Terms. Non-commercial uses of the work are permitted
without any further permission from Dove Medical Press Limited, provided the work is properly
attributed. For permission for commercial use of this work, please see paragraphs 4.2 and 5 of our Terms.
© 2022 The Author(s). This work is published and licensed by Dove Medical Press Limited. The
full terms of this license are available at https://www.dovepress.com/terms
and incorporate the Creative Commons Attribution
- Non Commercial (unported, 3.0) License.
By accessing the work you hereby accept the Terms. Non-commercial uses of the work are permitted
without any further permission from Dove Medical Press Limited, provided the work is properly
attributed. For permission for commercial use of this work, please see paragraphs 4.2 and 5 of our Terms.