Back to Journals » Journal of Inflammation Research » Volume 16
Establishment and Analysis of an Artificial Neural Network Model for Early Detection of Polycystic Ovary Syndrome Using Machine Learning Techniques
Authors Wu Y ![]() , Xiao Q, Wang S, Xu H, Fang Y
, Xiao Q, Wang S, Xu H, Fang Y
Received 5 September 2023
Accepted for publication 10 November 2023
Published 29 November 2023 Volume 2023:16 Pages 5667—5676
DOI https://doi.org/10.2147/JIR.S438838
Checked for plagiarism Yes
Review by Single anonymous peer review
Peer reviewer comments 2
Editor who approved publication: Professor Ning Quan
Yumi Wu,1 QiWei Xiao,1 ShouDong Wang,2 Huanfang Xu,1,3 YiGong Fang1,3
1Institute of Acupuncture and Moxibustion of China Academy of Chinese Medical Sciences, Beijing, People’s Republic of China; 2The Out-Patient Department of TCM of China Academy of Chinese Medical Sciences, Beijing, People’s Republic of China; 3Acupuncture and Moxibustion Hospital of China Academy of Chinese Medical Sciences, Beijing, People’s Republic of China
Correspondence: YiGong Fang; Huanfang Xu, Institute of Acupuncture and Moxibustion of China Academy of Chinese Medical Sciences, 16 Dongzhimennei South St, Dongcheng, Beijing, 100700, People’s Republic of China, Tel +86 13520175177, Fax +86 010-64089219, Email [email protected]; [email protected]
Background: To identify novel gene combinations and to develop an early diagnostic model for Polycystic Ovary Syndrome (PCOS) through the integration of artificial neural networks (ANN) and random forest (RF) methods.
Methods: We retrieved and processed gene expression datasets for PCOS from the Gene Expression Omnibus (GEO) database. Differential expression analysis of genes (DEGs) within the training set was performed using the “limma” R package. Enrichment analyses on DEGs using gene ontology (GO) and the Kyoto Encyclopedia of Genes and Genomes (KEGG), and immune cell infiltration. The identification of critical genes from DEGs was then performed using random forests, followed by the developing of new diagnostic models for PCOS using artificial neural networks.
Results: We identified 130 up-regulated genes and 132 down-regulated genes in PCOS compared to normal samples. Gene Ontology analysis revealed significant enrichment in myofibrils and highlighted crucial biological functions related to myofilament sliding, myofibril, and actin-binding. Compared with normal tissues, the types of immune cells expressed in PCOS samples are different. A random forest algorithm identified 10 significant genes proposed as potential PCOS-specific biomarkers. Using these genes, an artificial neural network diagnostic model accurately distinguished PCOS from normal samples. The diagnostic model underwent validation using the independent validation set, and the resulting area under the receiver operating characteristic curve (AUC) values was consistent with the anticipated outcomes.
Conclusion: Utilizing unique gene combinations, this research created a diagnostic model by merging random forest techniques with artificial neural networks. The AUC indicated a notably superior performance of the diagnostic model.
Keywords: polycystic ovary syndrome, machine learning techniques, artificial neural network model, early diagnostic model, artificial neural networks, random forest
Background
The Polycystic Ovary Syndrome (PCOS) is an endocrine disorder characterized by heterogeneity and closely linked to various symptoms.1 The National Institutes of Health (NIH),2 the European Society for Human Reproduction and Embryology (ESHRE) and the American Society for Reproductive Medicine (ASRM) with their consensus,3,4 and the Androgen Excess Society (AES) with its reference criteria5 are the three main bodies proposing diagnostic criteria for PCOS. However, despite the proposals for these standards, a consensus has yet to be reached within the field.6 The complex genetic architecture forms the basis for the multifactorial etiology of PCOS.7 Moreover, previous studies have found that race is closely associated with PCOS phenotype due to different genetic metabolic disorders and environmental tendencies. Therefore, the aim of the study is to investigate unique and essential gene combinations while developing an early diagnostic model for PCOS.
The study of disease mechanisms has significantly benefited from the advancement and increased precision of RNA sequencing technologies and the availability of microarray technology.8 Identifying the most relevant variables for classification is the primary challenge when developing a categorization framework based on gene expression profiles. We apply various machine learning algorithms, including RF9,10 and ANN,11 to address this issue. Unlike standard statistical methods, machine learning involves extracting and analyzing information from case reports. Therefore, RF and ANN jointly developed a new PCOS diagnostic model by hypothesizing and exploring from the training set, and then validating in the validation set.8
Materials and Methods
Study Design
This study collected three datasets from GEO database (GSE6798, GSE84958, GSE43264). GSE6798 and GSE84958 sets were designated as the training set and GSE43264 was the validation set. using the “limma” R package12 to analyze differentially expressed genes (DEGs). For the training set DEGs, we conducted Gene ontology (GO) functional enrichment analysis and Kyoto Encyclopedia of Genes and Genomes (KEGG) pathway enrichment analysis using the “clusterProfiler” R package.13 In addition, immune cell infiltration analysis was carried out with R package. The study identified 10 critical genes from DEGs using the random forest algorithm via the ‘Random Forest’ R package.14 Furthermore, an artificial neural network (ANN) diagnostic model was developed based on 10 critical genes using the “neural network” R package and evaluated by AUC. Finally, the ANN diagnostic model’s validity was validated using the validation set’s performance (Figure 1).
 |
Figure 1 Schematic illustration of study design. A total of 264 differentially expressed genes were obtained from the differential expression analysis of GSE6798 data set. The random forest model was used to test the potential of all 264 deg as classification-related genes, and 12 key genes were identified. Artificial Neural Network (ANN), another machine learning algorithm, is used to calculate the weight of genes. Therefore, a general classification model called neural PCOS is established by using RF and ANN. |
Data Download and Processing
The GSE6798, GSE84958 and GSE43264 datasets were obtained from the GEO, the gene expression data was replaced with its average expression value. This study included 29 samples in GSE6798 (13 normal samples and 16 Polycystic Ovary Syndrome (PCOS) samples), 53 samples in GSE84958 (2 3 normal samples and 30 PCOS samples) and 15 samples in GSE43264 (7 normal samples and 8 PCOS samples) (Table 1). GSE6798 and GSE84958 were combined to form the training set, while GSE43264 served as the validation set.
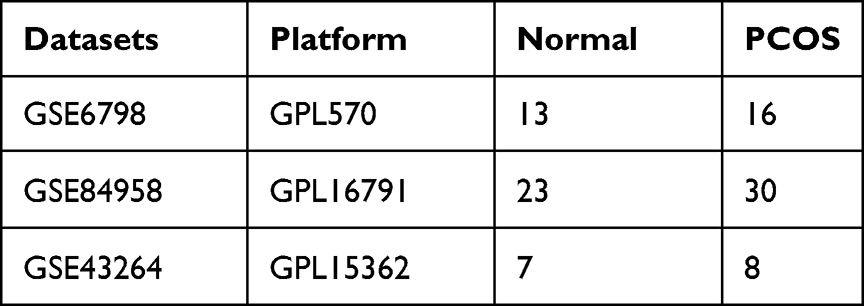 |
Table 1 Dataset Source |
Differential Gene Expression Analysis
The differentially expressed genes (DEGs) were identified in the training set consisting of 36 normal samples and 46 PCOS samples using classical Bayesian data analysis and the “limma” R package. The threshold was set at |log2FC|>1 and adjusted P<0.05. Subsequently, 264 DEGs were obtained. The “Pheatmap” and “ggplot2”15 R package were used for heatmap and volcano plot analysis.
GO Functional and KEGG Pathway Enrichment Analyses
To investigate the biological significance of these DEGs, GO enrichment analysis was conducted, which classified genes into biological process (BP), cellular component (CC), and molecular function (MF) with an adjusted P <0.05. KEGG pathway enrichment analysis was also conducted to describe metabolic pathways (P < 0.05). Using the “clusterProfiler” R package to perform the enrichment analysis of DEGs.16
Immune Cell Infiltration Analysis
Immune cells, fundamental components of the tumor microenvironment, influence the development and prognosis of tumors.13 Their composition and function differ across various tumor types. While some immune cells serve as targets for immunotherapy, immune cells can also negatively affect same individuals, even leading to the development of drug resistance.12,13 Therefore, understanding the key components and possible effects of immune cells in PCOS is beneficial for identifying valuable therapeutic targets. We obtained results involving the expression of immune cell in each sample by R software. Based on these results, further correlation analysis was performed on immune cells by the “corrplot” R package12 and differential analysis of immune cells using the “vioplot” R package.12
Random Forest Analysis
Random Forest classifiers identified key genes via “randomForest” R package.17 The parameter’ ntree was set to 500 to determine the optimal number of trees. By calculating the cross-validation error, 15 trees were selected as the optimal number of trees representing the smallest cross-validation error. Subsequently, random forests were rederived using parameter 15 to obtain the importance score of genes. Genes with importance scores greater than 2 were regarded as significantly associated with PCOS. Finally, a “heatmap” was used for the mapping the key genes.
Development and Validation of Artificial Neural Network Model
Using the “Neural Networks” R package, a model based on artificial neural networks was crafted to analyze five important genes identified by radiofrequency. The expression levels of five important genes were transformed into “gene labels”, and the expression levels of specific genes were compared to the median of the expression profiles across all samples. In the upregulated genes, a value of 1 was assigned if the expression level was above the median and 0 otherwise. In down-regulated genes, a value of 0 was assigned if the expression level was above the median and 1 otherwise. A gene tag table was then created and the hidden layer of ANN was set to 5 to obtain the gene weights calculated from the “gene labels”. Finally, an artificial neural network diagnosis model was established and evaluated in the training set. The model was further validated in a separate training set, and its diagnostic performance was assessed by AUC.
Results
The Analysis of Differential Expression
Based on previous research methods, 130 significantly up regulated genes and 132 significantly down regulated genes were identified between normal and Polycystic Ovary Syndrome (PCOS) samples. Volcano plots (Figure 2A) and heatmap (Figure 2B) of the differentially expressed genes (DEGs) were used to distinguish DEGs.
 |
Figure 2 Heatmap and volcano map of DEGs. (A) Volcano plot of DEGs. (B) Heatmap of DEGs analysis. The color gradient of the heatmap transitions from red to blue, signifying gene expression levels from high to low in both regular and PCOS samples. At the top section of the heatmap, the blue band represents the normal sample, while the red band represents the PCOS sample. |
The Analysis of GO/KEGG and Genome Enrichment
GO Chord analysis was performed to enhance the GO terms of interest with quantitative molecular data. The results revealed that 12 DEGs exhibited enrichment in 5 GO terms, with myofibrils showing the highest number of DEGs (Figure 3A). To unveil the significant biological functions of the DEGs in PCOS. The results of the GO enrichment analysis (adjusted p-value cut-off = 0.05) indicated that myofilament sliding, myofibril, and actin-binding were the most notably enriched GO terms in BP, CC, and MF, respectively. The GO analysis was further visualized through the bubble and rectangular plots shown in Figure 3B and C.
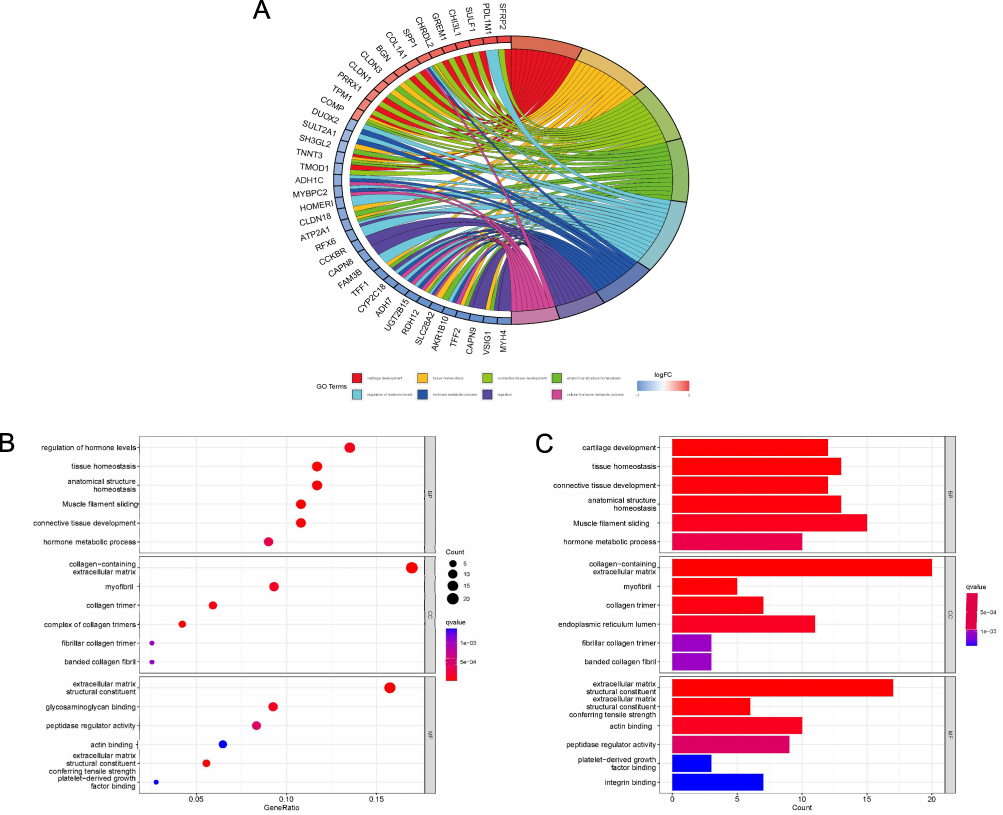 |
Figure 3 GO enrichment analysis. (A) GO Chord plot: relationship between DEGs and their associated GO terms. Colors indicated up- (red) or down-regulation (blue) genes. (B) GO function enrichment analysis bubble plots for DEGs. (C) GO function enrichment analysis bubble plot of DEG. |
The Analysis of Immune Cell Infiltration
To conduct immune cell infiltration analysis, profiles comprising gene expression data in human immune cells and sample-specific gene expression files were employed. Differential analysis of immune cells was carried out using the “vioplot” R package, and correlation analysis was conducted using the “corrplot” R package. Compared to normal samples, PCOS samples exhibited higher resting rates in naïve B cells, CD8+T cells, activated memory CD8+T cells, T follicular helper cells, macrophages M0, macrophages M1, and Macrophages M2 (p<0.05) (Figure 4A). Conversely, plasma cells and resting memory CD8+T cells in PCOS had lower resting rates (P<0.05) (Figure 4B).
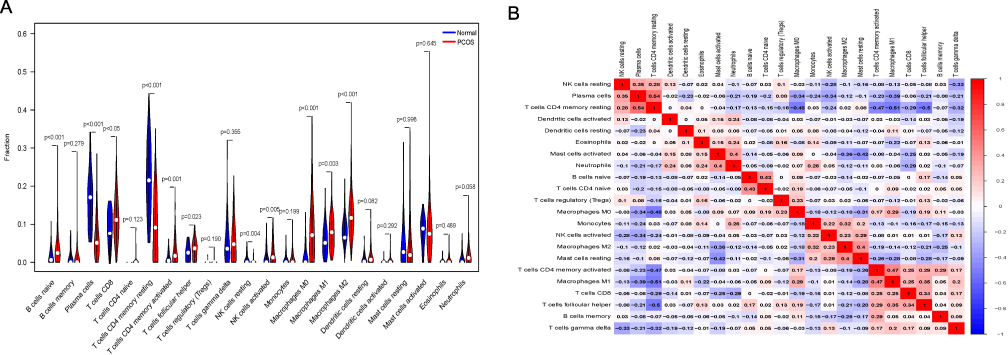 |
Figure 4 Immunocyte infiltration analysis. (A) Comparative assessment of immune cell distribution in both normal and PCOS samples. The horizontal axis displays the different immune cells, while the vertical axis represents their fraction. A P< 0.05 was deemed significant. (B) Evaluation of the interrelation between immune cells. Both the horizontal and vertical axes show the immune cells, with the numerical values denoting their correlations. A red hue signifies a positive correlation, whereas a blue shade points to a negative one. |
Key Genes Associated with Random Forest Diagnosis
A random forest analysis was conducted on 264 DEGs to identify significant genes. The number of decision trees was selected based on the cross-validation error, and 15 trees were chosen as the parameters for the final model, as it showed the minimum error of cross-validation (Figure 5A). Subsequently, a subset of significant genes was identified with importance scores greater than 2 (Figure 5B). Among them, BTBD9, TMOD1, PPM1B, CAMKK, MSL3, ALPK2, PAB23, RAB40C, AMPD3, and SPARC were the top 10 significant genes.
 |
Figure 5 Random forest screening of candidate PCOS specific genes. (A) Relationship between the count of decision trees and the cross-validation error. The horizontal axis displays the count of decision trees, while the vertical axis highlights the cross-validation error. (B) The X-axis showcases the importance score of a gene determined through the Gini coefficient method, while the Y-axis lists the gene’s name.3.5. The Artificial Neural Network Model Was Developed And Subsequently Validated. |
The Artificial Neural Network Model Was Developed and Subsequently Validated
Important genes identified by RF were used to create gene signatures marked as 0/1 based on their expression levels. Weights were then calculated for all genes to distinguish normal samples from PCOS samples better. Using these weights, a genetic weight-based ANN diagnostic model was developed (Figure 6). The AUC of this model was 0.965 within the training dataset (Figure 7A) and 0.829 within the validation dataset (Figure 7B), indicating that the model was effective in diagnosing PCOS and improving the accuracy of diagnosing PCOS in comparison to normal samples.
 |
Figure 6 Visualization of the artificial neural network diagnostic model. |
 |
Figure 7 ROC Curve assessing and demonstrating the ANN Diagnostic Model (A) Training dataset; (B) Validation dataset. |
Discussion
Integrating public database gene expression data with machine learning algorithms has provided us with a promising approach for biomarker discovery in cancer diagnosis.18,19 Among them, radiofrequency and artificial neural networks has been successfully applied in establishing stable diagnostic models for certain diseases, such as ulcerative colitis and abdominal aortic aneurysm.20,21 Previous studies have also explored the application of various machine learning algorithms to improve diagnostic methods for Polycystic Ovary Syndrome (PCOS).22–26 Including the use of appropriate algorithms for clinical data.23 Additionally, a previous algorithm was constructed to run the Polycystic Ovary Syndrome Database (PCOSDB; http://www.pcosdb.net/)27 and the Polycystic Ovary Syndrome Knowledge Base (PCOSKB; http://pcoskb.bicnirrh.res.in).28 Unlike prior research, our objective in this study was to craft a diagnostic framework by harnessing genomic transcription profiles from the most extensive sample set available in the GEO database. The team employed both RF and ANN methodologies to pinpoint essential classification genes and determine their respective weights.
The top 10 pivotal genes identified by the RF model for categorization of DEGs were identified, with BTBD9, TMOD1, PPM1B, CAMKK, MSL3 and ALPK2 upregulated in normal samples. At the same time, PAB23, RAB40C, AMPD3 and SPARC were downregulated in PCOS samples. An ANN diagnostic model was developed and assessed by AUC analysis, achieving an AUC score of 0.965. The validation set also demonstrated high diagnostic power, with an AUC score of 0.829.
This study identifies the top 10 core genes for classification of DEGs in PCOS using the MeanReductionGini. In other studies, these 10 genes have been previously identified as critical genes for PCOS, providing further support for their importance in this disease. The study also highlights the advantages of RNA-seq technology over microarray technology29 in detecting novel transcripts, as it has a broader dynamic spectrum, increased specificity, and enhanced sensitivity. The novelty of the diagnostic model in this study comprehensively considering of genes and their weights that are essential for classification. To assess the marker genes for other datasets in the database, marker genes were assessed for other datasets in database. AUC scoring results indicated that the model not only had better performance but also exhibited higher sensitivity in RNA-seq data, further supporting the robustness of the model.
Nonetheless, there are several constraints to this research. First, the number of samples was relatively small, and although 10 significant PCOS-related genes were validated, additional verification in more expansive groups is required. Furthermore, while the ANN diagnostic models drew from datasets in the GEO database, they still require validation through lab experiments and real-world clinical application.
Conclusion
This research successfully identified ten genetic biomarkers associated with PCOS and the established an ANN Owing to these biomarkers, which exhibited satisfactory diagnostic performance for PCOS. These findings provide a feasible Foundation for early detection of PCOS and identify a potential gene target for clinical diagnosis and treatment of PCOS. Our research results revealed a novel combination of genes for PCOS, which provided new insights for early clinical diagnosis or individualized treatment of the disease.
Abbreviations
PCOS, Polycystic ovary syndrome; ANN, Artificial Neural Networks; RF, Random Forest; GEO, Gene Expression Omnibus; DEGs, Differentially expressed genes; GO, Gene Ontology; KEGG, Kyoto Encyclopedia of Genes and Genomes; AUC, The area under the curve; NIH, National Institutes of Health; ESHRE, European Society for Human Reproduction and Embryology; ASRM, American Society for Reproductive Medicine; AES, Androgen Excess Society; RNA, Ribonucleic Acid; MF, Molecular Function; CC, Cellular Component; BP, Biological Process.
Data Sharing Statement
The datasets produced in this study can be found in the Gene Expression Omnibus (GEO) repository, accessible at the following web links:
Dataset GSE6789: [Link to GEO repository: https://www.ncbi.nlm.nih.gov/geo/query/acc.cgi?acc=GSE6789]
Dataset GSE84958: [Link to GEO repository: https://www.ncbi.nlm.nih.gov/geo/query/acc.cgi?acc=GSE84958]
Dataset GSE43264: [Link to GEO repository: https://www.ncbi.nlm.nih.gov/geo/query/acc.cgi?acc=GSE43264].
Ethics and Dissemination
Gene Expression Omnibus (GEO) is a public database supported by the National Center for Biotechnology Information (NCBI) at the National Library of Medicine (NLM) of United States. In accordance with the Department of Health and Human Services of United States regulations outlined in 45 CFR 46.101, research using certain publicly available data sets does not involve “human subjects”. The data contained within these specific data sets are neither identifiable nor private and thus do not meet the federal definition of “human subject” as defined in 45 CFR 46.102. This research adheres to these criteria, as the data from GEO are publicly accessible and de-identified. Therefore, this research project does not need to be reviewed and approved by the Institutional Review Board, (IRB).
Funding
This study is funded by the Belt and Road Program on International Cooperation of China Academy of Chinese Medical Sciences (GH201802).
Disclosure
The authors declare that they have no competing interests.
References
1. Norman RJ, Dewailly D, Legro RS, et al. Polycystic ovary syndrome. Lancet. 2007;370(9588):685–697. doi:10.1016/S0140-6736(07)61345-2
2. ZawadzkI J. Diagnostic criteria for polycystic ovary syndrome (a rational approach). Polycystic Ovary Synd. 1992;1992:377–384.
3. Rotterdam ESHRE/ASRM‐Sponsored PCOS Consensus Workshop Group. Revised 2003 consensus on diagnostic criteria and long-term health risks related to polycystic ovary syndrome (PCOS). Hum Reprod. 2004;19(1):41–47. doi:10.1093/humrep/deh098
4. ESHRE TR, ASRM-Sponsored PCOS Consensus Workshop Group. Revised 2003 consensus on diagnostic criteria and long-term health risks related to polycystic ovary syndrome. Fertil Steril. 2004;81(1):19–25. doi:10.1016/j.fertnstert.2003.10.004
5. Azziz R, Carmina E, Dewailly D, et al. The Androgen Excess and PCOS Society criteria for the polycystic ovary syndrome: the complete task force report. Fertil Steril. 2009;91(2):456–488. doi:10.1016/j.fertnstert.2008.06.035
6. Fauser BCJM, Tarlatzis BC, Rebar RW, et al. Consensus on women’s health aspects of polycystic ovary syndrome (PCOS): the Amsterdam ESHRE/ASRM-Sponsored 3rd PCOS consensus workshop group. Fertil Steril. 2012;97:1.
7. Jones MR, Goodarzi MO. Genetic determinants of polycystic ovary syndrome: progress and future directions. Fertil Steril. 2016;106(1):25–32. doi:10.1016/j.fertnstert.2016.04.040
8. Xie -N-N, Wang -F-F, Zhou J, et al. Establishment and analysis of a combined diagnostic model of polycystic ovary syndrome with random forest and artificial neural network. Biomed Res Int. 2020;2020:2613091. doi:10.1155/2020/2613091
9. Kursa MB. Robustness of Random Forest-based gene selection methods. BMC Bioinf. 2014;15:8. doi:10.1186/1471-2105-15-8
10. Cai Z, Xu D, Zhang Q, et al. Classification of lung cancer using ensemble-based feature selection and machine learning methods. Mol Biosyst. 2015;11(3):791–800. doi:10.1039/C4MB00659C
11. Chen Y-C, Ke W-C, Chiu H-W. Risk classification of cancer survival using ANN with gene expression data from multiple laboratories. Comput Biol Med. 2014;48:1–7. doi:10.1016/j.compbiomed.2014.02.006
12. Chen S, Liu P, Zhao L, et al. A novel cuproptosis-related prognostic lncRNA signature for predicting immune and drug therapy response in hepatocellular carcinoma. Front Immunol. 2022;13:954653. doi:10.3389/fimmu.2022.954653
13. Chen S, Ben X, Guo L, et al. Identification of lncRNAs based on different patterns of immune infiltration in gastric cancer. J Gastrointest Oncol. 2022;13(1):102–116. doi:10.21037/jgo-21-833
14. Li M, Li X, Chen S, et al. IPO5 mediates EMT and promotes esophageal cancer development through the RAS-ERK Pathway. Oxid Med Cell Longev. 2022;2022:6570879. doi:10.1155/2022/6570879
15. Chen S, Li Y, Zhu Y, et al. SERPINE1 overexpression promotes malignant progression and poor prognosis of gastric cancer. J Oncol. 2022;2022:2647825.
16. Chen S, Li X, Zhang J, et al. Six mutator-derived lncRNA signature of genome instability for predicting the clinical outcome of colon cancer. J Gastrointest Oncol. 2021;12(5):2157–2171. doi:10.21037/jgo-21-494
17. Szlęk J, Pacławski A, Lau R, et al. Empirical search for factors affecting mean particle size of PLGA microspheres containing macromolecular drugs. Comput Methods Programs Biomed. 2016;134:137–147. doi:10.1016/j.cmpb.2016.07.006
18. Wang D, Li J-R, Zhang Y-H, et al. Identification of differentially expressed genes between original breast cancer and xenograft using machine learning algorithms. Genes. 2018;9(3). doi:10.3390/genes9030155
19. Tabl AA, Alkhateeb A, Elmaraghy W, et al. A machine learning approach for identifying gene biomarkers guiding the treatment of breast cancer. Front Genet. 2019;10:256. doi:10.3389/fgene.2019.00256
20. Li H, Lai L, Shen J. Development of a susceptibility gene based novel predictive model for the diagnosis of ulcerative colitis using random forest and artificial neural network. Aging. 2020;12(20):20471–20482. doi:10.18632/aging.103861
21. Duan Y, Xie E, Liu C, et al. Establishment of a combined diagnostic model of abdominal aortic aneurysm with random forest and artificial neural network. Biomed Res Int. 2022;2022:7173972. doi:10.1155/2022/7173972
22. Meena K, Manimekalai M, Rethinavalli S. A novel framework for filtering the PCOS attributes using data mining techniques. Int J Eng Res. 2015;4(1):702–706.
23. Vikas B, Anuhya B, Bhargav KS, et al. Application of the apriori algorithm for prediction of Polycystic Ovarian Syndrome (PCOS). Inform Syst Des. 2018;2018:934–944.
24. Zhang X-Z, Pang Y-L, Wang X, et al. Computational characterization and identification of human polycystic ovary syndrome genes. Sci Rep. 2018;8(1):12949. doi:10.1038/s41598-018-31110-4
25. Cheng JJ, Mahalingaiah S. Data mining polycystic ovary morphology in electronic medical record ultrasound reports. Fertil Res Pract. 2019;5:13. doi:10.1186/s40738-019-0067-7
26. C-H H, Chang C-M, H-Y L, et al. Dysregulated immunological and metabolic functions discovered by a polygenic integrative analysis for PCOS. Reprod Biomed Online. 2020;40(1):160–167. doi:10.1016/j.rbmo.2019.09.011
27. Jesintha Mary M, Vetrivel U, Munuswamy D, et al. PCOSDB: polyCystic ovary syndrome database for manually curated disease associated genes. Bioinformation. 2016;12(1):4–8. doi:10.6026/97320630012004
28. Joseph S, Barai R Shankar, Bhujbalrao R and Idicula-Thomas S. (2016). PCOSKB: A KnowledgeBase on genes, diseases, ontology terms and biochemical pathways associated with PolyCystic Ovary Syndrome. Nucleic Acids Res, 44(D1), D1032–D1035. 10.1093/nar/gkv1146
29. Wang Z, Gerstein M, Snyder M. RNA-Seq: a revolutionary tool for transcriptomics. Nat Rev Genet. 2009;10(1):57–63. doi:10.1038/nrg2484
 © 2023 The Author(s). This work is published and licensed by Dove Medical Press Limited. The
full terms of this license are available at https://www.dovepress.com/terms
and incorporate the Creative Commons Attribution
- Non Commercial (unported, 3.0) License.
By accessing the work you hereby accept the Terms. Non-commercial uses of the work are permitted
without any further permission from Dove Medical Press Limited, provided the work is properly
attributed. For permission for commercial use of this work, please see paragraphs 4.2 and 5 of our Terms.
© 2023 The Author(s). This work is published and licensed by Dove Medical Press Limited. The
full terms of this license are available at https://www.dovepress.com/terms
and incorporate the Creative Commons Attribution
- Non Commercial (unported, 3.0) License.
By accessing the work you hereby accept the Terms. Non-commercial uses of the work are permitted
without any further permission from Dove Medical Press Limited, provided the work is properly
attributed. For permission for commercial use of this work, please see paragraphs 4.2 and 5 of our Terms.