Back to Journals » Journal of Inflammation Research » Volume 14
Erythroferrone Expression in Anemic Rheumatoid Arthritis Patients: Is It Disordered Iron Trafficking or Disease Activity?
Authors Youssef SR ![]() , Hassan EH, Morad CS
, Hassan EH, Morad CS ![]() , Elazab Elged AA
, Elazab Elged AA ![]() , El-Gamal RA
, El-Gamal RA ![]()
Received 1 July 2021
Accepted for publication 19 August 2021
Published 7 September 2021 Volume 2021:14 Pages 4445—4455
DOI https://doi.org/10.2147/JIR.S327465
Checked for plagiarism Yes
Review by Single anonymous peer review
Peer reviewer comments 2
Editor who approved publication: Professor Ning Quan
Soha R Youssef,1 Esraa H Hassan,2 Caroline S Morad,3 Adel A Elazab Elged,1,4 Rasha A El-Gamal1
1Clinical Pathology Department, Ain Shams University, Cairo, Egypt; 2Regional Blood Transfusion Center, Cairo, Egypt; 3Internal Medicine and Rheumatology Department, Ain Shams University, Cairo, Egypt; 4Galala University, Suez, Egypt
Correspondence: Rasha A El-Gamal
Faculty of Medicine, Ain Shams University, Abbasseya, Cairo, Egypt
Tel +20 1145405005
Email [email protected]
Purpose: Erythroferrone (ERFE) is well acknowledged for its inhibitory function on hepcidin synthesis in the liver during stress erythropoiesis, thereby ensuring sufficient iron supply to bone marrow erythroblasts. Hepcidin plays an indispensable role in the pathogenesis of anemia of chronic disease (ACD). Thus, ERFE was suggested to protect against ACD in various diseases. Rheumatoid arthritis (RA) is commonly involved with ACD and high hepcidin levels, with a further increase of the latter in active states. The present study is a case-control study that aimed to determine the pattern of ERFE expression in RA patients with concomitant ACD and study its relationship with hepcidin, erythropoietin (EPO) and disease activity.
Patients and Methods: Fifty-five RA patients with ACD were categorized into active and inactive RA using the disease activity score (DAS28); 15 healthy subjects were included as control subjects. ERFE was measured for patients and control subjects using quantitative real-time polymerase chain reaction, in addition to testing for CBC, ESR, CRP, iron profile parameters and hepcidin. EPO was assessed for patients of both active and inactive RA groups.
Results: ERFE and hepcidin showed the highest levels in active RA; ERFE values were similar in control subjects and inactive RA patients, while hepcidin was significantly higher in inactive RA than control subjects. Patients with high ERFE levels had higher RBC, Hct, MCV, hepcidin and EPO levels. Stepwise regression analysis has identified DAS28 and disease duration as the best predictors of ERFE values, whereas ERFE and hepcidin were independent predictors of disease activity.
Conclusion: We introduce ERFE as a novel marker of RA activity. Although the inhibitory effect of ERFE on hepcidin is not evident, our results still indicate that ERFE may have a beneficial erythropoietic effect in the context of ACD in RA disease activity.
Keywords: erythroferrone, rheumatoid arthritis, anemia of chronic disease, hepcidin, iron, DAS28
Introduction
Erythroferrone (ERFE) plays a central role in the release of stored iron during stress erythropoiesis, being an effective inhibitor of hepcidin synthesis by hepatocytes.1 ERFE is a member of the tumor necrosis factor- α (TNF-α) family, encoded by ERFE (FAM132B) gene, and is synthesized by erythroblasts upon erythropoietin (EPO) stimulation.2 When ERFE is released into the circulation, it sequesters BMP6‒a potent inducer of hepcidin transcription‒resulting in the inactivation of hepcidin signaling.3,4 The ensuing reduced hepcidin level results in restoration of normal intestinal iron absorption and iron efflux from mature iron-metabolizing macrophages with an accordant increased iron supply to bone marrow erythroblasts.5 A different aspect of the ERFE role in human diseases lies in its alternative source of synthesis, namely skeletal muscle (formerly called Myonectin).6 Muscle ERFE is a myokine that is secreted in response to physical exercise and nutrients, lipids and glucose, through unknown myocyte mediators that may include the Akt/PI3K pathway.7 There is evidence for the role of muscle ERFE in lipid and glucose metabolism.1
Disturbance of iron transport, by the hepatic hepcidin, is a leading feature in anemia of inflammation/chronic disease (ACD).8,9 In inflammatory or chronic diseases, immune cells release inflammatory cytokines, among which IL6 is considered to be the necessary and sufficient cytokine for hepcidin increase in inflammation.10 Rheumatoid arthritis (RA) is one of the chronic inflammatory diseases in which prolonged immune activation and cytokine synthesis are characteristic hallmarks and are largely responsible for the development of ACD.9,11 An added IL-6-driven increase in serum hepcidin was also reported in the active states of the disease.12 Hence, these high-hepcidin conditions in RA, whether in quiescent or active states, provide potentially suitable targets to be acted upon by ERFE.
A protective effect of ERFE against ACD was initially suggested in a mouse model in 2014 by Kautz et al13 and was confirmed in two other studies on patients with chronic kidney diseases (CKD).13–15 The ERFE-hepcidin-iron scenario in these studies was largely dependent on the EPO administered, whether as a part the validation process of the study13 or as a component of the treatment protocol.14,15 In this respect, the relationship between ERFE and the generally mild anemia of RA (where EPO is not a consistent treatment choice) has not been previously investigated.
In the present study, we attempted to define the pattern of ERFE expression in RA patients who have concomitant ACD. To provide more perception into the impact of ERFE expression, we studied the relationship between ERFE levels and iron parameters, hepcidin and EPO in the context of RA classification into active and inactive disease states.
Patients and Methods
Study Population
This is a case-control study involving 55 RA patients (fulfilling the EULAR/ACR criteria of 2010)16 with ACD, presenting in the Rheumatology and Internal Medicine outpatient clinic of Ain-Shams University Hospital. Fifteen sex- and age- matched healthy control subjects were also included. Patients who had iron deficiency as a sole cause of anemia were excluded from the study; they were identified by having ferritin levels less than 30 μg/L.9,17 Other exclusion conditions comprised red cell macrocytosis, concurrent renal, hepatic, endocrine, hematological, or malignant disease, acute blood loss, acute or chronic infections, and receiving treatment for anemia in the last 3 months that may influence iron parameters (eg, blood transfusion or iron supplementation). To avoid diurnal variation effect of iron, samples were collected from non-fasting patients in the morning (from 9:00–11:00 am). In patients who presented to the clinic with symptoms and signs of active disease, samples were collected before commencing treatment of the active state.
Full medical history and thorough clinical examination were done for all patients. RA disease activity was assessed using 28 tender and swollen joint count disease activity score (DAS28 CRP score).18 Patients were divided according to their DAS28 into severe, moderate, and remission disease activity (DAS >5.1, 3.2–5.1 and <2.6, respectively). They were further categorized into active and inactive RA. We used the 3.2 limit of DAS28 to characterize disease activity, ie, above this limit the patient was categorized as having active RA. Functional assessment of RA patients was done using a health assessment questionnaire (HAQ).19
RA patients received disease modifying antirheumatic drugs (DMARDs) to control disease activity. The majority of patients received methotrexate (MTX) (12.5–25mg) once weekly injection. Patients not tolerating MTX received leflunomide 20mg daily. Patients also received hydroxychloroquine 200mg daily. Steroids were given in small doses with a maximum of 10mg daily for short duration as bridge therapy. In addition, patients received calcium, vitamin D and folic acid. It is worth mentioning that one of the intents of this study was to conduct clinical follow-up of RA patients after treatment to assess the control of disease activity. However, this follow-up is hindered by the global situation of the COVID-19 pandemic.
A verbal informed consent was taken from all subjects participating in this study. The verbal informed consent was approved by the local research ethical committee of Ain Shams University (in accordance with the Helsinki Declaration of 1975).
Methods
Sera were separated by centrifugation at 1000×g for 15 min, and separated serum was frozen to −70° C for storage, and later thawed and analyzed for hepcidin and iron parameters in a single batch. Serum levels of hepcidin were estimated using a Human Hepcidin Quantikine enzyme linked immunosorbent assay (ELISA) kit (R&D Systems, MN, USA) according to the manufacturer’s protocol. Intra-assay precision was 4.3%, inter-assay precision was 11%, and analytical sensitivity was 0.0017 ng/mL. Serum ferritin was assayed using the ADVIA Centaur XPT (Siemens, Germany), employing direct chemiluminescent two-site sandwich immunoassay. Iron and total iron-binding capacity (TIBC) levels were measured using the DxC 600 Synchron Clinical Systems (Beckman Coulter, Inc., Brea, CA, USA). Transferrin saturation (TS%) was mathematically calculated 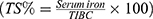 . C-reactive protein (CRP) was estimated semi quantitatively on freshly obtained sera by latex agglutination and results were included in the DAS28 score.
EDTA anticoagulated samples were tested for complete blood count (CBC) (XN-1000 automated analyzer, Sysmex, Kobe, Japan). Erythrocyte sedimentation rate (ESR) was estimated using Westergren tube inserted into the ESR vacuum tube (contains 3.2% sodium citrate anticoagulant).
Serum EPO was measured for 25 patients only using the Advia Centaur XPT (Siemens, Germany) in a one-step direct immunoassay using chemiluminescent technology. The assay utilizes an acridinium ester-labeled monoclonal mouse anti-EPO antibody in the Lite reagent. The solid phase consists of anti-EPO monoclonal antibody-coated paramagnetic microparticles.
Measurement of ERFE
EDTA-anticoagulated samples were transported on ice and extraction of RNA was performed at the same day (within 18 hours maximum) using miRNeasy® Kit (QIAGEN®, MD, USA). The extracted RNA molecules were applied to the RNeasyMinElute spin column, where the total RNA was bound to the membrane while contaminants were efficiently washed away. The extracted mRNA was immediately frozen at −80°C. When samples were thawed, Real-Time two-step RT-PCR was performed on the extracted RNA using Qiagen miScript II RT kit (Qiagen, USA) run on Thermo Hybaid PCR express (Thermo Scientific, USA), and TaqMan Gene expression primer assay (QuantiFast®Probe Assay, Applied Biosystems, CA, USA) using Real-Time PCR instrument (7500 Fast Real-Time PCR system, Applied Biosystems, Foster City, CA, USA). Glyceraldehyde-3-phosphate dehydrogenase (GAPDH) was used as a reference gene to normalize the RNA expression data. The relative expression of ERFE (FAM132B) was analysed using the double delta threshold cycle (∆∆CT) method.20
∆∆CT: ∆CT (test samples) - ∆CT (calibrator samples)
Where:
∆CT (test samples) = CT (ERFE gene in test) - CT (reference gene in test)
∆CT (calibrator samples) = CT (ERFE gene in calibrator) - CT (reference gene in calibrator)
The final step was to calculate the relative quantification (RQ). It expresses the amount of ERFE gene expression, normalized to the endogenous reference and relative to the calibrator:
RQ of ERFE gene = 2 –∆∆CT
Statistical Analysis
Data were analysed using Statistical Package for Social Science (SPSS 26). Normality of distribution was evaluated using the Shapiro–Wilk test. Student T Test was used to assess the statistical significance of the difference of a parametric variable between two study groups. Mann Whitney Test (U-test) was used to assess the statistical significance of the difference of a non-parametric variable between two study groups. A Fisher’s exact test was used to compare categorical variables. One-way ANOVA was used to compare groups. Post hoc analysis was performed using Tukey’s multiple comparison tests. Pearson correlation analysis was employed to assess the strength of association between two quantitative variables. The r value defines the magnitude and direction (positive or negative) of the linear relationship between two variables. The receiver operating characteristic (ROC) curve was used to assess the overall diagnostic performance for ERFE in terms of disease activity. Stepwise regression analysis was used to determine the best independent predictors of ERFE and DAS-28 values. Statistical significance was defined as a P < 0.05.
Results
The patients in our study included 43 females and 12 males. Parallel to established gender-related differences reported in the literature, we found significant differences in CBC and iron determinants between the two groups (lower levels of red blood cell (RBC) count, hemoglobin, iron, and TS%, and higher levels of TIBC were found among female patients)21–23 (data not shown). In contrast, iron-control parameters (ERFE, hepcidin) and DAS28 values did not show gender-related differences (Table 1).
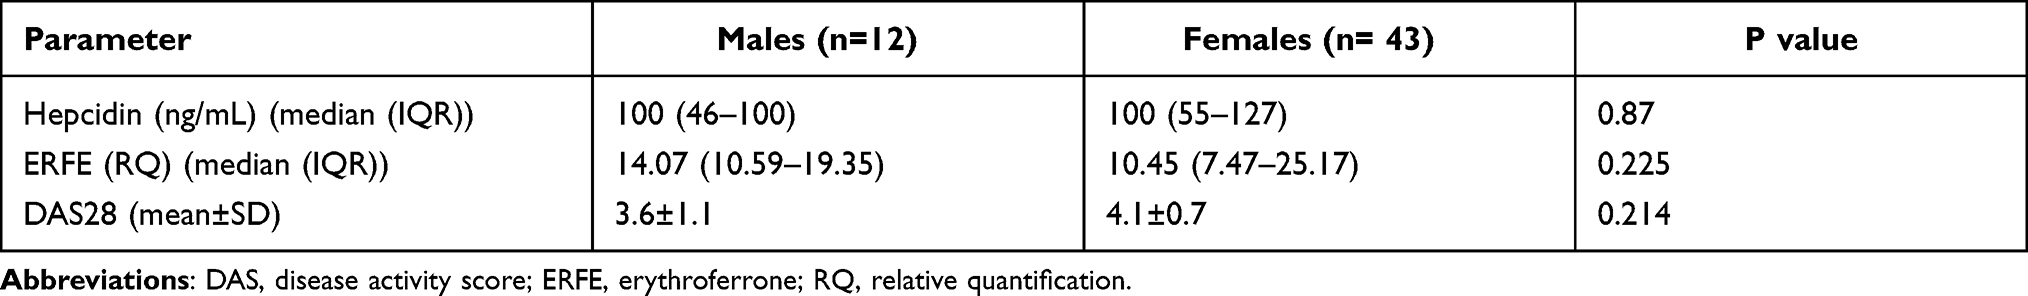 |
Table 1 Comparative Analysis of Hepcidin, ERFE and DAS28 in Male & Female RA Patients |
Comparison of Red Cell Indices in the Study Groups
Healthy control subjects showed higher values of hemoglobin, hematocrit (Hct), mean corpuscular volume (MCV), and mean corpuscular hemoglobin (MCH), and lower levels of red cell distribution width (RDW), when compared to each of the RA activity-based groups. On the other hand, patients having active RA had higher RBC counts, Hct and MCV values when compared to patients with inactive disease (Table 2).
 |
Table 2 Comparative Analysis of Laboratory Test Results Among the Study Groups |
Comparison of Erythroferrone–Hepcidin–Iron Axis Parameters in the Study Groups
ERFE was expressed at significantly higher levels in the active RA patients compared with either healthy subjects or inactive RA patients (p <0.001). No difference was noted in ERFE values in the latter two groups. Hepcidin was significantly higher in RA patients compared with healthy control subjects. Moreover, significantly elevated hepcidin was related to RA activity.
Of the iron-related parameters, serum iron and TS% levels of the control group were significantly higher than those of RA patients and showed similar values in active and inactive RA patients. TIBC and ferritin showed no significant difference between any of the study groups (Table 2).
Comparison of CRP and ESR in the Study Groups
Active RA patients had significantly higher CRP levels than inactive RA as well as healthy control subjects, with similar values of CRP in the latter two groups. ESR values were significantly lower in healthy subjects than that of either RA groups, with no difference in its levels between the two RA groups (Table 2). When categorizing patients based on CRP levels, only ERFE showed significant differences between different CRP levels, with significantly higher ERFE values found in patients with elevated CRP (ie, 48 mg/L) (Table 3).
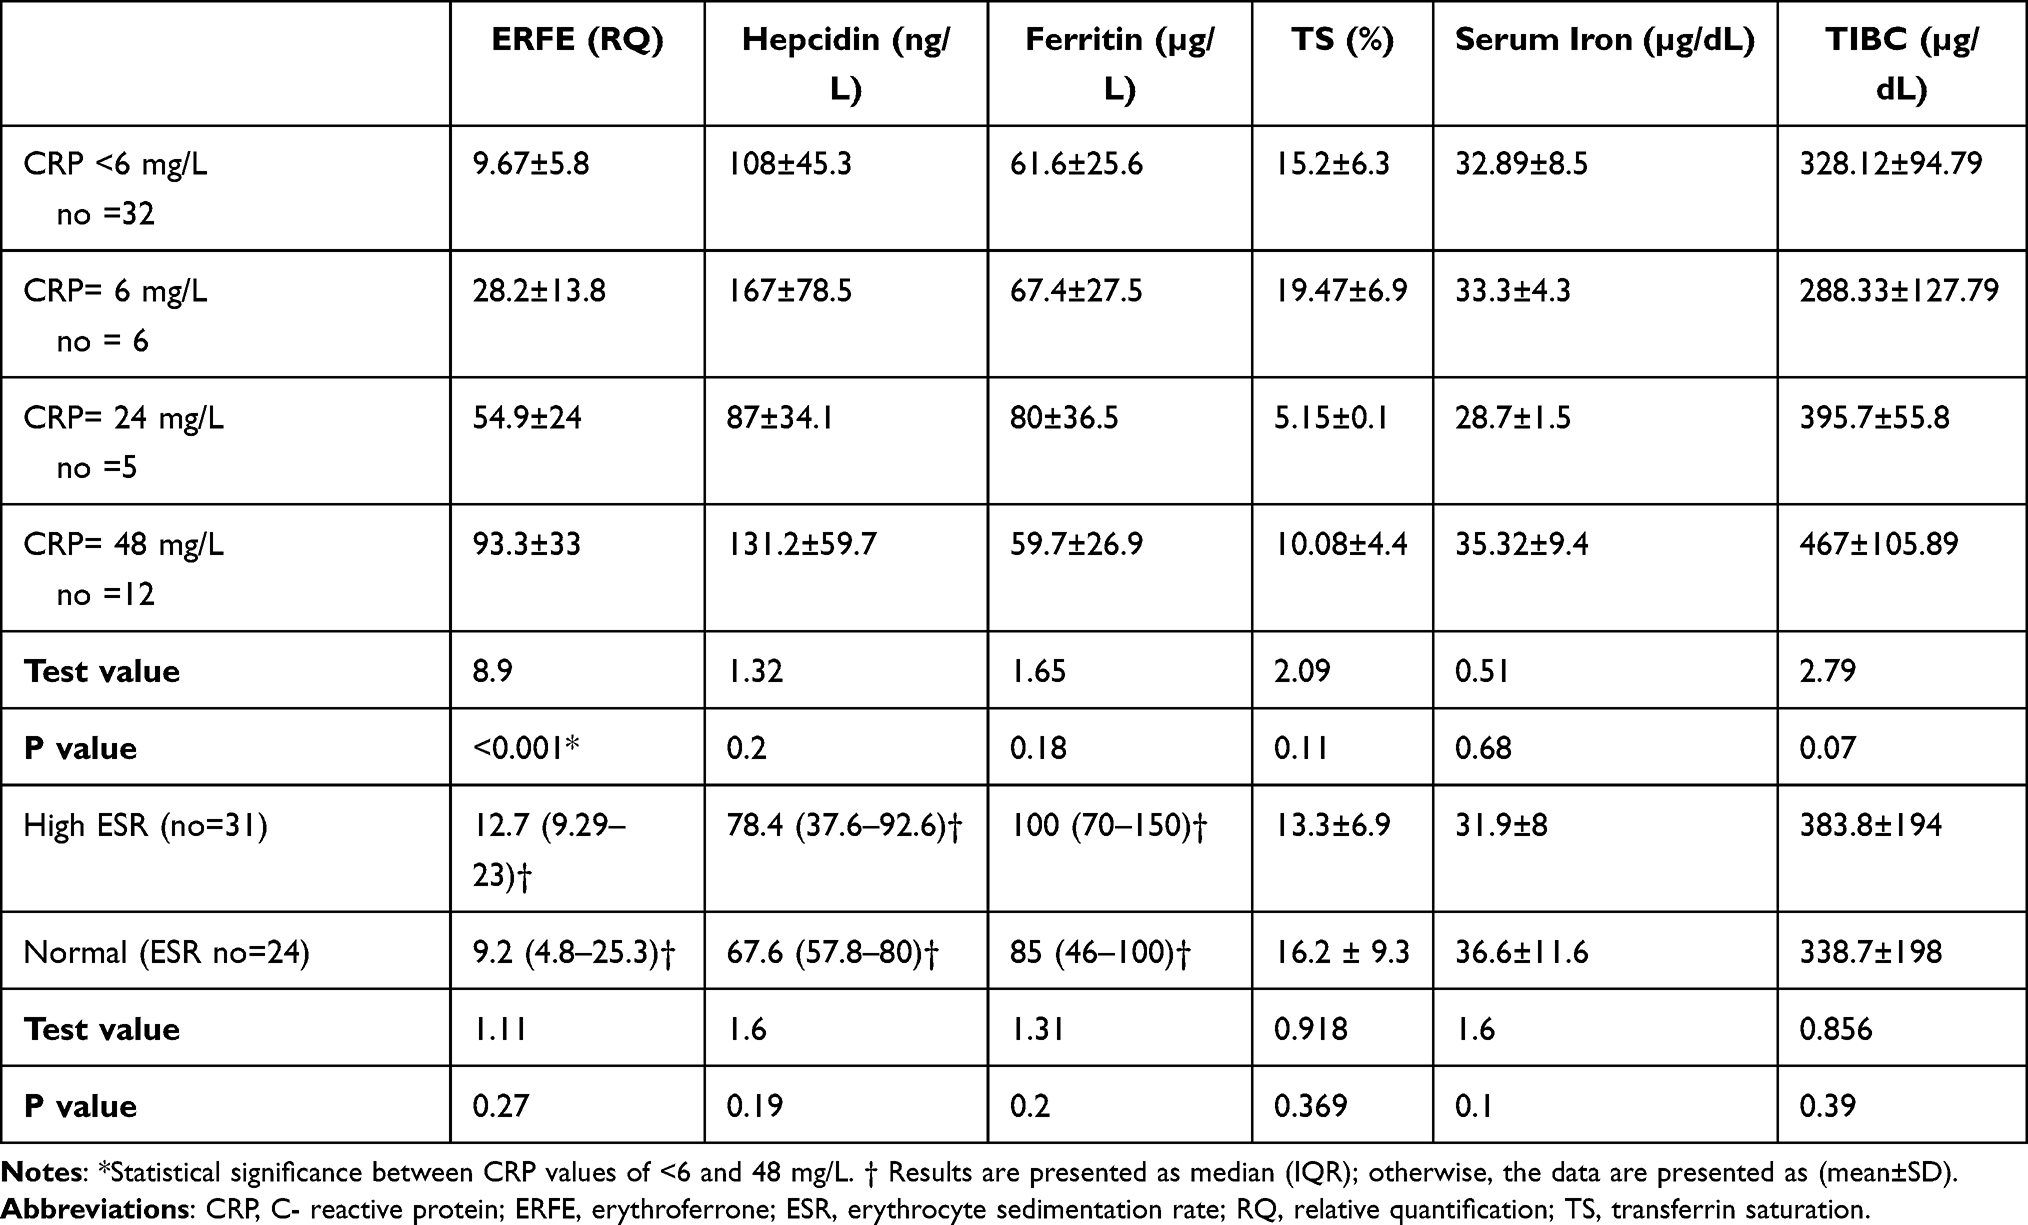 |
Table 3 Results of ERFE and Iron-Control Parameters Against CRP-Semiquantitative Results and ESR Results |
Diagnostic Accuracy and Performance of ERFE in Relation to Disease Activity
We employed the DAS28 values of RA patients (as a gold standard of activity) to assess the accuracy of ERFE gene expression in the diagnosis of active RA. The area under the curve of ERFE as a diagnostic test was 0.896. The selected cut-off point of 9.377 RQ to confirm the active state showed the following diagnostic criteria: sensitivity 94.1% (95% CI: 81.3% to 99.3%), specificity 100% (95% CI: 83.9% to 100%), positive predictive value 100%, negative predictive value 91.3%, overall diagnostic accuracy 96.4% (95% CI: 87.5% to 99.6%) (Figure 1).
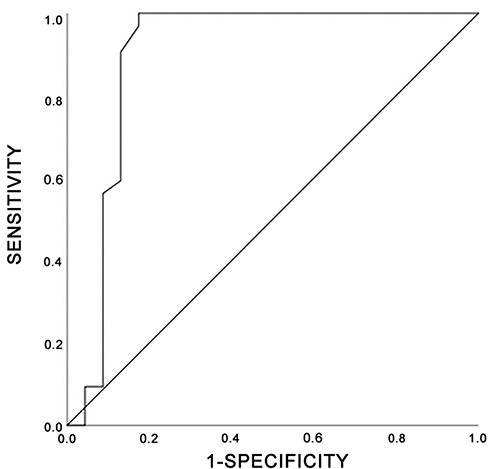 |
Figure 1 ROC curve to demonstrate the performance level of ERFE in RA disease activity. Abbreviations: ERFE, erythroferrone; RA, rheumatoid arthritis; ROC, receiver operating characteristic. |
To further evaluate the impact of ERFE levels on other parameters, we compared patients’ data with ERFE levels above and below the 9.38 cut-off value. Patients with higher-than-threshold ERFE levels had higher RBC, MCV, Hct, hepcidin and EPO levels (p<0.05) (Table 4).
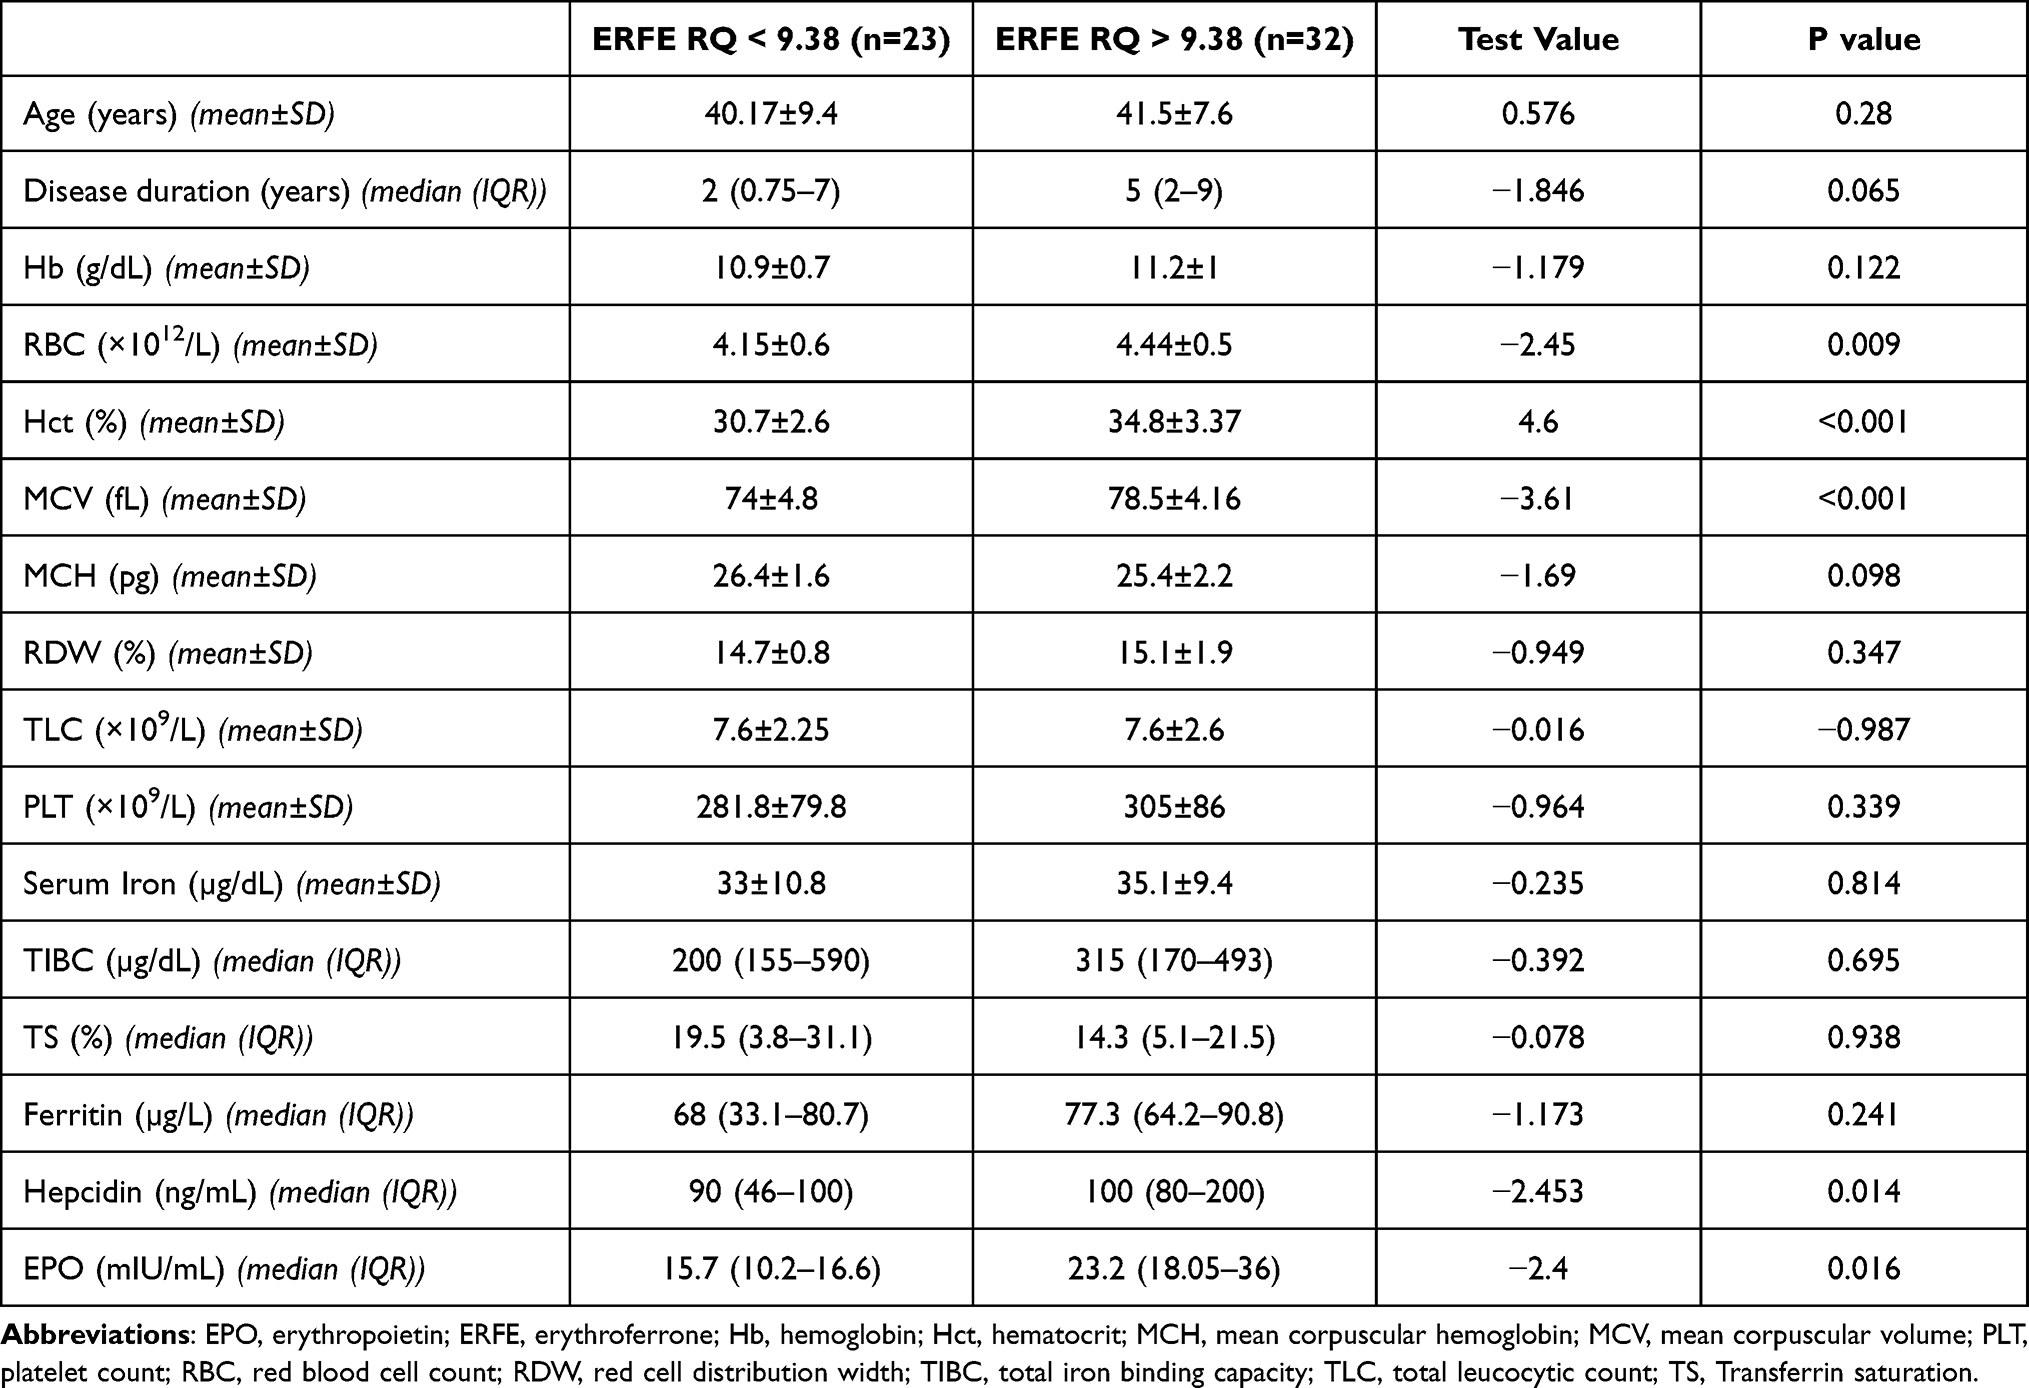 |
Table 4 Laboratory Parameters in Patients with High and Low ERFE |
Correlation Studies
A comprehensive correlation analysis was done between all studied variables. TS% was positively correlated to Hb, Hct, RBC, and MCV values (r= 0.49, 0.45, 0.289, 0.319, respectively). In addition, a significant positive correlation was detected between each two of the three parameters: ERFE values, DAS28 values and RBC counts (r values ranged from 0.271 to 0.536).
Stepwise regression analysis was performed to determine the best predictors of ERFE and DAS28 values. DAS28 values and disease duration were independent predictors of ERFE, while ERFE and hepcidin values were independent predictors of DAS28 (Tables 5 and 6).
 |
Table 5 Stepwise Multiple Regression Analysis for Determining Independent Predictors of ERFE Level |
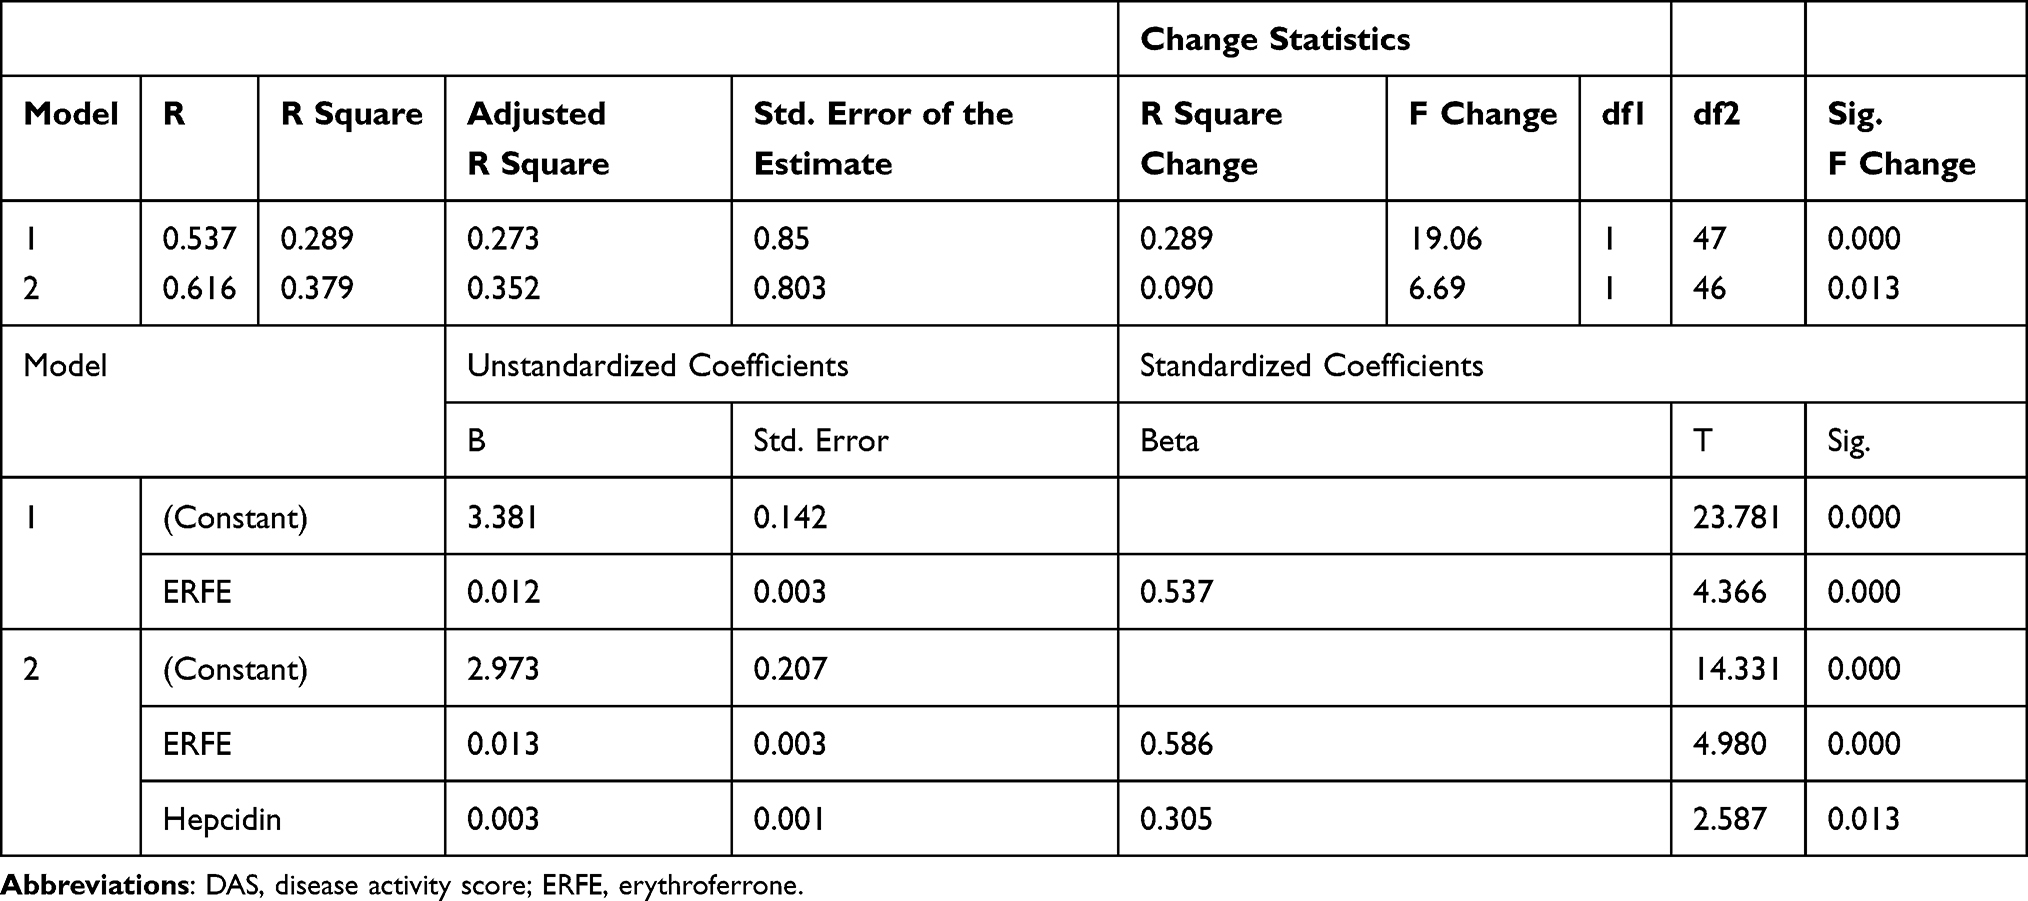 |
Table 6 Stepwise Multiple Regression Analysis for Determining Independent Predictors of DAS28 Level |
Discussion
In this study, ERFE level has significantly correlated with the activity status of RA disease. There is no information in literature about this hormone in RA. The significance of ERFE in various diseases is not limited to its role in anemia, because ERFE is also produced in muscle.6 Hence, at the start of our study, the production of ERFE, or its specific role in RA in respect to coexisting anemia or activation status, was unclear. Therefore, we investigated the relationship between ERFE levels and iron or hematopoietic determinants, as well as activity-related parameters, to comprehend its role in anemic RA patients.
The rapid hepcidin production in inflammation allocates it as a hallmark in the pathophysiological diagnosis of ACD.8 In our study, the difference in hepcidin values between healthy control subjects and anemic RA patients supports the inflammatory element of the RA-associated anemia.12,24 Hepcidin median was highest in active RA and lowest in control subjects, with significantly different intermediate levels in inactive RA patients. In a study by Sahebari et al (2018), the authors found no relation between hepcidin levels and RA activity; they categorized RA activity using the 5.1 DAS28 cutoff limit.25 Another study reported a significant increase of serum hepcidin with the active status (DAS28>3.2 was used to define disease activity).12 The results of the latter study are similar to our results. However, it should be noted that in the study design of the two studies, RA patients either had ACD or did not have anemia. Therefore, unlike our study, the comparison of hepcidin levels was based on activity status irrespective to the presence of anemia.
Other well-characterized features of ACD9,17 were clearly demonstrated such as the significantly lower serum iron and TS% in RA patients compared to their levels in healthy controls. On the other hand, ferritin showed no significant difference between the two groups as it only exceeded the upper normal levels in 3/55 patients (5.5%). Similar data regarding ferritin were reported in relevant studies.12,26,27
Levels of ERFE expressed by patients with active RA were significantly higher than those of patients with inactive RA and healthy controls. Importantly, the latter two groups had similar ERFE levels. ERFE also showed increased expression levels with high CRP values. Furthermore, in an analysis adjusting for confounding risk factors, ERFE has positively correlated with DAS28 and disease duration. Reciprocally, the same analysis has revealed that ERFE and hepcidin are the only variables that could independently indicate the presence of an activity status (based on DAS28 values).
Accordingly, a cut-off of 9.38 was assigned for ERFE RQ values to effectively distinguish the active state of RA. Patients with ERFE levels above this cut-off exhibited significantly high RBC, Hct, MCV, EPO and hepcidin. The latter finding has undermined the supposed inverse relationship of ERFE with hepcidin. Hepcidin-inhibitory effect exerted by ERFE might have been counterbalanced by other hepcidin determinants. An important and direct determinant of hepcidin is the state of inflammation that coexists with particularly high levels of IL-6. This cytokine plays a critical role in both the pathogenesis of active RA as well as the secretion of hepcidin from hepatocytes.28,29
Due to its actual release from muscle cells (myonectin), the value of ERFE in human diseases is not restricted to anemia. In addition to being elevated in β-thalassemia major patients and associated with iron overload,30,31 it has also been studied in CKD where EPO is the main treatment modality.14,15,32 Furthermore, the metabolic effect of myonectin has been addressed in the study of Seldin et al,6 and a tight relationship was found with glucose homeostasis and insulin sensitivity in diabetes mellitus patients.33
In order to discern the source of ERFE in the study patients, ie, whether from muscle or expanding erythroblasts, we measured EPO level in 25 RA patients, both RA activity-based groups were represented. The significantly higher EPO levels in active RA patients suggest an erythroid origin of ERFE. However, a non-erythroid source of ERFE might be suggested based on the following observations:
- Difference in EPO levels, though statistically significant, was not proportionate to the much greater ERFE expression values in active RA patients.
- Similar ERFE levels in healthy control subjects and inactive RA patients in the background of significantly lowered hemoglobin level in the latter group, denote a poor causal effect of anemic hypoxia and EPO in the production of ERFE.
Consequently, it may be convincing to consider muscle as the derivation of most of the secreted ERFE hormone in the study patients, but there is no evidence to support this hypothesis. In contrast to erythroblasts ERFE, which requires EPO for its secretion, muscle ERFE has several suggested mechanisms of release on which there is a lack of agreement and have contradicting theories. ERFE is produced and secreted by skeletal muscle in response to physical activity.6,34 However, it was recently claimed to be released in resistance modalities of movement.35 Attempts to move an inflexible joint might be viewed as a direct cause of resistance to movement. However, we cannot verify whether exercise restriction is a direct cause of increased muscle ERFE secretion since the available data are inadequate to accurately correlate the degree of pain or exercise resistance to the increase in ERFE level.
Another theory describing the mechanism of muscle release of ERFE introduces the endocrine function of adipose tissue. Adipocytes have been suggested to send inhibitory signals to skeletal muscle tissue through adipokines, thereby reducing muscle ERFE secretion.36 Loss of fat was hypothesized to increase ERFE release from muscles. We believe that the value of this hypothesis is questionable since total body fat increases in RA that usually shows altered distribution.37 Moreover, adiponectin, one important member of the adipokines family, was found to positively correlate with activity parameters of RA and increase in RA patients treated with anti-TNF agents (eg, infliximab).38 However, low adiponectin levels can occur in patients with activity who experienced refractoriness to infliximab,39 which was not the case in any of the patients in the present study.
In a recent study by Stewart et al,40 which investigated the protein modifications required for secretion of myonectin/ERFE, proline hydroxylation by collagen prolyl 4-hydroxylase was found to be necessary for the effective secretion of proteins containing collagen domains, of which myonectin is one. They demonstrated that inhibition of proline hydroxylation significantly reduced the secretion of myonectin. Thus, since an increase in hydroxyproline level in synovial fluid and serum was related to the presence of activity features of RA,41,42 the assumption that proline hydroxylation is responsible for the significantly higher muscle ERFE in active RA might be plausible.
An important finding that needs to be emphasized is that RBC count, Hct and MCV values were significantly higher in the active RA group and in patients who expressed higher than the ERFE cut-off value, compared with their respective counterpart groups. The increase in RBC parameters with the high ERFE levels raises the assumption that ERFE has performed its role in promoting iron delivery to erythroblasts in anemic RA patients during disease activity. In two previous studies conducted on rats, a sustained erythropoietin treatment has provoked insulin sensitivity and improved glucose metabolism.43,44 So, because erythroid ERFE is the one that is released in response to erythropoietin, a united function of ERFE, encompassing that of erythroid ERFE and muscle ERFE, was suggested to exert this metabolic effect.1 Likewise, the high ERFE found in active RA patients in our study, whose muscle source is being proposed, might have traversed its scope of action to stimulate erythropoiesis. Still, the higher hepcidin values that marked the activity status challenge this possibility.
Conclusion
In conclusion, the presented results introduce ERFE as a novel marker of RA activity. We consider the measured ERFE as total ERFE, which included erythroid and muscle ERFE. Some evidence suggesting ERFE to have a beneficial effect on the dismal erythroid compartment was revealed; the validation of this effect can provide new opportunities to treat anemia that may perturb RA patients. However, the study has certain limitations that are related to patient selection. Firstly, the enrolled patients had either ACD alone or ACD combined with iron deficiency anemia. Thus, the study lacks a homogeneous group of patients with pure ACD. Another limitation is the absence of patient control group, because non-anemic RA patients were not included in the study.
Additional studies including larger number of patients are recommended to validate the study findings. Obtaining an individualized pattern of ERFE expression, at times of disease activity and after resolution, and measuring other inflammatory parameters, eg, IL-6 and TNF-α, can clarify its mechanism of secretion. Furthermore, the inclusion of non-anemic RA patients in the study of ERFE and hepcidin expression can provide additional insight over the activity of ERFE in the course of ACD or inflammatory process.
Disclosure
The authors have no conflicts of interest in this work to disclose.
References
1. Coffey R, Ganz T. Erythroferrone: an erythroid regulator of hepcidin and iron metabolism. Hemasphere. 2018;2(2):e35. doi:10.1097/HS9.0000000000000035
2. Kautz L, Jung G, Valore E, Rivella S, Nemeth E, Ganz T. Identification of erythroferrone as an erythroid regulator of iron metabolism. Nat Genet. 2014;46(7):678–684. doi:10.1038/ng.2996
3. Canali S, Wang C-Y, Zumbrennen-Bullough KB, Bayer A, Babitt JL. Bone morphogenetic protein 2 controls iron homeostasis in mice independent of Bmp6. Am J Hematol. 2017;92:1204–1213. doi:10.1002/ajh.24888
4. Arezes J, Foy N, McHugh K, et al. Erythroferrone inhibits the induction of hepcidin by BMP6. Blood. 2018;132(14):1473–1477. doi:10.1182/blood-2018-06-857995
5. Pagani A, Nai A, Silvestri L, Camaschella C. Hepcidin and anemia: a tight relationship. Front Physiol. 2019;10:1294. doi:10.3389/fphys.2019.01294
6. Seldin M, Jonathan P, Mardi B, Zhikui W, Wong G. Myonectin (CTRP15), a novel myokine that links skeletal muscle to systemic lipid homeostasis. J Biol Chem. 2012;287:11968–11980. doi:10.1074/jbc.M111.336834
7. Gamas L, Matafome P, Seiça R. Irisin and myonectin regulation in the insulin resistant muscle: implications to adipose tissue: muscle crosstalk. J Diabetes Res. 2015;2015:359159. doi:10.1155/2015/359159
8. Girelli D, Nemeth E, Swinkels DW. Hepcidin in the diagnosis of iron disorders. Blood. 2016;127(23):2809–2813. doi:10.1182/blood-2015-12-639112
9. Weiss G, Ganz T, Goodnough LT. Anemia of inflammation. Blood. 2019;133(1):40–50. doi:10.1182/blood-2018-06-856500
10. Nemeth E, Rivera S, Gabayan V, et al. IL-6 mediates hypoferremia of inflammation by inducing the synthesis of the iron regulatory hormone hepcidin. J Clin Invest. 2004;113(9):1271–1276. doi:10.1172/JCI20945
11. Papadaki HA, Kritikos HD, Valatas V, Boumpas DT, Eliopoulos GD. Anemia of chronic disease in rheumatoid arthritis is associated with increased apoptosis of bone marrow erythroid cells: improvement following anti–tumor necrosis factor-α antibody therapy. Blood. 2002;100:474–482. doi:10.1182/blood-2002-01-0136
12. Demirag MD, Haznedaroglu S, Sancak B, et al. Circulating hepcidin in the crossroads of anemia and inflammation associated with rheumatoid arthritis. Intern Med. 2009;48(6):421–426. doi:10.2169/internalmedicine.48.1578
13. Kautz L, Jung G, Nemeth E, Ganz T. Erythroferrone contributes to recovery from anemia of inflammation. Blood. 2014;124(16):2569–2574. doi:10.1182/blood-2014-06-584607
14. Hanudel MR, Rappaport M, Chua K, et al. Levels of the erythropoietin-responsive hormone erythroferrone in mice and humans with chronic kidney disease. Haematologica. 2018;103;e141–e142.
15. Honda H, Kobayashi Y, Onuma S, et al. Associations among erythroferrone and biomarkers of erythropoiesis and iron metabolism, and treatment with long-term erythropoiesis-stimulating agents in patients on hemodialysis. PLoS One. 2016;11:1–10. doi:10.1371/journal.pone.0151601
16. Aletaha D, Neogi T, Silman AJ, et al. Rheumatoid arthritis classification criteria: an American College of Rheumatology/European League Against Rheumatism collaborative initiative. Ann Rheum Dis. 2010;69(9):1580–1588. doi:10.1136/ard.2010.138461
17. Weiss G, Goodnough LT. Anemia of chronic disease. N Engl J Med. 2005;352(10):1011–1023. doi:10.1056/NEJMra041809
18. Wells G, Becker JC, Teng J, et al. Validation of the 28-joint Disease Activity Score (DAS28) and European League Against Rheumatism response criteria based on C-reactive protein against disease progression in patients with rheumatoid arthritis, and comparison with the DAS28 based on erythrocyte sedimentation rate. Ann Rheum Dis. 2009;68(6):954–960. doi:10.1136/ard.2007.084459
19. Pincus T, Yazici Y, Bergman M. Development of a multidimensional health assessment questionnaire (MD-HAQ) for the infrastructure of standard clinical care. Clin Exp Rheumatol. 2005;23(Suppl.39):S19–28.
20. Livak KJ, Schmittgen TD. Analysis of Relative Gene Expression Data Using Real-Time Quantitative PCR and the 2−ΔΔCT Method. Methods. 2001;25(4):402–408. doi:10.1006/meth.2001.1262
21. McLaren CE, Li KT, Gordeuk VR, Hasselblad V, McLaren GD. Relationship between transferrin saturation and iron stores in the African American and US Caucasian populations: analysis of data from the third National Health and Nutrition Examination Survey. Blood. 2001;98(8):2345–2351. doi:10.1182/blood.V98.8.2345
22. Oh HL, Lee JA, Kim DH, Lim JS. Reference values for serum ferritin and percentage of transferrin saturation in Korean children and adolescents. Blood Res. 2018;53(1):18–24. doi:10.5045/br.2018.53.1.18
23. Zacharski LR, Ornstein DL, Woloshin S, Schwartz LM. Association of age, sex, and race with body iron stores in adults: analysis of NHANES III data. Am Heart J. 2000;140:98–104. doi:10.1067/mhj.2000.106646
24. Peeters HR, Jongen-Lavrencic M, Raja AN, et al. Course and characteristics of anaemia in patients with rheumatoid arthritis of recent onset. Ann Rheum Dis. 1996;55(3):162–168. doi:10.1136/ard.55.3.162
25. Sahebari M, Rezaieyazdi Z, Hashemy SI, et al. Serum hepcidin level and rheumatoid arthritis disease activity. Eur J Rheumatol. 2018;6(2):76–80. doi:10.5152/eurjrheum.2018.18114
26. Cullis JO. Diagnosis and management of anaemia of chronic disease: current status. Br J Haematol. 2011;154(3):289–300. doi:10.1111/j.1365-2141.2011.08741.x
27. Poggiali E, Migone De Amicis M, Motta I. Anemia of chronic disease: a unique defect of iron recycling for many different chronic diseases. Eur J Intern Med. 2014;25(1):12–17. doi:10.1016/j.ejim.2013.07.011
28. Ali ET, Jabbar AS, Mohammed AN. A comparative study of interleukin 6, inflammatory markers, ferritin, and hematological profile in rheumatoid arthritis patients with anemia of chronic disease and iron deficiency anemia. Anemia. 2019;2019:3457347. doi:10.1155/2019/3457347
29. Hayashi S, Matsubara T, Fukuda K, et al. Predictive factors for effective selection of Interleukin-6 inhibitor and tumor necrosis factor inhibitor in the treatment of rheumatoid arthritis. Sci Rep. 2020;10(1):16645. doi:10.1038/s41598-020-73968-3
30. El-Gamal RAE, Abdel-Messih IY, Habashy DM, Zaiema SEG, Pessar SA. Erythroferrone, the new iron regulator: evaluation of its levels in Egyptian patients with beta thalassemia. Ann Hematol. 2020;99(1):31–39. doi:10.1007/s00277-019-03882-w
31. Smesam HNK, Albuthabhak HAQ, Arjmand S, Al-Hakeim HK, Siadat SOR. Evaluation of erythroferrone, hepcidin, and iron overload status in Iraqi transfusion-dependent β-thalassemia major patients. Hemoglobin. 2020;44(4):272–277. doi:10.1080/03630269.2020.1794888
32. Spoto B, Kakkar R, Lo L, et al. Serum erythroferrone levels associate with mortality and cardiovascular events in hemodialysis and in CKD patients: a two cohorts study. J Clin Med. 2019;8(4):523. doi:10.3390/jcm8040523
33. Li K, Liao X, Wang K, et al. Myonectin predicts the development of type 2 diabetes. J Clin Endocrinol Metab. 2018;103(1):139–147. doi:10.1210/jc.2017-01604
34. Eckel J. Myokines in metabolic homeostasis and diabetes. Diabetologia. 2019;62:1523–1528. doi:10.1007/s00125-019-4927-9
35. de Oliveira Dos Santos AR, de Oliveira Zanuso B, Miola VFB, et al. Adipokines, myokines, and hepatokines: crosstalk and metabolic repercussions. Int J Mol Sci. 2021;22(5):2639. doi:10.3390/ijms22052639
36. Li L, Wang Q, Qin C. Serum myonectin is increased after laparoscopic sleeve gastrectomy. Ann Clin Biochem. 2020;57(5):360–364. doi:10.1177/0004563220942263
37. Giles JT, Allison M, Blumenthal RS, et al. Abdominal adiposity in rheumatoid arthritis: association with cardiometabolic risk factors and disease characteristics. Arthritis Rheum. 2010;62(11):3173–3182. doi:10.1002/art.27629
38. Del Prete A, Salvi V, Sozzani S. Adipokines as potential biomarkers in rheumatoid arthritis. Mediators Inflamm. 2014;2014:425068. doi:10.1155/2014/425068
39. Gonzalez-Gay MA, Llorca J, Garcia-Unzueta MT, et al. High-grade inflammation, circulating adiponectin concentrations and cardiovascular risk factors in severe rheumatoid arthritis. Clin Exp Rheumatol. 2008;26(4):596–603.
40. Stewart AN, Little HC, Clark DJ, Zhang H, Wong GW. Protein modifications critical for myonectin/erythroferrone secretion and oligomer assembly. Biochemistry. 2020;59(29):2684–2697. doi:10.1021/acs.biochem.0c00461
41. El Beialy A, Elabd H, Abd El-Rahman A. Serum level of matrix metalloproteinase 3 and hydroxyproline in patients with early rheumatoid arthritis. Egypt J Hosp Med. 2019;77(6):5776–5783. doi:10.21608/ejhm.2019.63575
42. Sambrook PN, Ansell BM, Foster S, Gumpel JM, Hesp R, Reeve J. Bone turnover in early rheumatoid arthritis. 2. Longitudinal bone density studies. Ann Rheum Dis. 1985;44(9):580–584. doi:10.1136/ard.44.9.580
43. Caillaud C, Mechta M, Ainge H, et al. Chronic erythropoietin treatment improves diet-induced glucose intolerance in rats. J Endocrinol. 2015;225(2):77–88. doi:10.1530/JOE-15-0010
44. Katz O, Stuible M, Golishevski N, et al. Erythropoietin treatment leads to reduced blood glucose levels and body mass: insights from murine models. J Endocrinol. 2010;205(1):87–95. doi:10.1677/JOE-09-0425
 © 2021 The Author(s). This work is published and licensed by Dove Medical Press Limited. The
full terms of this license are available at https://www.dovepress.com/terms
and incorporate the Creative Commons Attribution
- Non Commercial (unported, 3.0) License.
By accessing the work you hereby accept the Terms. Non-commercial uses of the work are permitted
without any further permission from Dove Medical Press Limited, provided the work is properly
attributed. For permission for commercial use of this work, please see paragraphs 4.2 and 5 of our Terms.
© 2021 The Author(s). This work is published and licensed by Dove Medical Press Limited. The
full terms of this license are available at https://www.dovepress.com/terms
and incorporate the Creative Commons Attribution
- Non Commercial (unported, 3.0) License.
By accessing the work you hereby accept the Terms. Non-commercial uses of the work are permitted
without any further permission from Dove Medical Press Limited, provided the work is properly
attributed. For permission for commercial use of this work, please see paragraphs 4.2 and 5 of our Terms.