Back to Journals » Journal of Pain Research » Volume 19
Episodic Migraine Pain Curves: Real-Time Smartphone-Based Analysis and Clinical Implications [Response to Letter]
Authors Gago-Veiga AB ![]() , Gonzalez-Martinez A, Quintas S, Vieira A
, Gonzalez-Martinez A, Quintas S, Vieira A ![]() , Gálvez-Goicuría J, Sanz-García A, Ayala JL
, Gálvez-Goicuría J, Sanz-García A, Ayala JL ![]() , Sobrado M, Vivancos J, Pagan J
, Sobrado M, Vivancos J, Pagan J ![]()
Received 23 January 2026
Accepted for publication 5 February 2026
Published 11 February 2026 Volume 2026:19 598383
Ana Beatriz Gago-Veiga,1 Alicia Gonzalez-Martinez,1 Sonia Quintas,1 Alba Vieira,1 Javier Gálvez-Goicuría,2,3 Ancor Sanz-García,4 Jose Luis Ayala,5,6 Monica Sobrado,1 Jose Vivancos,1 Josué Pagan3,6
1Neurology Department, Hospital Universitario de La Princesa & Instituto de Investigación Sanitaria Princesa (IIS-Princesa), Madrid, Spain; 2Brainguard SL, Pozuelo de Alarcón, Spain; 3Electronic Engineering Department, Universidad Politécnica de Madrid, Madrid, Spain; 4Unidad de Análisis de datos, Instituto de Investigación Sanitaria (IIS-Princesa), Hospital Universitario de la Princesa, Madrid, Spain; 5Computer Architecture and Automation Department, Universidad Complutense de Madrid, Madrid, Spain; 6CCS: Center for Computational Simulation, Universidad Politécnica de Madrid, Madrid, Spain
Correspondence: Ana Beatriz Gago-Veiga, Hospital Universitario de la Princesa, Headache Unit, Neurology Department. Hospital Universitario La Princesa, Calle Diego de León, 62, Madrid, 28006, Spain, Email [email protected]
View the original paper by Dr Gago-Veiga and colleagues
This is in response to the Letter to the Editor
Dear editor
We thank Zhang et al for their interest in our recently published article, “Episodic Migraine Pain Curves: Real-Time Smartphone-Based Analysis and Clinical Implications”, and for the opportunity to clarify several methodological and interpretative aspects of our work. We appreciate their constructive tone and are pleased to respond to each point raised.
Cluster Analysis Validity and Stability
We appreciate the interest shown by Zhang et al regarding our article “Episodic Migraine Pain Curves: Real-Time Smartphone-Based Analysis and Clinical Implications”. However, we consider it important to clarify their concerns regarding the validity metrics of our cluster analysis, as these appear to relate to expectations about methodological detail that fall outside the scope of the present clinically focused study, and are addressed in our previously published methodological work.
The authors state that “no key validation metrics were provided to demonstrate the stability and internal validity of the clustering results” and suggest the use of the silhouette coefficient. We must clarify that the present study was designed to analyze the clinical implications of migraine pain phenotypes that were identified, modeled, and technically validated in our previous engineering study, published in the IEEE Journal of Biomedical and Health Informatics (Gálvez-Goicuría et al, 2021), which is cited as Reference 10 in the article.
In that original study, the clustering methodology was rigorously tested. We employed the Within-Cluster Sum of Squares (WCSS) metric and the “elbow method” to determine the optimal number of clusters. As demonstrated in that paper, we analyzed the cohesion index for k ranging from 2 to 9 and identified k=4 as the optimal solution based on the point of maximum curvature (the elbow). Furthermore, we analyzed the distribution of samples within these clusters to ensure stability, verifying that increasing k did not result in clinically meaningless microclusters. Therefore, the stability and internal validity of these clusters were already established before the current clinical analysis was conducted. For this reason, repeating these technical validation metrics in a clinical paper was considered unnecessary.
Regarding the authors’ comment that running the algorithm 10 times with different centroids “does not by itself guarantee stability, rather it pursues and enhances it”: this represents a largely terminological distinction that does not materially affect the interpretation of the clinical results. In computational practice, utilizing the K-means++ initialization and selecting the solution with the lowest WCSS after multiple runs is the standard procedure to avoid local minima. This approach ensures that the resulting pain curves (Type 1 to Type 4) are robust representations of the data, not artifacts of initialization. Indeed, the classification model created after the clustering one further supports the robustness of this approach, showing 99.0% accuracy.
We stand by our methodology and the clinical relevance of our findings. The focus of this research is to translate technical biometric classification into personalized management strategies for migraine patients. Accordingly, methodological considerations regarding clustering validation are comprehensively addressed in the original methodological publication, rather than being repeated in the present clinical application of those validated models.
Multiple Comparison Correction
The criticism regarding the absence of multiple comparison corrections, such as Bonferroni or FDR, reflects a difference in methodological perspective regarding the study’s aims, rather than a methodological flaw. This is an observational, exploratory study designed to phenotype migraine attacks using real-time data, not a confirmatory clinical trial. Applying overly conservative corrections such as Bonferroni in this context may substantially increase the risk of Type II errors (false negatives). In exploratory clinical research, preserving sensitivity to detect potentially meaningful signals is a widely accepted approach, particularly when findings are biologically and clinically plausible.
Furthermore, it is important to note that the study’s main findings remain statistically robust regardless of correction method. As shown in Tables 3 and 5, the primary differentiators of the pain curve phenotypes—specifically Pain Intensity, Nausea, Phonophobia, Duration, and Time to Resolution—exhibit p-values <0.001. These variables constitute the core basis of our phenotypic classification, and their statistical significance would be preserved even under stringent multiple-comparison adjustments. Therefore, concerns regarding inflated Type I error do not affect the principal conclusions of the study.
Regarding secondary variables, we conducted a post-hoc sensitivity analysis using the Benjamini–Hochberg false discovery rate (FDR) procedure. Under this approach, Hypertension (p=0.010), Cognitive reserve (p=0.010), Nolotil use (p=0.025), and BMI (p=0.030) fall near the adjusted significance threshold. Rather than excluding these variables outright, we chose to report them transparently, allowing readers to interpret their relevance within the broader clinical context. This strategy is consistent with the exploratory nature of the study and avoids prematurely discarding potentially informative phenotypic associations.
Sex Imbalance and Interpretation of Gender-Related Findings
The predominance of women in our sample reflects the well-established epidemiology of migraine, particularly in specialized headache clinics. As explicitly stated in the Limitations section of the manuscript, this marked sex imbalance requires a cautious interpretation of any gender-related findings. Within this framework, the differences observed in sex distribution across the different pain curve types are presented descriptively and interpreted in light of the known epidemiological context.
At no point do we aim to suggest universal or generalizable gender effects. As already acknowledged in the manuscript, these observations should be considered exploratory and require confirmation in future studies with larger and more sex-balanced cohorts. We therefore believe that our interpretation is appropriate, proportionate, and fully consistent with the recognized limitations of the study population.
Age and Age at Onset Data
We thank the authors for identifying this issue. We acknowledge that in Table 2 the row labelled “Age in years” was incorrectly presented and duplicates the values for age at onset, reflecting a presentation error. Importantly, comparisons involving age did not yield statistically significant differences between pain curve types, and age was not a discriminative factor for any specific pain curve profile. Therefore, this issue does not affect the interpretation of the results nor the clinical characterization of the pain curve subgroups.
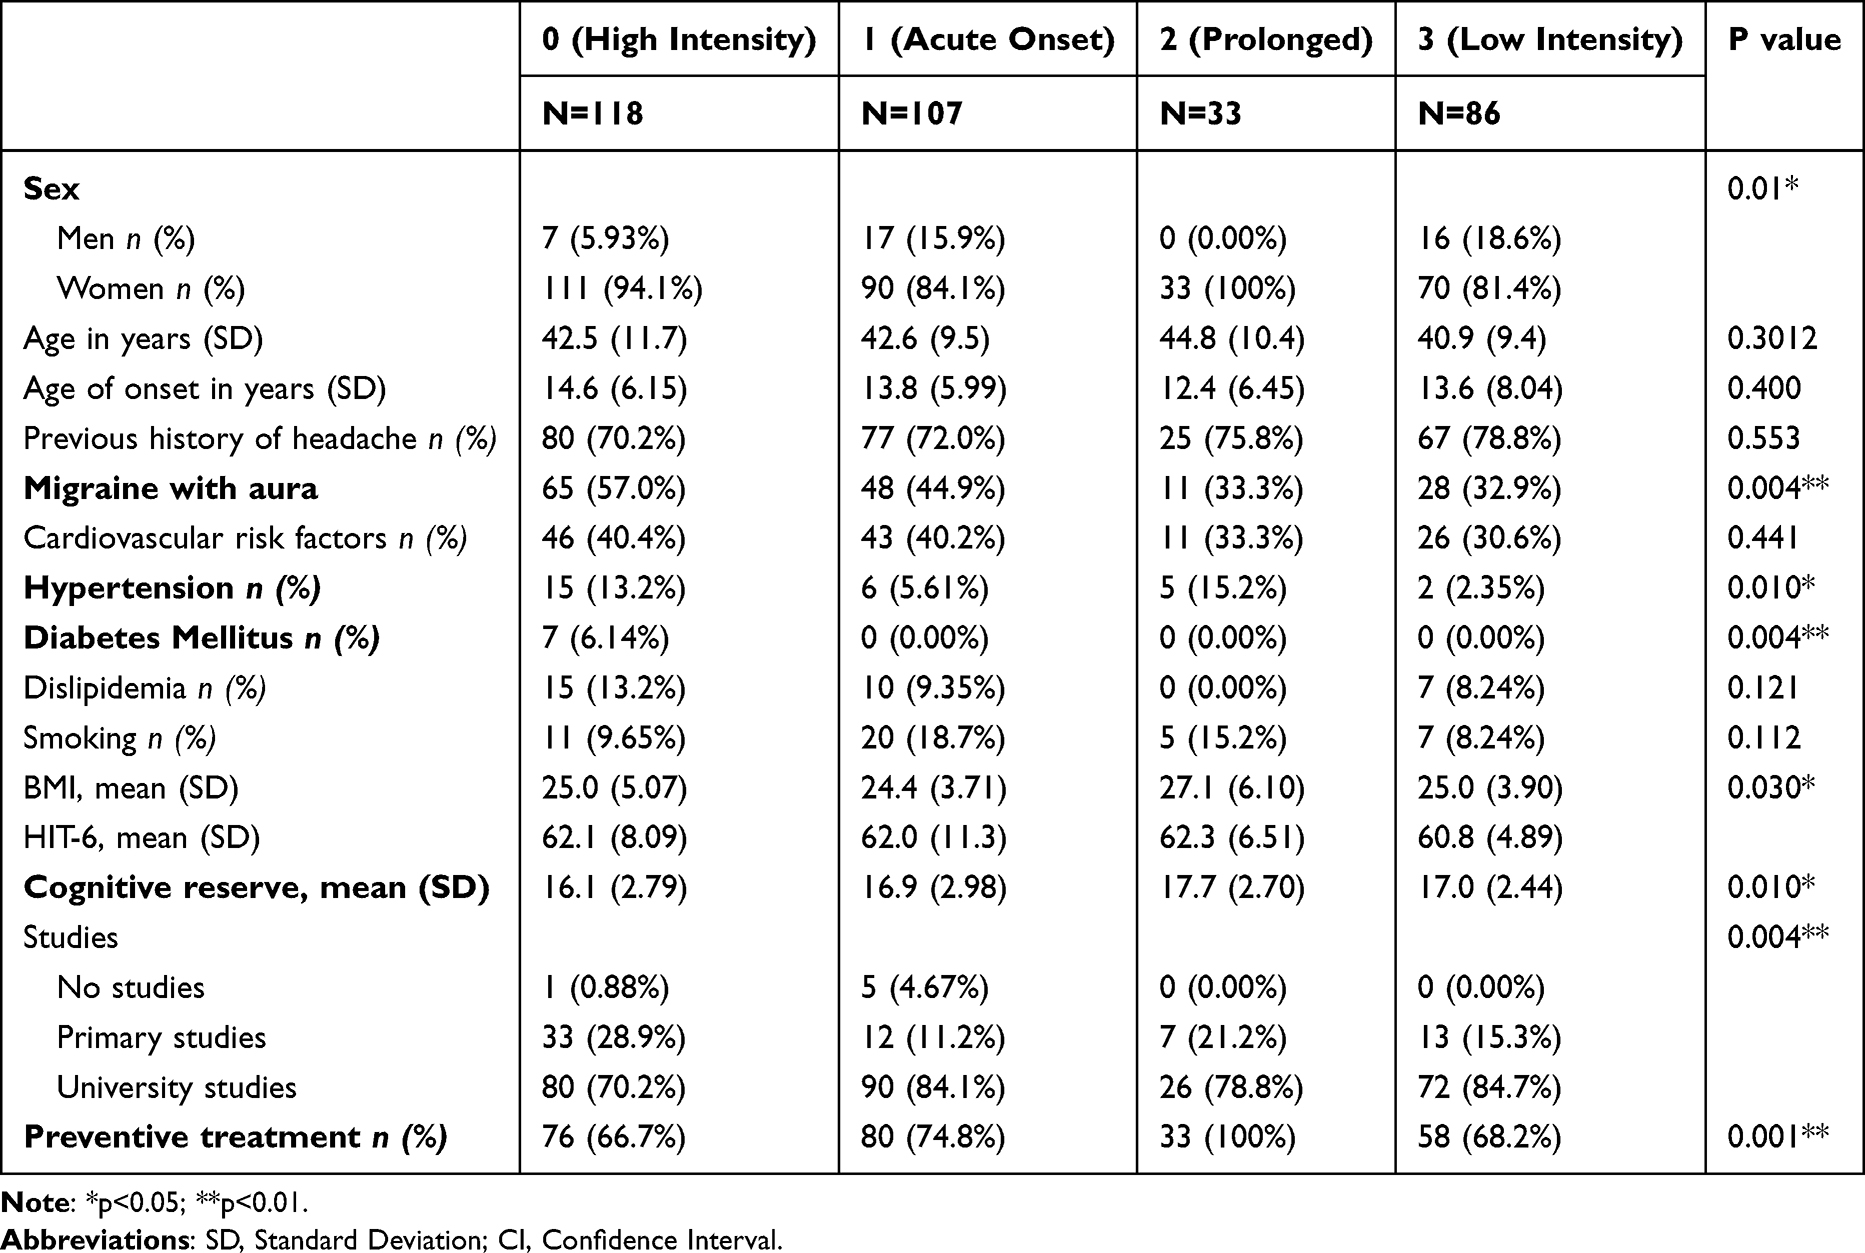 |
Table 2 Baseline Characteristics Regarding the Migraine Curve |
Missing Unit Identifiers in Tables
We appreciate the opportunity to clarify this point, as this comment appears to arise from a misunderstanding of how the data are presented, rather than from missing information. As explicitly stated in the footnotes of our tables (eg, Table 2), data are presented following standard scientific conventions: categorical variables are expressed as frequencies and percentages [n (%)], while continuous variables are expressed as mean (standard deviation).
Accordingly, the unit identifiers are defined at the table level, and their repetition in each column or cell was not considered necessary. The absence of a percent sign therefore indicates a continuous variable, while categorical variables are clearly identified through the [n (%)] notation specified in the table footnotes. This approach is consistent with standard statistical reporting practices and allows for clear and accurate interpretation of the data.
We therefore consider this a formatting choice rather than an omission, and one that does not affect the clarity, accuracy, or interpretation of the reported results.
Conclusion
We thank Zhang et al for their interest and thoughtful reading of our work. We consider that the methodological approach employed is appropriate for the exploratory and clinically oriented objectives of the study, and that the main limitations related to sample size, sex distribution, and statistical inference were transparently acknowledged. Their comments mainly focus on methodological aspects that have already been validated in the technical literature or on limitations previously discussed, and do not alter the principal conclusions of the study.
We hope that these clarifications help to appropriately contextualize our findings and reinforce the value of real-time pain trajectory analysis as a promising tool for advancing toward more personalized migraine management.
Disclosure
ABG-V has received speaker honoraria and/or served as a clinical advisor for Novartis, Lilly, TEVA, Exeltis, Chiesi, Abbvie, Pfizer, Dr. Reddy’s, and Lundbeck. She is the coordinator and principal investigator of a research IMPaCT project, grant number PMP22/00158. A.G.M. has received speaker honoraria from TEVA, Lilly, and Altermedica. S.Q. has received honoraria from Lilly, Novartis, Exeltis, UCB Pharma, Bial, and Altermedica. The remaining authors declare no conflicts of interest in this communication.
 © 2026 The Author(s). This work is published and licensed by Dove Medical Press Limited. The
full terms of this license are available at https://www.dovepress.com/terms
and incorporate the Creative Commons Attribution
- Non Commercial (unported, 4.0) License.
By accessing the work you hereby accept the Terms. Non-commercial uses of the work are permitted
without any further permission from Dove Medical Press Limited, provided the work is properly
attributed. For permission for commercial use of this work, please see paragraphs 4.2 and 5 of our Terms.
© 2026 The Author(s). This work is published and licensed by Dove Medical Press Limited. The
full terms of this license are available at https://www.dovepress.com/terms
and incorporate the Creative Commons Attribution
- Non Commercial (unported, 4.0) License.
By accessing the work you hereby accept the Terms. Non-commercial uses of the work are permitted
without any further permission from Dove Medical Press Limited, provided the work is properly
attributed. For permission for commercial use of this work, please see paragraphs 4.2 and 5 of our Terms.