")
Back to Journals » HIV/AIDS - Research and Palliative Care » Volume 12
Epidemiology of HIV Infection in the Amhara Region of Ethiopia, 2015 to 2018 Surveillance Data Analysis
Authors Worku ED, Asemahagn MA , Endalifer ML
Received 10 March 2020
Accepted for publication 25 June 2020
Published 30 July 2020 Volume 2020:12 Pages 307—314
DOI https://doi.org/10.2147/HIV.S253194
Checked for plagiarism Yes
Review by Single anonymous peer review
Peer reviewer comments 2
Editor who approved publication: Professor Bassel Sawaya
Etsehiwot Debe Worku,1 Mulusew Andualem Asemahagn,2 Melese Linger Endalifer3
1North Shewa Zone Health Department, Amhara Regional Health Bureau, Bahir Dar, Ethiopia; 2School of Public Health, College of Medicine and Health Sciences, Bahir Dar University, Bahir Dar, Ethiopia; 3Department of Midwifery, Woldiya University, Woldiay, Ethiopia
Correspondence: Mulusew Andualem Asemahagn
School of Public Health, College of Medicine and Health Sciences, Bahir Dar University, P.O. Box 76, Bahir Dar, Ethiopia
Email [email protected]
Background: Globally, over 37.9 million people are living with HIV in 2018 and sub-Saharan Africa carries 71% of the global HIV epidemics. In Ethiopia, there were an estimated 613,000 HIV cases in 2017. This study aimed to assess the trend of HIV incidence in the Amhara Region, Ethiopia.
Methods: A retrospective descriptive study was conducted using routine HIV data from 2015 to 2018. We extracted HIV records from the Amhara Regional Health Bureau database. Data confidentiality was secured through data anonymity. Data were entered, cleaned and analyzed by IBM SPSS version 22 (Armonk, NY, USA). Various descriptive statistics such as counts, proportions and trends were computed to see the magnitude of HIV in the study area.
Results: A total of 57,293 new HIV cases were reported from 2015 to 2018 and 33,720 (59%) were females. The majority, 40,054 (70%), of HIV cases were among people in 25− 49 years. The overall incidence rate of HIV from 2015 to 2018 was 6.9 per 1000 population. The annual HIV incidence rates were 7.3. 6.3, 7.4 and 6.63 per 1000 population in 2015, 2016, 2017 and 2018, respectively. The incidence rate per 1000 population was high in Dessie town (5.74), Bahir Dar city (4.27) and Gondar town (3.00). About 49,564 (86.5%) of HIV cases have started ART and 33% of them had TB infection where 54% of them were females. Only 14869 (30%) people on ART had normal nutritional status.
Conclusion: HIV remains a public health concern in the Amhara Region and the burden varied by place, time, gender and age groups. Improving awareness creation and community mobilization, managing TB infection and undernutrition problems, and making HIV screening services available in all healthcare facilities are crucial to decrease HIV infection. Special attention is also required to avoid risk factors that increased HIV incidence among females.
Keywords: HIV, trend, surveillance, Amhara region, Ethiopia
Background
As a result of various anti-HIV/AIDS interventions, HIV infection and death fell by 37%, and 45%, respectively. Also, over 13.6 million lives saved due to ART intervention from 2000 to 2018.1 However, HIV infection remains to be a major public health concern, having claimed over 32 million lives. Globally, about 37.9 million people lived with HIV and 1.7 million were newly infected at the end of 2018.1,2 Over 770 000 people died from HIV-related causes in 2018 and 40% of the expected HIV cases are not yet detected and notified.1,3
In 2013, an estimated 24.7 (71%) millions of HIV cases (1.5 million new infections) were reported in sub-Saharan Africa. There were also about 1.1 million AIDS-related deaths in the region. The average regional HIV prevalence was 4.7% and varied across countries.4,5 In general, over 70% of all AIDS-related deaths were in sub-Saharan Africa where over half of the HIV-infected population were women and children.6 In 2018, about 25.7 million of the 37.9 million people living with HIV lived in the Africa.1
In Ethiopia, the annual number of HIV infected people showed declining trends since 2002. HIV prevalence rate decreased from 3.3% in 2000 to 0.9% in 2017, and AIDS-related deaths from 83,000 deaths in 2000 to 15,600 in 2017.7,8 However, HIV remains a key public health concern in Ethiopia8–10 with a prevalence of 0.9% ranging from 0.1% to 4.8% among people aged 15–49 years in 2018.8 Similarly, the HIV epidemic in Ethiopia is highly heterogeneous by sex, geographic areas and population groups. The HIV prevalence among men aged 15–49 years was 0.6% with a peak of 1.6% compared to the prevalence among women (1.2% and a peak of 3%).7–9 The highest prevalence of HIV was observed in the Gambella Region (4.8%) followed by Addis Ababa (3.4%) which might be related to low male circumcision in Gambella and high population growth in Addis Ababa.7,8,11 Also, an estimated 613,000 people were living with HIV, where 62% were female and 30% were from the Amhara region in 2017.8
As per the researchers’ knowledge and search, there is limited research on current HIV incidence and trends in Ethiopia and its regions. To date, the prevention of HIV/AIDS infection becomes an issue for the Ethiopian Government due to increased HIV incidence in the routine health facility reports.8 Therefore, this study aimed to assess the incidence and trend of HIV/IDS in the Amhara Region, one of the high HIV and TB burden regions in Ethiopia. In addition, the region is the second populous next to the Oromia Region with varying geographic features and climatic zones.8,9 The study out puts will be crucial for HIV/HIDS control officials to make evidence-based HIV prevention and control interventions.
Methods and Materials
Study Design and Area
A retrospective cross-sectional descriptive study was conducted to assess the incidence and trend of HIV/AIDS in the Amhara Region, Ethiopia. Amhara Region is the second largest region in Ethiopian next to the Oromia Region. The region shares common borders with the state of Tigray in the North, Afar in the East, Oromiya in the South, Benishangul Gumuz in the Southwest and the Republic of Sudan in the West. It is the second populous region with an estimated 10,900,396 male and 10,941,603 female population. The Region is topographically divided into two main parts, namely the highlands (above 1500 meters above sea level) and lowlands (between 500–1500 meters above sea level). It has three climatic zones: Areas beyond 2,300 meters above the sea are “Dega”, areas between the 1,500–2,300 meters above sea level are “Woina Dega” and areas below 1,500 meters are “Kolla” or hot climatic zones. Over 85% of its population is engaged in agriculture. The capital city of the region is Bahir Dar city to which the Lake Tana and Blue Nile Falls (Tis Abay) are located. Administratively, the region is divided into eleven zones ( a middle administrative unit next to a region), 105 woredas (lower administrative level next to zone) and 78 urban centers.12,13
Sample Size Determination
All four consecutive years (2015–2018) HIV data records in the Amhara Regional Health Bureau database were considered for the analysis. The HIV records of people from other regions and records with over 2.5% incomplete values were excluded from the analysis.
Data Collection Procedures
Data were collected after getting ethical clearance from the College of Medicine and Health Sciences, Bahir Dar University. We also communicated the Amhara Regional Health Bureau and got a supportive letter to have access to the database. We extracted data in July and August 201from the regional health bureau routine HIV data recording database using data extraction guidelines. Socio-demographic variables, HIV profile, ART profile, opportunistic infections and co-morbidity profiles, date of diagnosis for HIV and data of ART start were major contents of the data extraction guideline. Data were retrieved with codes and anonymity to keep data confidentiality. Data were collected in a year based and checked for completeness by using MS-excel 2016.
Data Quality Assurance
Data were extracted from the database based on the data extraction guideline. Records with 2.5% incomplete values were excluded. Double data entry was made to control data entry errors. Data completeness and clearance were checked before analysis using SPSS version 22. The four-years annual regional HIV reports were used to cross-check the validity of data records in the database.
Data Processing and Analysis
The extracted HIV records and an estimated population of the region were data inputs for the analysis. After data clearance and coding, various descriptive statistics including counts, proportions, rates, cross-tabulations and trends were computed using SPSS version 22. Data were analyzed as the total sum for four years and year based to see the overall and year-based incidence and trends. The incidence was seen by sex, age groups and residence. The incidence rates per 1000 people for overall and each year were computed by dividing the HIV positive cases with total screened and multiplying by 1000. The outputs were presented using tables and figures.
Ethical Considerations
We took ethical clearance and legal permission from the college of medicine and health sciences, Bahir Dar University and the Amhara Regional Health Bureau. Informed consent was taken from the regional health bureau officers on behalf of the patients since it is retrospective data and unable to get each HIV case for informed consent. A support letter was also taken from the Amhara Regional Health Bureau. We extracted data from the regional health bureau database and deidentified through anonymity to keep data confidentiality. No one other than investigators had access to data.
Results
Profile of HIV Records from 2015 to 2018 Years
A total of 8, 293, 734 people (2,463,784 in 2015, 1,990,347 in 2016, 1,723,844 in 2017 and 2,120,759 in 2018) were screened for HIV during 2015−2018 in the Amhara Region. Of these, 57,293 (17,942 in 2015, 12,517 in 2016, 12,763 in 2017 and 14,071 in 2018) were positive for HIV. The proportion of new HIV infection was higher among females, 33,720 (59%). People in the age category of 25–49 years accounted for 40,054 (70%) of new HIV infections. The majority, 49,564 (86.5%) of new HIV cases have started ART services. A third (33%) of new HIV cases had TB co-infection and 54% of them were females. Only 14869 (30%) of newly ART started people had normal nutritional status based on their body mass index and the WHO guideline. Undernutrition was higher among females and only 32% of them got nutritional supports (Table 1).
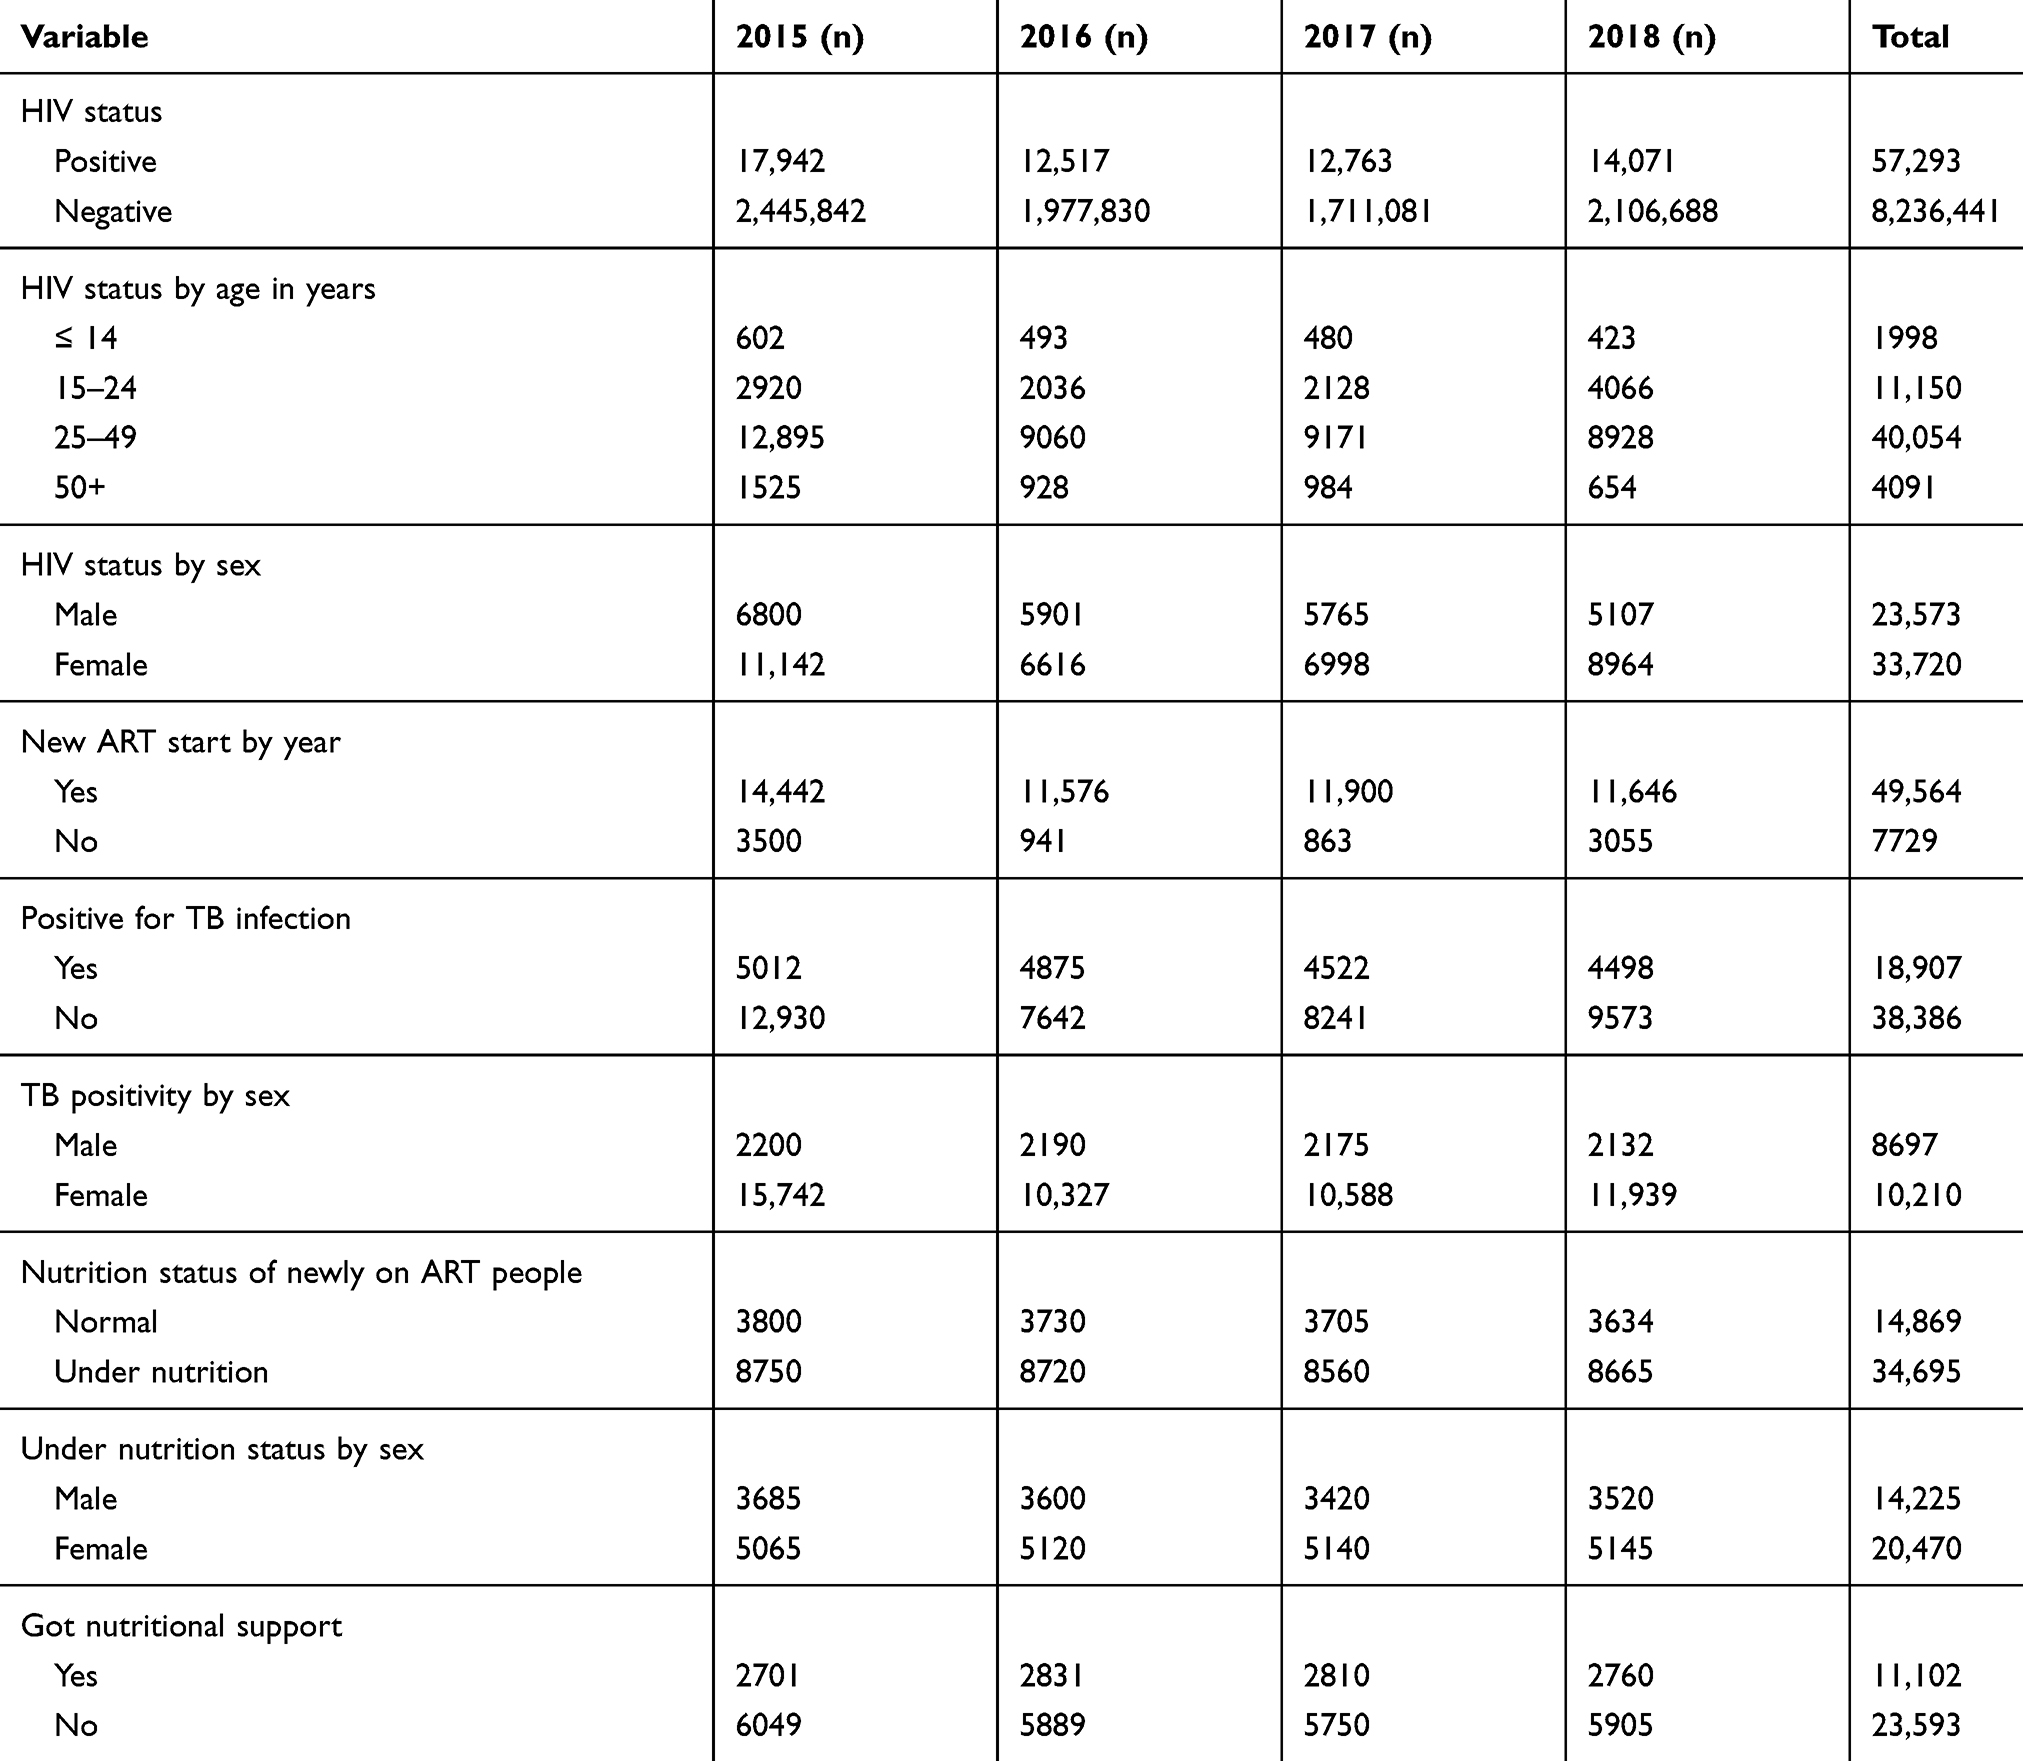 |
Table 1 Profile of HIV Records from 2015 to 2018 in the Amhara Region of Ethiopia |
The Trend of HIV Notification Rate
The overall incidence rate of new HIV infection from 2015 to 2018 in the Amhara region was 6.9 per1000 tested population. The year-based HIV incidence rates were 7.3 per 1000 population in 2015, 6.3 per 1000 population in 2016, 7.4 per 1000 population in 2017 and 6.63 per 1000 population in 2018. The least incidence was reported in 2016 and the highest was in 2015 and 2017 (Figure 1).
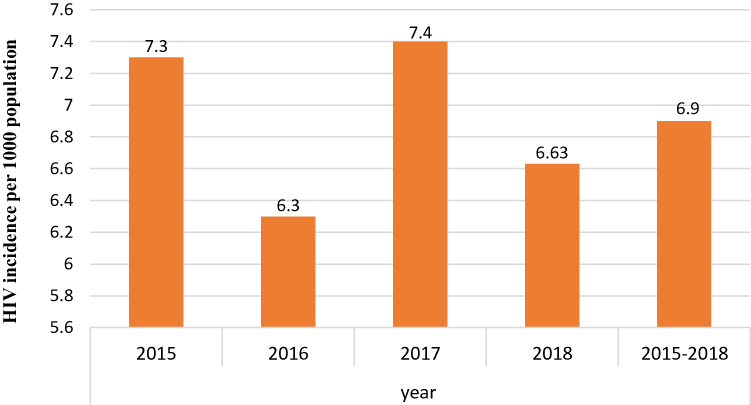 |
Figure 1 Trends of HIV incidence from 2015 to 2018 in the Amhara Region. |
Based on the analysis, the trend of new HIV infection in the Amhara region was found to be varied by time and gender. The incidence rate was higher in females (4.1 per1000 population) than in males (2.84 per1000 population). The trends of new HIV infection showed decreasing from 2015 to 2016 and increasing for both sexes since 2016 (Figure 2).
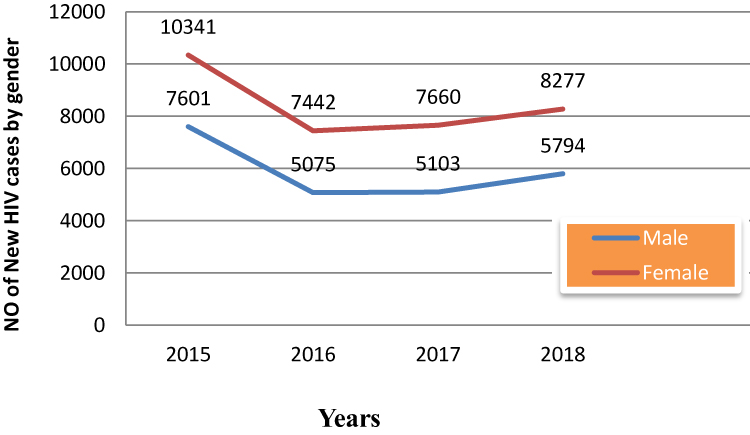 |
Figure 2 Trend of new HIV infection by sex from 2015 to 2018 in the Amhara region, Ethiopia. |
We also examined the HIV incidence by the place where new HIV cases were living. The incidence rate by place revealed varied magnitude across the zones of the Amhara region in the past four consecutive years (Figure 3). The highest number, 7622 (13.3%), was reported in the East Gojjam zone followed by 6480 (11.3%) from North Wello and 5941 (10.4%) from Bahir Dar city administration. Similarly, higher HIV cases were reported from South Wello 5008 (8.7%), North Gondar 4956 (8.65%) and Dessie town 4876 (8.5%) between 2015 and 2018. Whereas, the incidence rate per 1000 population was very high in Dessie town (5.74), Bahir Dar city (4.27) and Gondar town (3.00) (Figure 3).
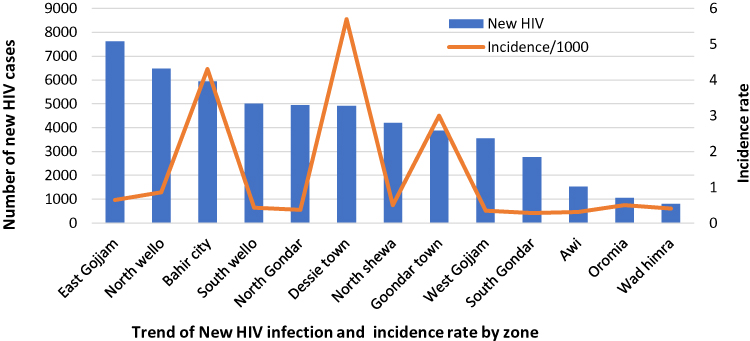 |
Figure 3 New HIV infection and incidence rate per 1000 by zones from 2015 to 2018 in Amhara Region, Ethiopia. |
Discussion
Based on this analysis, 57,293 new HIV infections were reported from a total of 8, 293, 734 screened people in the Amhara region during 2015 to 2018. The overall incidence rate of HIV became 6.9 per 1000 tested population (Figure 1). This figure is among community members who came for healthcare services due to better healthcare-seeking behavior. This implies that there are more undetected infectious HIV incidence cases within the community that is because of either due to unsafe sexual practices or other risk factors.
The current incidence rate was in agreement with the incidence rate reported from a former study in the Amhara region that reported 6.63 per 1000 population. The 2017 USAID report about the African region also supported this finding where Ethiopia and Madagascar showed highest HIV incidence.14 The presence of high HIV incidence might be related to less attention to HIV control by the concerned offices and the community, limited access of HIV testing services, no or poor awareness creation strategies, unsafe sexual practices, low community awareness, and effect of globalization on cultural values and personal behavior.7–10
On the other hand, the current notified new HIV infection was slightly lower compared to the 2016 Ethiopia demographic and health survey (EDHS) report which was 0.9% national prevalence7,15 and 613 000 estimated national HIV cases in 2017 with varied amount across the Ethiopian regions.8 The possible explanation for this discrepancy could be data sources and study area. Our study was only from the Amhara region and the data source is retrospective/routine health facility data/. But, the data source for the EDHS and central statistical agency (CSA) was a population based survey throughout Ethiopia that included areas from lowest to highest in HIV infection. Similarly, our finding was found to be lower than study findings from Lesotho (22.7%), Botswana (22.2%), South Africa (19.2%) in 2017.16 This variation might be attributed to differences in study area coverage (regional vs national), data source (secondary data vs survey), population behavior, the performance of HIV control programs, and community awareness for HIV screening and unsafe sexual practice.
In this analysis, the new HIV infection showed a fluctuating or unstable trend from 2015 to 2018. The overall HIV infection showed a high HIV infection trend with the highest value in 2015 and 2017 (Figure 1). It was supported by a recent study from Ethiopia where the trend of HIV was unstable.15 This is an indication of inconsistent HIV prevention and control activities and the presence of high new HIV infections. HIV was indeed disregarded by program owners, donors, health facilities and the community since post-millennium development goals in Ethiopia. The decentralized HIV prevention and control offices and structures are recentralized and weakened. As a result, community awareness creation, community-based HIV screening, availability of HIV diagnostic kits in health facilities and supports to HIV patients have been dramatically decreased. For example, over 36% of health centers in Ethiopia,17 43% of health facilities in the Amhara Region9 and 37% of health centers in the East Gojjam Zone of the Amhara region18 have no HIV diagnostic kits. In addition, the ongoing community problem of TB might also have a role in the presence of high new HIV infections in the study area.
The proportion of new HIV was also varied by sex, 33,803 (59%) of 57,293 new HIV cases were females (Table 1). The incidence rate among females was 4.1 per 1000 population, double of males’ incidence rate (Figure 2). Findings from the previous studies were in support of this output where the HIV infection was over double among females compared to males.7–10,15,16 The probable justification for this variation could be differences in biology, delivery and its procedures, abortion, sexual abduction and immune system. Also, females relatively have a better frequency of facility visits for family planning, antenatal care and delivery services that might increase the proportion of HIV screening compared to males. Thus, the number who knew their HIV status and got ART services might be relatively larger among females.
Similarly, people aged between 25–49 years accounted for the highest proportion of new HIV infection (70%). This is a very serious concern mainly to Ethiopia where agriculture that requires a huge labor force is its primary economic source. It is also critical to females since it is a reproductive period that will transmit it to children. This was in line with findings from the previous studies where this age group was more affected by HIV infection.9,15,16 This is due to being sexually active, higher exposure to sexual practices because of independence, relatively mobile groups, poor personal behavior (taking alcohol, smoking, chat chewing and drug abuse) and the tendency of easily adapting foreign cultures.
In addition, the present HIV infection indicated a high variation of incidence by zone and town/city administrations. Although HIV was highest in East Gojjam followed by North Wello and Bahir Dar city, it was a public health problem to all zones and town administrations. Moreover, the incidence rate of HIV infection was found to be higher in Dessie town, Bahir Dar city and Gondar town (Figure 3). This indicates that there is a need to give special attention to improving access, quality and relevance of HIV prevention and control activities at all levels in the healthcare system of the Amhara region and in the community at large. Previous studies also reported the presence of HIV infection variability by place7,9 and higher HIV infection in towns.2,10,11,16 This might be related to variation in access and quality of anti-HIV activities, population size, the magnitude of TB-HIV co-infection, poverty, personal behaviors (alcoholism, drug abuse and homosexual practices), unsafe sexual practice and the effect of urbanization that leads to behavioural changes.
Furthermore, 7729 (13.5%) of the notified new HIV cases did not start ART services (Table 1). It is a large gap in HIV prevention and control. These people have transmitted the infection to others and die due to their infection since they do not get ART services and social supports. It was also supported by former studies.2,8,9,16 This could be due to fear of stigma, disappointments, not accepting the result, poor accessibility of ART services, defaulting from ART services due to side effects, poor counseling, death, leaving the residential areas, transportation and comorbidities.
Besides, a third (33%) of new HIV people were co-infected with TB and 54% of them were females. This might worsen the health of co-infected people by affecting treatment adherence. The reason for being higher among females is related to immunity, spending much time indoors and undernutrition. Based on Table 1, 59% of newly female ART patients were undernourished. This finding was in line with a 34.5% TB prevalence among HIV patients from Nigeria.19 On contrary, it was higher compared to a study finding from the Amhara region20 and Arba Minch hospital,21 Ethiopia where the prevalence of pulmonary TB among ART patients was 22.7% and 21.4%, respectively. This variation might be related to differences in study periods (2020 vs 2014) and study area (All health facilities vs one to five hospitals).
Moreover, the majority (70%) of newly ART started people were undernourished based on the WHO criteria using their body mass index values. Over half, 59% of the undernourished ART people were females and only 32% of them got nutritional supports from the ART service areas and other concerned offices (Table 1). This implies that special attention is required to help ART patients, largely to females. This finding had disagreements with similar studies from Butajira hospital Ethiopia22 and Tanzania23 that reported 43% and 25.9% undernutrition in males, respectively. The possible justification for this discrepancy might be data sources where the comparison studies were only based on ART patients attending a single hospital but our study is a region-wide study that included all the ART patients in four years.
The Strength of this study relies on using large data sets that covered the second largest region of Ethiopia, assessing the incidence by time, place and person, and evaluating the contributions of TB-coinfection and undernutrition to HIV infection which was not assessed by the former studies.
This study has some limitations: The study is based on routine health facility data that might have data quality issues, mainly incompleteness. It is a quantitative descriptive study that did not show the associated risk factors of HIV infection through analytical and qualitative findings since it is based on secondary data that did not have more variables for analysis. In addition, the use of this findings needs caution to make generalization to the general population since it is a facility-based study.
Conclusion
The HIV infection remains a public health concern in the Amhara region of Ethiopia. A total of 57,293 new HIV cases were notified from 2015 to 2018 in the region and it was varied by time period, sex, age group and place. The adult population groups (25−49) accounted for 70% of total new HIV infections and over half of the HIV patients were females. The annual HIV incidence showed unstable trend in each year with the highest incidence in Dessie town, Bahir Dar city and Gondar town. TB co-infection and undernutrition were major reported problems among HIV patients with the highest magnitude reported among females. Only a few undernourished HIV patients received nutritional supports. All these indicated the presence of more undetected infectious HIV cases within the community. As a result, there is needed to give special attention in increasing community awareness and mobilization, improving access and quality of HIV screening and ART services, offer outreach HIV mobilization and screening services, and managing co-morbidities and undernutrition problems. Special attention is also required to avoid risk factors that increased HIV incidence among females.
Data Sharing Statement
All the data sets will be accessible from the corresponding author with a reasonable request.
Acknowledgments
We would like to express the deepest gratitude to Bahir Dar University for giving Ethical clearance. We also like to extend our thanks to the Amhara Regional Health Bureau for giving a supporting letter and data sets of the anlysis from the routine health information databases.
Disclosure
The author declared that there is no financial and non-financial competing interest in this work.
References
1. World Health Organization. Global HIV-AIDS update in 2018, 2019. available from: https://www.who.int.com.
2. UNAIDS. Global HIV & AIDS statistics facts in 2018, 2019. Available from https://www.unaids.org.
3. World Health Organization. HIV/AIDS statistics by World Health Organization. Available from: https://www.who.int.
4. USAIDs. Global HIV_AIDS Overview in 2017. 2018. Available from: https://www.unaids.org.
5. Yimer SA, Holm-Hansen C, Storla DG, Bjune GA. Tuberculosis management time: an alternative parameter for measuring the tuberculosis infectious pool. Trop Med Int Health. 2014;19(3):313–320. doi:10.1111/tmi.12246
6. Deeks SG, Overbaugh J, Phillips A, Buchbinder S. HIV infection. Nat Rev Dis Primers. 2015;1(15035):2016. doi:10.1038/nrdp.2015.35
7. Kibret GD, Ferede A, Leshargie CT, Wagnew F, Ketema DB, Alebel A. Trends and spatial distributions of HIV prevalence in Ethiopia. Infect Dis Poverty. 2019;8(1):90. doi:10.1186/s40249-019-0594-9
8. Federal HIV/AIDS Prevention and Control Office. HIV Prevention in Ethiopia National Road Map 2018-2020; 2018.
9. Gelaw YA, Magalhães RJS, Assefa Y, Williams G. Spatial clustering and socio-demographic determinants of HIV infection in Ethiopia, 2015–2017. Int J Infect Dis. 2019;82:33–39. doi:10.1016/j.ijid.2019.02.046
10. Girum T, Wasie A, Worku A. Trend of HIV/AIDS for the last 26 years and predicting achievement of the 90–90-90 HIV prevention targets by 2020 in Ethiopia: a time series analysis. BMC Infect Dis. 2018;18(1):320. doi:10.1186/s12879-018-3214-6
11. HAPCO. HIV Prevention in Ethiopia National Road Map; 2018.
12. Amhara Regional State. Ethiopian Government Portal; 2020.
13. USAIDS. HIV and AIDS in East and Southern Africa Regional Overview; 2017.
14. Central Statistical Agency. Ethiopia Demographic and Health Survey (EDHS) 2016: HIV Report. Addis Ababa, Ethiopia, and Rockville, Maryland, USA: CSA and ICF; 2016.
15. Amuche NJ, Emmanuel EI, Innocent NE. HIV/AIDS in sub-Saharan Africa: current status, challenges and prospects. Asian Pac J Trop Dis. 2017;7(4):239–256. doi:10.12980/apjtd.7.2017D6-366
16. EPHI, EFMoH, WHO: Ethiopian service availability and readiness assessment summary report, 2016.
17. Asemahagn MA, Alene GD, Yimer SA:. Geographic accessibility, readiness, and barriers of health facilities to offer tuberculosis services in East Gojjam Zone, Ethiopia: a convergent parallel design. Res Rep Trop Med. 2020;11:3–16. doi:10.2147/RRTM.S233052
18. SD G, Dauda E, Reuben CR. Prevalence of Tuberculosis in HIV/AIDS Patients in Lafia, Central Nigeria. Int J Curr Microbiol App Sci. 2014;3(6):831–838.
19. Mitku AA, Dessie ZG, Muluneh EK, Workie DL. Prevalence and associated factors of TB/HIV co-infection among HIV Infected patients in the Amhara region, Ethiopia. Afri Health Sci. 2016;16(2):588–595. doi:10.4314/ahs.v16i2.29
20. Dalbo M, Tamiso A. Incidence and predictors of tuberculosis among HIV/AIDS infected patients: a five-year retrospective follow-up study. 2014. doi:10.4236/aid201662010.
21. Gedle D, Gelaw B, Muluye D, Mesele M. Prevalence of malnutrition and its associated factors among adult people living with HIV/AIDS receiving antiretroviral therapy at Butajira Hospital, southern Ethiopia. BMC Nutri. 2015;1:5. doi:10.1186/2055-0928-1-5
22. Kabalimu TK, Sungwa E, Lwabukuna WC. Malnutrition and associated factors among adults starting on antiretroviral therapy at PASADA Hospital in Temeke District, Tanzania. Tanzan J Health Res. 2018;20:2.
23. Kabalimu TK, Sungwa E, Lwabukuna WC. Malnutrition and associated factors among adults starting on antiretroviral therapy at PASADA Hospital in Temeke District, Tanzania. Tanzania Journal of Health Research. 2018 Apr 8;20(2).
 © 2020 The Author(s). This work is published and licensed by Dove Medical Press Limited. The full terms of this license are available at https://www.dovepress.com/terms.php and incorporate the Creative Commons Attribution - Non Commercial (unported, v3.0) License.
By accessing the work you hereby accept the Terms. Non-commercial uses of the work are permitted without any further permission from Dove Medical Press Limited, provided the work is properly attributed. For permission for commercial use of this work, please see paragraphs 4.2 and 5 of our Terms.
© 2020 The Author(s). This work is published and licensed by Dove Medical Press Limited. The full terms of this license are available at https://www.dovepress.com/terms.php and incorporate the Creative Commons Attribution - Non Commercial (unported, v3.0) License.
By accessing the work you hereby accept the Terms. Non-commercial uses of the work are permitted without any further permission from Dove Medical Press Limited, provided the work is properly attributed. For permission for commercial use of this work, please see paragraphs 4.2 and 5 of our Terms.