")
Back to Journals » International Journal of General Medicine » Volume 16
EPAS1/HIF-2α Acts as an Unanticipated Tumor-Suppressive Role in Papillary Thyroid Carcinoma
Authors Zhang R , Zhao J, Zhao L
Received 23 February 2023
Accepted for publication 25 May 2023
Published 31 May 2023 Volume 2023:16 Pages 2165—2174
DOI https://doi.org/10.2147/IJGM.S409874
Checked for plagiarism Yes
Review by Single anonymous peer review
Peer reviewer comments 2
Editor who approved publication: Dr Scott Fraser
Rui Zhang,1,* Jianguo Zhao,1,* Lu Zhao2
1Department of Thyroid and Breast Surgery, Wuhan No.1 Hospital, Wuhan, 430030, People’s Republic of China; 2Department of Thyroid and Breast Surgery, Tongji Hospital Affiliated with Tongji Medical College of Huazhong University of Science and Technology, Wuhan, 430030, People’s Republic of China
*These authors contributed equally to this work
Correspondence: Lu Zhao, Department of Thyroid and Breast Surgery, Tongji Hospital Affiliated with Tongji Medical College of Huazhong University of Science and Technology, No. 1095 of Jiefang Avenue, Wuhan, 430030, People’s Republic of China, Email [email protected]
Background: Overexpression of hypoxia-inducible factors led to tumor angiogenesis and tumor progression. However, unlike HIF-1α, the role of EPAS1/HIF-2α in papillary thyroid carcinoma (PTC) was unknown. Here, we aimed to investigate the role of EPAS1/HIF-2α in PTC.
Material and Methods: EPAS1/HIF-2α expression of fresh frozen tumor samples and adjacent tissues in Tongji Hospital of 46 PTC patients was detected by RT-PCR. Gene expression datasets of PTC patients were gained from The Cancer Genome Atlas (TCGA) database. The Gene Ontology (GO), Kyoto Encyclopedia of Genes and Genomes (KEGG) and gene set enrichment analysis (GSEA) were used to explore the potential biological function of EPAS1/HIF-2α. The effect of EPAS1/HIF-2α on immune microenvironment of PTC was analyzed in R package “estimate”. The sensitivity to various targeted drugs was quantified in R package “pRRophetic”, while the sensitivity to immunotherapy was estimated based on TCIA website.
Results: We found higher EPAS1/HIF-2α mRNA expression in PTC was associated with lower N stage, M stage, and better progression-free time (PFS) and disease-free time (DFS). Further, biological function analysis indicated that EPAS1/HIF-2α was mainly involved in PI3K-Akt signaling pathway. EPAS1/HIF-2α expression was positively related with CD8+ T cell infiltration and negatively related to PD-L1 expression and tumor mutation burden. Patients with low EPAS1/HIF-2α expression were more than likely to get a profit from Sorafenib, Dabrafenib, Cetuximab, Bosutinib, and immune checkpoint blockade.
Conclusion: Our results suggested that EPAS1/HIF-2α played an unanticipated tumor-suppressive role in PTC. EPAS1/HIF-2α contributed to anti-tumor immunity by promoting CD8+ T cell infiltration and inhibiting PD-L1 expression in PTC.
Keywords: endothelial PAS domain-containing protein 1, EPAS1, prognosis, papillary thyroid carcinoma, immunotherapy, tumor mutation burden
Introduction
Papillary thyroid carcinoma (PTC) has significantly increased in the world over the past few decades,1 and it is the third most common solid malignancy.2 Most patients with PTC anticipated a relatively satisfactory clinical prognosis under the traditional therapy.3 However, part of PTC patients still posed the surgeons and oncologists a particularly difficult therapeutic challenge. Hence, a further exploration of the underlying molecular mechanisms involved in the unusually high aggressiveness events of PTC patients is clinically significant.4
Hypoxia is one of the key triggers for tumor cell migration and survival, which may induce aggressive molecular potentiality of malignant tumors.5 Moreover, HIFs are involved in the process of tumor immune escape. Under hypoxic microenvironment, activated HIFs induce activation of PD-1/PD-L1 pathway for tumor cascade events.6 HIFα is comprised of 3 alpha-subunits - HIF-1/2/3α,7 and it has been extensively studied in association with various human cancers.8
Hypoxia-inducible factor 2 alpha (HIF-2α), also known as Endothelial PAS domain-containing protein 1 (EPAS1) has been demonstrated in the past researches inducing tumor progression and growth in renal cancer9 and pancreatic cancer.10 Islam has shown that HIF-2α plays a tumor-promotion role in the esophageal squamous cell carcinoma.11 By contrast, HIF-2α was reported to inhibit progression of renal cell carcinoma.12 Similarly, HIF-2α was lower expressed in sarcoma relative to normal tissue and inhibited sarcoma proliferation through mTORC1 signaling. Whereby, HIF-2α is silenced during cancer progression in many cancers.13 Overexpression of HIF-2α increased tumor cell apoptosis and inhibited cell proliferation in glioma tumors,14 lung tumor15 and neuroblastoma tumor.16 Whether HIF-2α expression in PTC participates in the activation of signaling pathways that construct an immune microenvironment remains unknown. Xu reported that HIF-2α was down-expressed in PTC,17 and our study suggested that HIF-2α expression in PTC is positively correlated with a promising prognosis – progression free time (PFS) and disease-free time (DFS); besides, we demonstrated its association with tumor immune microenvironment. The sensitivity to targeted drugs and immunotherapy was quantified in R package “pRRophetic” as well as the sensitivity to immunotherapy in PTC.
Materials and Methods
Dataset
The gene expression profiles and clinical information of THCA samples were obtained from The Cancer Genome Atlas (TCGA) database and the UCSC Xena project (http://Xena.ucsc.edu/) (download in July 2022). A total of 512 thyroid carcinoma (including 499 PTC samples) and 59 normal thyroid tissues were enrolled in this study.
Papillary Thyroid Carcinoma Tissues and Adjacent Tissues
The tissues containing 46 PTC tissues and paired adjacent normal tissues were gained from Tongji Hospital, and these 46 tumor tissues were carefully picked out and pathologically verified as highly aggressive PTC subgroup, like tall cell variant or diffuse sclerosing variant, which can better meet our research purpose. HIF-2α mRNA (EPAS1) expression of PTC and adjacent tissues were detected by qRT-PCR.
qRT-PCR
Total RNA of the tissues was extracted by TRIzol reagent (Invitrogen). The expression of HIF-2α (EPAS1) was then determined using SYBR Green qPCR Mix (Toyobo, Shanghai, China). Primer sequences were as follows: EPAS1 Forward: 5’-TTGCTCTGAAAACGAGTCCGA-3’, EPAS1 Reverse: 5’-GGTCACCACGGCAATGAAAC-3’. GAPDH Forward: 5’-GAGAAGGCTGGGGCTCATTT-3’, GAPDH Reverse: 5’-TAAGCAGTTGGTGGTGCAGG-3’. Relative mRNA expression was calculated using the 2−ΔΔCT method, and GAPDH was used as an internal control.
Functional Enrichment Analyses
The Differentially expressed genes (DEGs) between high and low HIF-2α expression groups were analyzed through “limma” package and the screening threshold was |log2 (fold change)| > 1 and P < 0.05. Subsequently, the main biological function of the DEGs was discovered by GO and KEGG analysis. “clusterProfiler” package (4.4.4) was used by GSEA to elucidate the potential regulatory mechanisms through the analysis of the functional differences based on the low- and high-expression groups of HIF-2α, which was identified by an adjusted P value <0.05.
Estimation of Tumor Immune Infiltration
The relationship between tumor cells and tumor immune microenvironment (TME) is well recognized as a key clinical feature in multiple malignant tumors. With the CIBERSORT L22 as the reference, we analyzed the mRNA expression matrix using CIBERSORT R script acquired from the CIBERSORT website (http://cibersort.standard.edu/) (Supplementary Material). By using Monte Carlo sampling, we calculated an empirical P-value for the deconvolution of each case. To obtain the scores of multiple immunocytes, gene expression matrix was analyzed via “estimate” package and the correlation heatmaps between immune checkpoint genes and HIF-2α were visualized via “corrplot” package.
Estimation of the Sensitivity to Targeted Drugs and Immunotherapy
We assessed the IC50 of targeted drugs by “pRRophetic” package. The different responses to PD1 and CTLA4 treatments between the low and high expression of high and low HIF-2α expression groups were analyzed and visualized based on TCIA website via the “limma” and “ggpubr” packages.
Statistical Analysis
Differences in HIF-2α expression in PTC tissues and normal thyroid or adjacent tissues were analyzed using the Mann–Whitney test. The relationship between clinical characteristics and HIF-2α expression were analyzed using the Spearman’s analysis. The risk factors of neck lymph node metastasis were analyzed using logistic regression. Data were processed through R (V.4.1.3) and SPSS (25.0). Data were visualized with R (V.4.1.3) and GraphPad Prism (V.9.0). P value <0.05 was considered statistically significant, “*”, P < 0.05, “**”, P < 0.01, “***”, P < 0.001.
Results
The Expression and Prognostic Value of HIF-2α in PTC
Firstly, we analyzed and visualized the expression of HIF-2α in PTC using TCGA datasets, HIF-2α was significantly lower expressed in PTC than normal thyroid tissues (Figure 1A and B). For validation at the experimental level, we analyzed HIF-2α mRNA expression by qRT-PCR in 46 paired PTC and adjacent normal tissues, and we found that the mRNA expression HIF-2α was lower in PTC than in normal thyroid tissues (Figure 1C). In order to explore the clinical value of HIF-2α in PTC, the PTC dataset was obtained from the TCGA database and divided into High-HIF-2α (n = 249) and Low-HIF-2α (n = 250) group according to the median of HIF-2α expression level. KM survival analysis displayed that there was no significant difference between High-HIF-2α group and Low- HIF-2α group with respect to Overall Survival (OS) (Figure 1D), and the High-HIF-2α group was associated with better PFS comparing to the Low-HIF-2α group (P = 0.002) (Figure 1E), while DFS of the High-HIF-2α group was better compared with the Low-HIF-2α group as well based on GEPIA (P = 0.0017) (Figure 1F).
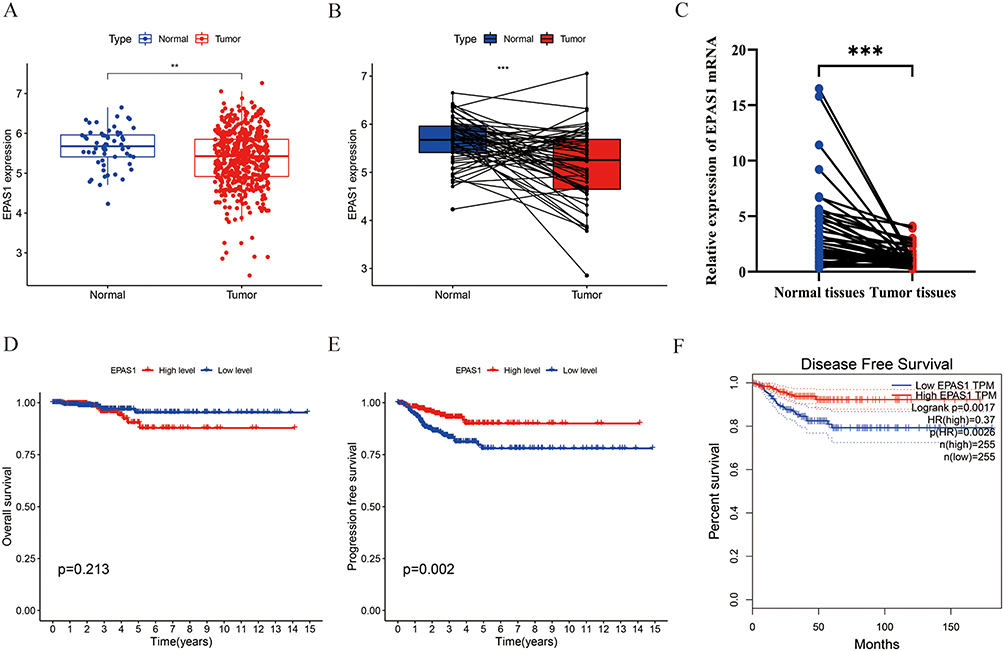 |
Figure 1 HIF-2α was lower expressed and associated with better prognosis in PTC. (A) HIF-2α was low expressed in PTC. (B) HIF-2α was low expressed in paired PTC tissues. (C) The mRNA level of HIF-2α was lower in PTC tissues. (D–F) The relationship between HIF-2α expression and OS (D), PFS (E), DFS (F) in PTC patients. “**”, P < 0.01, “***”, P < 0.001. |
The Clinical Value of HIF-2α in PTC
To investigate the clinical role of HIF-2α in PTC, the diversity in various clinical data between the Low HIF-2α and High HIF-2α groups was explored by the chi-squared test, and we showed that the high HIF-2α group was related to lower T stage, N stage, M stage, and TNM stage than low HIF-2α group (Figure 2C–F).
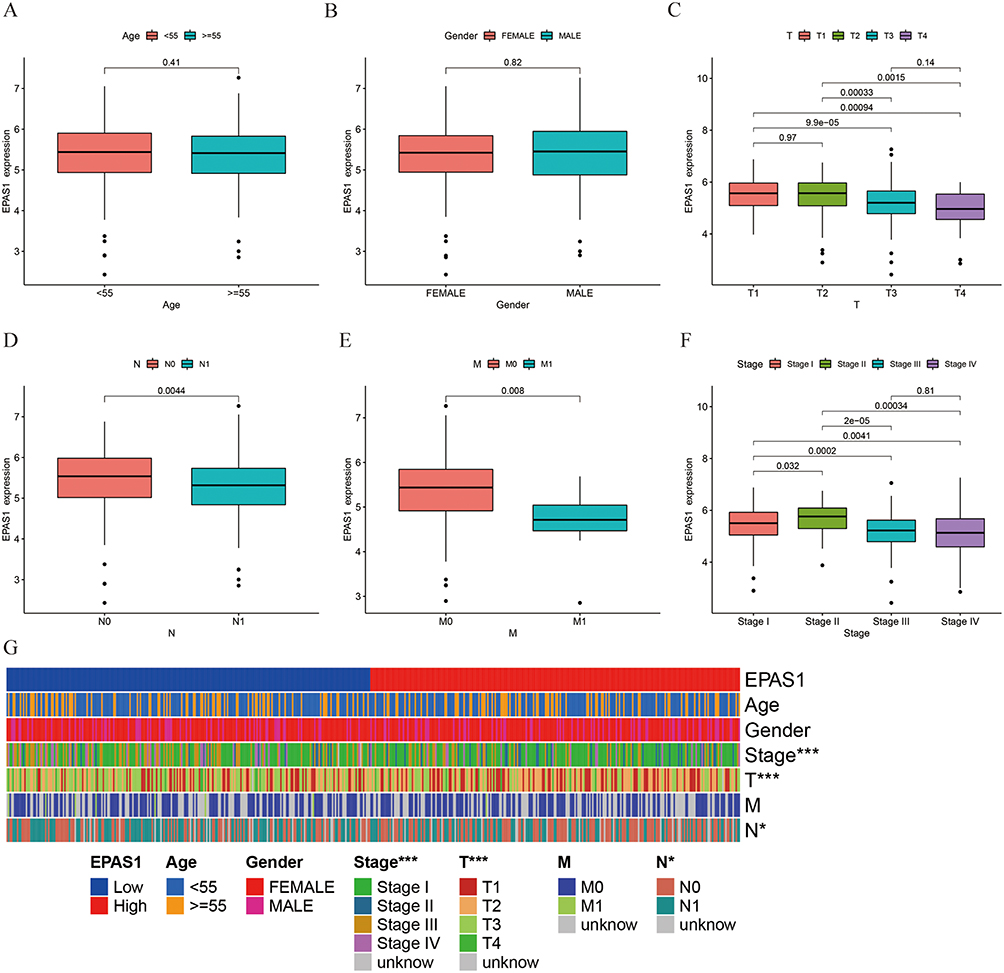 |
Figure 2 The HIF-2α was related with low TNM stage. (A and B) HIF-2α was not statistically related with age and gender. (C–F) The high expression of HIF-2α was related with lower T stage (C), N stage (D), M stage (E), and TNM stage (F). (G) The heatmap of relationship between HIF-2α expression and clinical characteristics in PTC. “*”, P <0.05, “***”, P <0.001. |
The Biological Functions of HIF-2α in PTC
We picked out significant differentially expressed genes (DEGs) based on the median expression between HIF-2α high-expressed and low-expressed groups, and 637 up-regulated and 325 down-regulated genes were identified statistically significant (|log fold change (logFC)| > 1, P < 0.05). The top 30 up-regulated DEGs and top 30 down-regulated DEGs were illustrated by the heatmap (Figure 3A). To better understand the function of 962 DEGs between high HIF-2α and low HIF-2α groups in PTC, GO and KEGG functional enrichment analysis was performed by “clusterProfiler” package. The top 5 association with biological process (BP) included regulation of hormone levels, vascular process in circulatory system, extracellular matrix organization, sodium ion transport, and transepithelial transport. Cellular components (CC) included apical part of cell, apical plasma membrane, external side of plasma membrane, collagen trimer, and brush border membrane. Molecular function (MF) included signaling receptor activator activity, receptor ligand activity, channel activity, passive transmembrane transporter activity, and cytokine activity (Figure 3B). The top 10 KEGG pathways included PI3K-Akt signaling pathway, Neuroactive ligand–receptor interaction, Cytokine–cytokine receptor interaction, Calcium signaling pathway, Focal adhesion, ECM–receptor interaction, ABC transporters, Viral protein interaction with cytokine and cytokine receptor, IL-17 signaling pathway, and Protein digestion and absorption (Figure 3C).
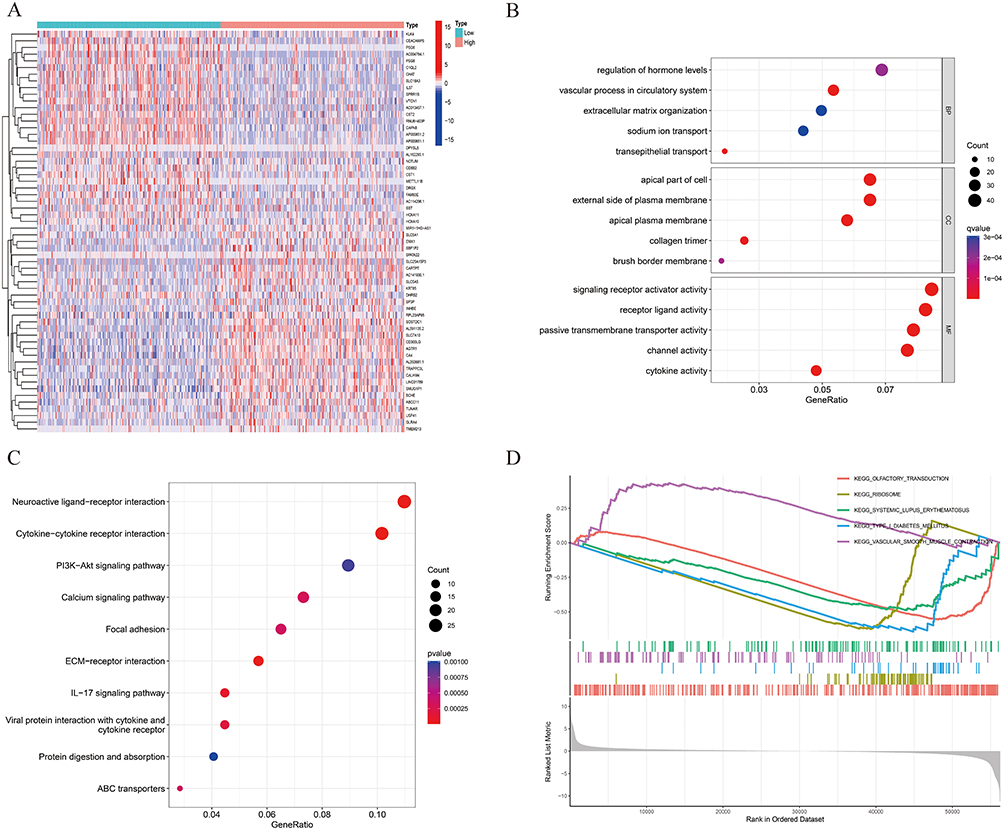 |
Figure 3 Function of HIF-2α. (A) DEGs between high and low HIF-2α expression groups. (B) GO and KEGG (C) analyses of DEGs based on HIF-2α expression. (D) GSEA analyses to explore the potential regulatory mechanisms. |
GSEA analysis was conducted to investigate the pathways in PTC with different HIF-2α expression levels. Significant differences (FDR < 0.05, adjusted P < 0.05) were observed in the enrichment of MSigDB Collection (c2.cp.kegg.v7.4.symbols.gmt and c5.go.v7.4.symbols.gmt) of these pathways – olfactory transduction (negative), ribosome (negative), type I diabetes mellitus (negative), vascular smooth muscle contraction (positive), systemic lupus erythematosus (negative) (Figure 3D).
The Relationship Between HIF-2α and Tumor Immune Microenvironment
It has been expounded that tumor immune cells (TICs) were widely existed in the TME of PTC and affect pathological processes, and PTC in the TCGA database was subdivided into high HIF-2α and low HIF-2α sets by HIF-2α median level. We quantitatively evaluated the immune infiltration by the ESTIMATE algorithm. ImmuneScore of low HIF-2α group was higher when compared with those of high HIF-2α groups (Figure 4A). Next, we analyzed the relationship between HIF-2α expression and various TICs, and the different proportion of 22 TICs in tumor tissues for the high and low HIF-2α expression groups were analyzed and shown in violin plots. We found that T cells CD8, T cells CD4 memory resting, T cells gamma delta, Macrophages M1, and Eosinophils were positively correlated with HIF-2α expression. T cells regulatory (Tregs), Macrophages M0, Dendritic cells activated, and Neutrophils were negatively correlated with HIF-2α expression, suggesting that HIF-2α affecting PTC prognosis by influencing the immune status of the TME (Figure 4B). In addition, HIF-2α expression was significantly positively related to the mRNA expression of immune checkpoint genes, such as CD27, CD200, CD160, and NRP1, whereas negatively related with the mRNA expression of immune checkpoint genes-CD724 (PD-L1 code gene) (Figure 4C). Besides, HIF-2α expression was negatively related with tumor mutation burden (TMB) in PTC as well (R = −0.2, P < 0.001) (Figure 4D).
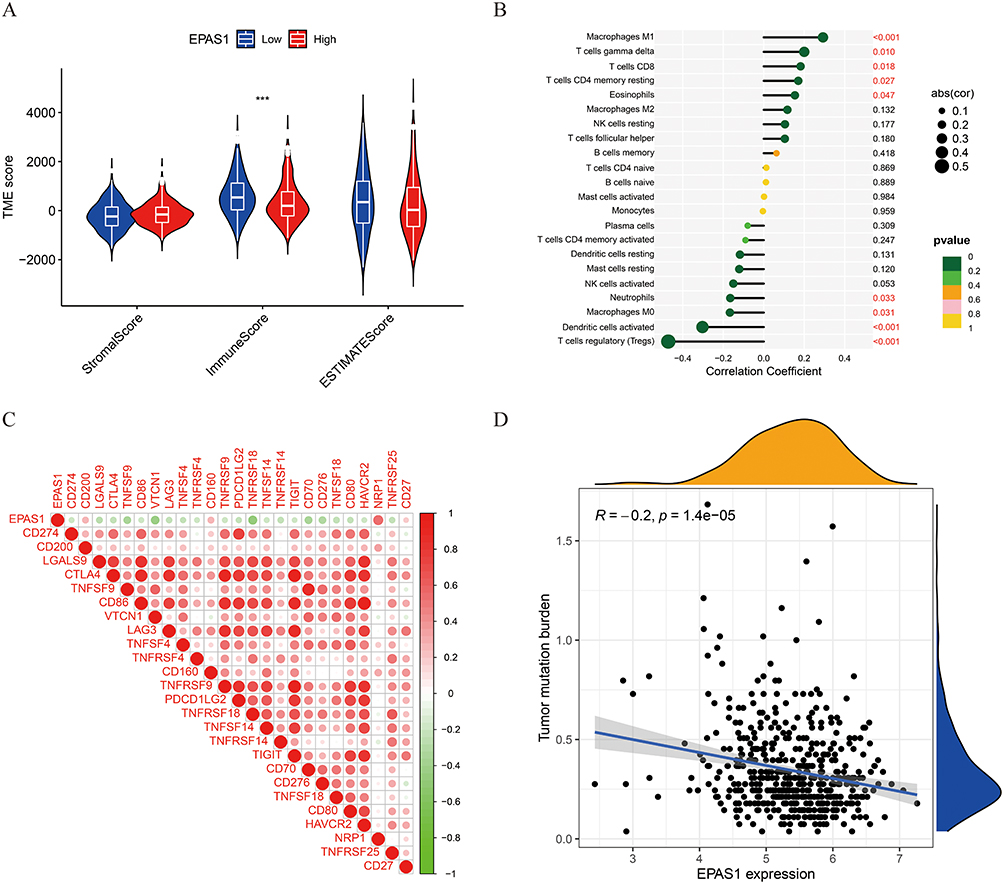 |
Figure 4 The relationship between TME, TICs, immune checkpoint genes and HIF-2α expression. (A) The relationship between HIF-2α expression and TME in PTC. (B) The relationship between HIF-2α expression and various types of tumor-infiltrating immune cells in PTC. (C) The heatmaps of relationship between HIF-2α expression and immune checkpoint genes. (D) The relationship between HIF-2α and tumor mutation burden (TMB) in PTC. “***”, P <0.001. |
HIF-2α Predicted the Sensitivity to Targeted Drugs and Immunotherapy
Targeted drugs have been demonstrated to be effective in PTC treatment. We calculated the IC50 of targeted drugs recommended for PTC therapy. PTC with low HIF-2α expression group was more sensitive to Sorafenib (multikinase inhibitor), Dabrafenib (BRAF inhibitors), Cetuximab (monoclonal antibody targeting the epidermal growth factor receptor (EGFR)), and Bosutinib (tyrosine kinase inhibitor), while PTC with high HIF-2α expression was more sensitive to Pazopanib (inhibitor targeting vascular endothelial growth factor receptor (VEGFR)) and AKT inhibitor VIII (Figure 5A–F). Furthermore, the treatment scores of immune checkpoints were estimated between the low HIF-2α group and the high HIF-2α group under the following treatment categories: without CTLA4 and PD1 treatment, PD1 treatment alone, CTLA4 treatment alone, and combined PD1 and CTLA4 treatment (Figure 5G–J). We showed that the PD-1 or combined PD-1 and CTLA4 treatment score in low HIF-2α group had a higher treatment score.
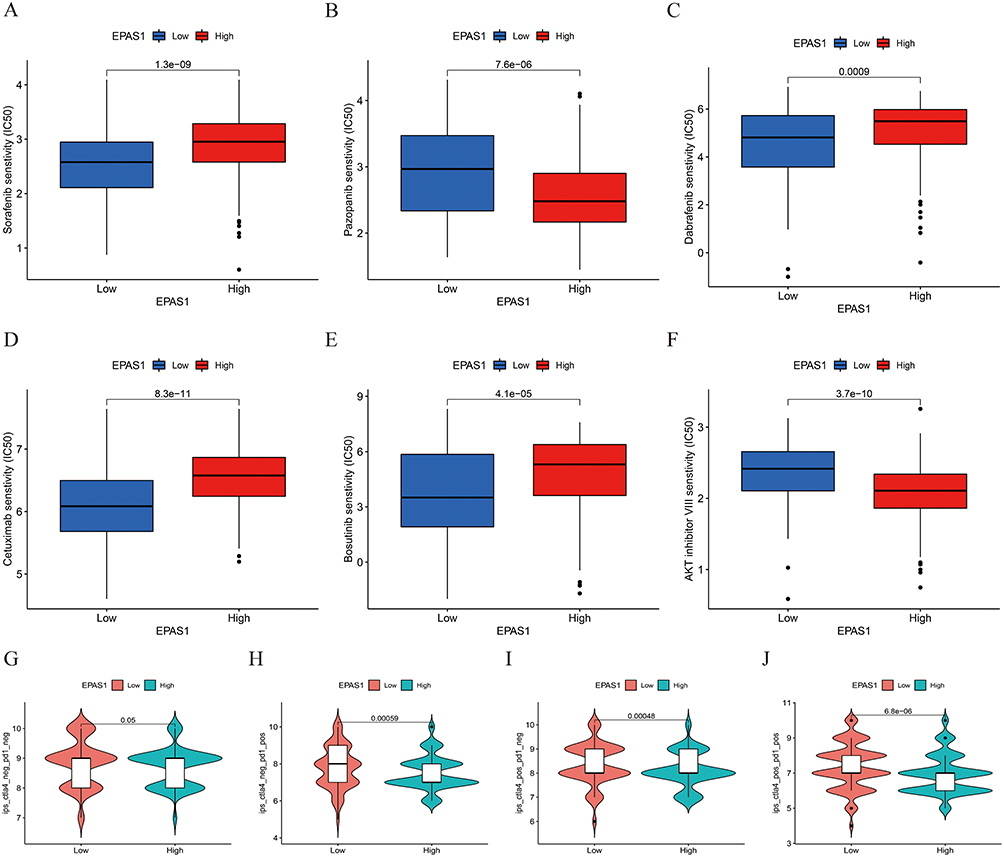 |
Figure 5 The evaluation of the predictive value of HIF-2α in targeted drugs and immunotherapy. (A–F) The IC50 of targeted drugs-Sorafenib (A), Pazopanib (B), Dabrafenib (C), Cetuximab (D), Bosutinib (E), and AKT inhibitor VIII (F). (G–J) The violin chart showed the treatment scores of immune checkpoints of the low HIF-2α and high HIF-2α groups without CTLA4 and PD1 treatment (G), PD1 treatment alone (H), CTLA4 treatment alone (I), and combined PD1 and CTLA4 treatment (J). |
Discussion
It has been widely recognized that hypoxia is essential to tumor angiogenesis and the high expression of HIFs is associated with a poor prognosis in human malignant tumors.18 HIF-1α and HIF-2α were related to tumor treatment response in the context of the complex immune TME, which highlights the important implications for translational therapy.19,20
Similar to other HIFs, EPAS1/HIF-2α protein was accumulated upon exposure of cells to hypoxia. HIF-2α was associated with various cancers, but its correlation with various malignant tumors was demonstrated to be different, for example, it played the tumor-promoting oncogenic functions in lung carcinoma,21 renal cell carcinoma,22,23 liver cancer,24 and so on, while the tumor-suppressive gene roles were reported in neuroblastoma, colorectal carcinoma, and glioma. Specifically, HIF-2α expression was associated with a better outcome of patients with neuroblastoma and low mortality risk tumors.16 In colorectal cancer, HIF-2α enhanced cell death through activating potentiated ROS and upregulating lipid and iron regulatory genes.25 However, HIF-2α’ function in PTC is still not clear.
In this article, we demonstrated the potential relationship between HIF-2α expression and clinical role of PTC patients. We found that lower HIF-2α mRNA level was associated with higher TNM stages and poor prognosis in PTC (Figures 1 and 2), and we found that HIF-2α may participate in PI3K-Akt signaling pathway (Figure 3C), and loss of HIF-2α would induce high immune score (Figure 4A) and infiltration of T cells regulatory, Neutrophils, Macrophages M0, and Dendritic cells activated (Figure 4B). Whereas HIF-2α was reported to be significantly higher in PTC than normal group and was correlated with lymph node metastasis,26 our findings found that HIF-2α plays an unanticipated tumor-suppressive role in PTC, which supported the idea of HIF-2α as a tumor protective gene.14–16,27 With respect to immune cell microenvironment, reduced CD8+ T cell infiltration in fresh tumor samples was correlated with high HIF-2α expression,28 and HIF-2α mRNA expression was demonstrated to be inversely correlated with gene clusters reflective of CD8 cytotoxicity. However, we found that high HIF-2α expression was correlated with increased CD8+ T cell infiltration (Figure 4B) and genes encoding components of CD8+ T receptor (CD27) (Figure 4C). Furthermore, tumor mutation burden (TMB), a biomarker of the response to immune checkpoint blockade, has gradually been revealed having an important prognostic value in immunotherapy. The PTC patients with high TMB were confirmed to be associated with higher tumor stages, higher recurrence rate and a worse prognosis.29 In our research, higher HIF-2α expression was associated with lower TMB (Figure 4D), which might explain the underlying mechanisms of higher score of the PD-1 or combined PD-1 and CTLA4 treatment in low HIF-2α group (Figure 5). Meanwhile, it is reported that PXR signal pathway promotes sorafenib resistance, HIF-2α interacts with PXR, activates PXR signal pathway and contributes to sorafenib resistance,30 which was also in accordance with our findings: low HIF-2α expression were more sensitive to Sorafenib (Figure 5A).
In conclusion, our results presented EPAS1/HIF-2α down-expressed in PTC patients. Additionally, low HIF-2α expression could be an independent prognostic risk factor and HIF-2α played an unanticipated tumor-suppressive role in PTC because of anti-tumor immunity via promoting CD8+ T cell infiltration and inhibiting PD-L1 expression. The clinical value of HIF-2α needs to be further confirmed by in vivo and in vitro experiments.
Data Sharing Statement
The datasets can be obtained from the first author or corresponding author on reasonable request.
Ethics Approval
All patients agreed to use their tissues and articles for publication. The study was approved by the ethics committee of Tongji Hospital affiliated with Tongji Medical College of Huazhong University of Science and Technology and complied with the Declaration of Helsinki.
Funding
This work was supported by the scientific research project of Wuhan Municipal Health Commission (WX20B10) and Health Commission of Hubei Province scientific research project (WJ2021M001).
Disclosure
The authors declare that the research was conducted in the absence of any commercial or financial relationships that could be construed as a potential conflict of interest.
References
1. Megwalu UC, Moon PK. Thyroid cancer incidence and mortality trends in the United States: 2000–2018. Thyroid. 2022;32(5):560–570. doi:10.1089/thy.2021.0662
2. Guo K, Qian K, Shi Y, et al. Clinical and molecular characterizations of papillary thyroid cancer in children and young adults: a multicenter retrospective study. Thyroid. 2021;31(11):1693–1706. doi:10.1089/thy.2021.0003
3. Ghossein R, Livolsi VA. Papillary thyroid carcinoma tall cell variant. Thyroid. 2008;18:1179–1181. doi:10.1089/thy.2008.0164
4. Cuomo F, Giani C, Cobellis G. The role of the kinase inhibitors in thyroid cancers. Pharmaceutics. 2022;14(5):1040. doi:10.3390/pharmaceutics14051040
5. Bhandari V, Hoey C, Liu LY, et al. Molecular landmarks of tumor hypoxia across cancer types. Nat Genet. 2019;51(2):308–318. doi:10.1038/s41588-018-0318-2
6. Wu Q, You L, Nepovimova E, et al. Hypoxia-inducible factors: master regulators of hypoxic tumor immune escape. J Hematol Oncol. 2022;15(1):77. doi:10.1186/s13045-022-01292-6
7. Galardo MN, Gorga A, Merlo JP, et al. Participation of HIFs in the regulation of Sertoli cell lactate production. Biochimie. 2017;132:9–18. doi:10.1016/j.biochi.2016.10.006
8. Gonzalez FJ, Xie C, Jiang C. The role of hypoxia-inducible factors in metabolic diseases. Nat Rev Endocrinol. 2018;15(1):21–32. doi:10.1038/s41574-018-0096-z
9. Schodel J, Grampp S, Maher ER, et al. Hypoxia, hypoxia-inducible transcription factors, and renal cancer. Eur Urol. 2016;69(4):646–657. doi:10.1016/j.eururo.2015.08.007
10. Garcia Garcia CJ, Huang Y, Fuentes NR, et al. Stromal HIF2 regulates immune suppression in the pancreatic cancer microenvironment. Gastroenterology. 2022;162(7):2018–2031. doi:10.1053/j.gastro.2022.02.024
11. Islam F, Gopalan V, Law S, Lam AK, Pillai S. Molecular deregulation of EPAS1 in the pathogenesis of esophageal squamous cell carcinoma. Front Oncol. 2020;10:1534. doi:10.3389/fonc.2020.01534
12. Hoefflin R, Harlander S, Schafer S, et al. HIF-1alpha and HIF-2alpha differently regulate tumour development and inflammation of clear cell renal cell carcinoma in mice. Nat Commun. 2020;11(1):4111. doi:10.1038/s41467-020-17873-3
13. Nakazawa MS, Eisinger-Mathason TS, Sadri N, et al. Epigenetic re-expression of HIF-2alpha suppresses soft tissue sarcoma growth. Nat Commun. 2016;7:10539. doi:10.1038/ncomms10539
14. Acker T, Diez-Juan A, Aragones J, et al. Genetic evidence for a tumor suppressor role of HIF-2alpha. Cancer Cell. 2005;8(2):131–141. doi:10.1016/j.ccr.2005.07.003
15. Mazumdar J, Hickey MM, Pant DK, et al. HIF-2alpha deletion promotes Kras-driven lung tumor development. Proc Natl Acad Sci USA. 2010;107(32):14182–14187. doi:10.1073/pnas.1001296107
16. Westerlund I, Shi Y, Toskas K, et al. Combined epigenetic and differentiation-based treatment inhibits neuroblastoma tumor growth and links HIF2alpha to tumor suppression. Proc Natl Acad Sci USA. 2017;114(30):E6137–E6146. doi:10.1073/pnas.1700655114
17. Xu Q, Gao S, Miao J. The relationship between autophagy-related genes and the staging and prognosis of thyroid cancer: a bioinformatics analysis. Gland Surg. 2021;10(8):2511–2527. doi:10.21037/gs-21-480
18. Wicks EE, Semenza GL. Hypoxia-inducible factors: cancer progression and clinical translation. J Clin Invest. 2022;132(11). doi:10.1172/JCI159839
19. Wigerup C, Pahlman S, Bexell D. Therapeutic targeting of hypoxia and hypoxia-inducible factors in cancer. Pharmacol Ther. 2016;164:152–169. doi:10.1016/j.pharmthera.2016.04.009
20. Cowman SJ, Koh MY. Revisiting the HIF switch in the tumor and its immune microenvironment. Trends Cancer. 2022;8(1):28–42. doi:10.1016/j.trecan.2021.10.004
21. Luan Y, Gao C, Miao Y, Li Y, Wang Z, Qiu X. Clinicopathological and prognostic significance of HIF-1alpha and HIF-2alpha expression in small cell lung cancer. Pathol Res Pract. 2013;209(3):184–189. doi:10.1016/j.prp.2012.10.017
22. Chen W, Hill H, Christie A, et al. Targeting renal cell carcinoma with a HIF-2 antagonist. Nature. 2016;539(7627):112–117. doi:10.1038/nature19796
23. Martinez-Saez O, Gajate Borau P, Alonso-Gordoa T, Molina-Cerrillo J, Grande E. Targeting HIF-2 alpha in clear cell renal cell carcinoma: a promising therapeutic strategy. Crit Rev Oncol Hematol. 2017;111:117–123. doi:10.1016/j.critrevonc.2017.01.013
24. Yang Y, Chen W, Mai W, Gao Y. HIF-2alpha regulates proliferation, invasion, and metastasis of hepatocellular carcinoma cells via VEGF/Notch1 signaling axis after insufficient radiofrequency ablation. Front Oncol. 2022;12:998295. doi:10.3389/fonc.2022.998295
25. Singhal R, Mitta SR, Das NK, et al. HIF-2alpha activation potentiates oxidative cell death in colorectal cancers by increasing cellular iron. J Clin Invest. 2021;131(12):1.
26. Liu YM, Ying SP, Huang YR, et al. Expression of HIF-1alpha and HIF-2alpha correlates to biological and clinical significance in papillary thyroid carcinoma. World J Surg Oncol. 2016;14(1):30. doi:10.1186/s12957-016-0785-9
27. Rawluszko-Wieczorek AA, Horbacka K, Krokowicz P, Misztal M, Jagodzinski PP. Prognostic potential of DNA methylation and transcript levels of HIF1A and EPAS1 in colorectal cancer. Mol Cancer Res. 2014;12(8):1112–1127. doi:10.1158/1541-7786.MCR-14-0054
28. Xiong Y, Liu L, Xia Y, et al. Tumor infiltrating mast cells determine oncogenic HIF-2alpha-conferred immune evasion in clear cell renal cell carcinoma. Cancer Immunol Immunother. 2019;68(5):731–741. doi:10.1007/s00262-019-02314-y
29. Guo M, Chen Z, Li Y, et al. Tumor mutation burden predicts relapse in papillary thyroid carcinoma with changes in genes and immune microenvironment. Front Endocrinol. 2021;12:674616. doi:10.3389/fendo.2021.674616
30. Shao QP, Wei C, Yang J, Zhang WZ. miR-3609 decelerates the clearance of sorafenib in hepatocellular carcinoma cells by targeting EPAS-1 and reducing the activation of the pregnane X receptor pathway. Onco Targets Ther. 2020;13:7213–7227. doi:10.2147/OTT.S246471
 © 2023 The Author(s). This work is published and licensed by Dove Medical Press Limited. The full terms of this license are available at https://www.dovepress.com/terms.php and incorporate the Creative Commons Attribution - Non Commercial (unported, v3.0) License.
By accessing the work you hereby accept the Terms. Non-commercial uses of the work are permitted without any further permission from Dove Medical Press Limited, provided the work is properly attributed. For permission for commercial use of this work, please see paragraphs 4.2 and 5 of our Terms.
© 2023 The Author(s). This work is published and licensed by Dove Medical Press Limited. The full terms of this license are available at https://www.dovepress.com/terms.php and incorporate the Creative Commons Attribution - Non Commercial (unported, v3.0) License.
By accessing the work you hereby accept the Terms. Non-commercial uses of the work are permitted without any further permission from Dove Medical Press Limited, provided the work is properly attributed. For permission for commercial use of this work, please see paragraphs 4.2 and 5 of our Terms.