Back to Journals » International Journal of Nanomedicine » Volume 16
Enhanced Oral Bioavailability of Epalrestat SBE7-β-CD Complex Loaded Chitosan Nanoparticles: Preparation, Characterization and in-vivo Pharmacokinetic Evaluation
Authors Alvi Z, Akhtar M ![]() , Mahmood A, ur-Rahman N, Nazir I, Sadaquat H, Ijaz M
, Mahmood A, ur-Rahman N, Nazir I, Sadaquat H, Ijaz M ![]() , Syed SK, Waqas MK, Wang Y
, Syed SK, Waqas MK, Wang Y
Received 25 September 2021
Accepted for publication 3 December 2021
Published 29 December 2021 Volume 2021:16 Pages 8353—8373
DOI https://doi.org/10.2147/IJN.S339857
Checked for plagiarism Yes
Review by Single anonymous peer review
Peer reviewer comments 2
Editor who approved publication: Dr Yan Shen
Zunaira Alvi,1 Muhammad Akhtar,1,2 Arshad Mahmood,3 Nisar ur-Rahman,4 Imran Nazir,5 Hadia Sadaquat,1 Muhammad Ijaz,6 Shahzada Khurram Syed,7 Muhammad Khurram Waqas,8 Yi Wang9
1Department of Pharmaceutics, Faculty of Pharmacy, The Islamia University of Bahawalpur, Bahawalpur, Punjab, 63100, Pakistan; 2Department of Medical Laboratory Technology, Faculty of Medicine and Allied Health Sciences, The Islamia University of Bahawalpur, Bahawalpur, Punjab, 63100, Pakistan; 3College of Pharmacy, Al Ain University, Abu Dhabi Campus, Abu Dhabi, United Arab Emirates; 4Department of Pharmacy, Royal College of Medical Sciences (RIMS), Multan, Punjab, 60000, Pakistan; 5Bahawal Victoria Hospital, Bahawalpur, Punjab, 63100, Pakistan; 6Department of Pharmacy, COMSATS University Islamabad, Lahore Campus, Lahore, Pakistan; 7Department of Basic Medical Sciences, School of Health Sciences, University of Management and Technology, Lahore, Pakistan; 8Institute of Pharmaceutical Sciences, University of Veterinary and Animal Sciences, Lahore, Pakistan; 9Center for Advanced Low-Dimension Materials, State Key Laboratory for Modification of Chemical Fibers and Polymer Materials, College of Chemistry, Chemical Engineering and Biotechnology, Donghua University, Shanghai, 201600, People’s Republic of China
Correspondence: Muhammad Akhtar Tel +92 300 6720628
Email [email protected]
Background: Epalrestat (EPL) is a carboxylic acid derivative with poor aqueous solubility and its pharmacokinetic features are not fully defined.
Purpose: Current research aimed to fabricate inclusion complexation of EPL with SBE7 β-CD (IC) and EPL/SBE7 β-CD CS NPs (NP).
Methods: EPL was complexed with SBE7 β-CD using the co-precipitation method, and the prepared complex was fabricated into nanoparticles using the ionic gelation method. The prepared formulations were characterized for particle size analysis, surface morphology, and in vitro dissolution study. The % inhibition of EPL against α-glucosidase enzyme was also conducted to check the drug’s antidiabetic activity. Finally, an in vivo pharmacokinetic investigation was carried out to determine the concentration of EPL in rabbit plasma of the prepared formulation. In vivo pharmacokinetic studies were conducted by giving a single dose of pure EPL, IC, and NP.
Results: The size of NP was found to be 241.5 nm with PDI 0.363 and zeta potential of +31.8 mV. The surface of the prepared NP was non-porous, smooth and spherical when compared with pure EPL, SBE7 β-CD and IC. The cumulative drug release (%) from IC and NP was 73% and 88%, respectively, as compared to pure drug (25%). The % inhibition results for in vitro α-glucosidase was reported to be 74.1% and the predicted binding energy for in silico molecular docking was calculated to be − 6.6 kcal/mol. The calculated Cmax values for EPL, IC and NP were 4.75± 3.64, 66.91± 7.58 and 84.27± 6.91 μg/mL, respectively. The elimination half-life of EPL was 4 h and reduced to 2 h for IC and NP. The AUC0-α for EPL, IC and NP were 191.5± 164.63, 1054.23± 161.77 and 1072.5± 159.54 μg/mL*h, respectively.
Conclusion: Taking these parameters into consideration it can be concluded that IC and NP have prospective applications for greatly improved delivery and regulatedt release of poorly water soluble drugs, potentially leading to increase therapeutic efficacy and fewer side effects.
Keywords: epalrestat, inclusion complexation, nanoparticles, HPLC, pharmacokinetic evaluation
Graphical Abstract:

Introduction
Glycosidase which facilitates the breakdown of glycosidic linkages is important in several biological functions, notably glucose metabolism, lysosomal glycoconjugate catabolism, and post-translational changes of glycoproteins.1 The digestion of starch and disaccharides, which are abundant in human nutrition, is proceeded by mammalian α-glucosidase in the mammalian brush border of the small intestine. Alpha-glucosidase inhibitors (AGIs) are saccharides that function as potent inhibitors of enzymes required for carbohydrate digestion, especially α-glucosidase enzymes in the small intestine. In the brush border of the small intestine, membrane-bound intestinal α-glucosidases to hydrolyze oligosaccharides, trisaccharides and disaccharides to glucose and other monosaccharides. Glucoamylase, sucrase, maltase and isomaltase are examples of these enzymes. Inhibiting these enzyme systems slow the pace of glucose breakdown. Because carbohydrates are not broken down into glucose molecules, less glucose is absorbed. The short-term impact of these pharmacological regimens in diabetic individuals is to lower current glucose levels. They inhibit the rise in postprandial blood glucose concentrations by around 3 mmol/L by delaying the carbohydrate absorption.2,3 Thereby suppression of glucosidase seems to have a substantial impact on polysaccharide metabolic rate, glycoprotein processing and cellular interaction, opening up new avenues for the innovation of new therapeutic strategies for diseases like diabetes, obesity and cancer and other types of infections. α-glucosidase present in the small intestine brush border could predominantly hydrolyze the glucose present at the terminal site thereby releasing glucose molecules.4,5
Epalrestat (EPL) is a carboxylic acid derivative, which plays a significant role in the treatment of diabetes-related chronic conditions (neuropathy, nephropathy, cardiopathy and retinopathy).6,7 It has been observed that EPL relieves diabetic neuropathic pain and decreases oxidative pressure in diabetics by lowering the lipid peroxidase concentration in red blood cells.8 EPL exhibits poor solubility and dissolution rate belongs to Class II of the BCS system of classification.9 It is therefore, necessary to increase the dissolution of EPL that may have a positive impact on the oral bioavailability. Moreover, it is necessary to demonstrate EPL pharmacokinetic activity to determine its pharmacodynamic effects. Even though EPL is used in the treatment of diabetic complications, only a few pharmacokinetic studies have been published.10,11
The pharma industry has been interested in nano-formulations for the past decade because of the improved drug release kinetics in the systemic circulation.12 Nanocapsules and nanospheres produced by various methods are examples of NPs.13 Many studies of chitosan (CS) in delivery systems such as gel, microparticles and nanoparticles (NPs) have been conducted over the decades.14–16 Low toxicity, improved bioavailability, biodegradability, mucoadhesive characteristic and ability to permeate beyond the mucosal barrier are all the attributes of chitosan as an excipient in formulations. It has been reported that fabrication of chitosan nanoparticles (CS-NPs) exhibited minimal toxicity at 30 μg/mL but possess anticancer property at a concentration greater than 100 μg/mL, supporting its use as a drug delivery system.17 Recently chitosan-cyclodextrin (CS-CD) nanocarrier systems have been developed by forming weak host-guest relationships known as “Inclusion complexation.” Cyclodextrins (CDs) have a cone shape truncated structure with a hydrophobic inner chamber and a lipophobic outer surface, allowing them to form a non-covalent inclusion complexation along with a broader spectrum of chemical and inorganic compounds.18 Many studies have revealed that complex formations in CDs, particularly various derivatives, can increase water solubility and oral bioavailability, shield instable drugs from deterioration, decrease the activity of multidrug resistance proteins like P-glycoprotein and modify drug pharmacokinetics.19,20 The rationale behind using the phenomenon of complexation was to improve the physical and chemical characteristics of the drug, resulting in an increased dissolution rate, decreased drug toxicity, enhanced drug release, and improved therapeutic performance.21 Because of these remarkable features of both the CS and NPs, CS NP have demonstrated a particularly bright future among pharmaceutical applications. Therefore, by implementing both strategies, we can combine the promising behavior of CS NPs with the increased biopharmaceutical characteristics of CDs.22 Oral administrations are a significant obstacle in EPL delivery due to EPL’s low water solubility and bioavailability.23,24 Ionic gelation is a promising method for manufacturing EPL-CD CS NPs that combines the advantages of CD and CS to suit the need of EPL through the oral route. Several investigations were conducted on drug NPs containing CS and CD.25–27 However, the type of CDs used in the experiments were limited and there is no reported research on EPL loaded NPs containing CS and SBE7 β-CD at the same time. In this study, the complexes of EPL/CD have been prepared by combining EPL and SBE7 β-CD, followed by EPL-CD CS NPs synthesis. The bioavailability of these test formulations was assessed and compared to that of pure EPL. All of these findings indicated that the NPs formulation can be used as an alternate oral preparation for EPL in the future.
Materials and Methods
Chemicals and Reagents
The chemicals and reagents mentioned are all purchased from commercial suppliers and have been used exactly as instructed. EPL (CAS No. 82159–09-9) was gifted by Symed Labs, Hyderabad, India, ACN (HPLC grade, CAS No. 75–05-8, Purity 99.9%, Merck, Darmstadt, Germany), KH2PO4 (MP, Biomedicals, China), perchloric acid (7601–90-3, Purity 70%, Sigma Aldrich, Germany), Milli-Q system (Millipore, USA) supplied HPLC quality water.
Methodology
Complex Formation of EPL with SBE7 β-CD
Equimolar amounts of EPL and SBE7 β-CD were precisely weighed. EPL was dissolved in 10 mL of acetone, and the calculated amount of SBE7 β-CD was dispersed in 5 mL of distilled water that had been warmed to 75 °C. Drop by drop to this solution was added the EPL solution at 75 °C. The mixture was stirred (VELP Scientifica, Usmate, Italy) for 60 min. Then it was allowed to cool to 25 °C before stirring again for 30 min. EPL precipitated from the solution. The solution was dried overnight at 45–50 °C in a hot air oven and coded as IC. The dried complex was stored in airtight light-resistant containers till further use.28,29
Preparation of EPL-SBE7 β-CD CS Loaded NPs
EPL-SBE7 β-CD loaded CS NPs were prepared in two steps. EPL was complexed with SBE7 β-CD using the co-precipitation method, followed by developing NPs using the method described below;
2 mg/mL of the complex aqueous solution was prepared by dispersing the powdered complex in water. The solution was stirred (VELP Scientifica, Usmate, Italy) to obtain a clear solution. CS solution was prepared by dispersing 10 mg of CS in 10 mL of acetic acid solution. To this CS solution was added the EPL-CD solution dropwise with continuous stirring for about half an hour. NPs were produced spontaneously while adding 1 mL (1% w/v) of sTPP solution with stirring at 700 rpm. In order to enhance the stability of the prepared NPs 17 μL of Tween 80 was added at this stage. The solution was centrifuged for 4 min at 12,000 rpm (Sigma-Zentrifugen, Osterode, Germany). Discarded the supernatant and respires the solution in water. The mixture was vortexed (IKA, MS2 minishaker, Germany) and lyophilized (lyophilizer, Christ Alpha 1–4 LD, Germany) to get nanoparticles which were labelled as NPs. The obtained NPs were kept in airtight, light resistant containers at 4 °C till further use.
Characterization
FT-IR
FT-IR (Fourier transform infrared spectroscopy) of EPL, SBE7 β-CD, CS, IC and NP was conducted by using ATR technology (α-Bruker, tensor, 27 series, Germany) by simply placing the test samples on the disc and securely compressing the plunger to hold the specimen on the disc plate. To evaluate the interaction of drug with excipients, the spectral analysis was taken with 32 scans operating at 600–4000 cm−1.30
PXRD
The diffraction analysis of EPL, SBE7 β-CD, CS, IC and NPs was determined through powder X-ray diffractometry (D-8, Advance Bruker, Germany) using X-ray operational parameters of 40 mA and a voltage of 40 kV. Cu Kα is the source of X-ray radiations. The samples were tested at a rate of 2/min in the temperature range of 20–65 °C. Peak frequency, shifts and locations of EPL, CD, CS, IC and NPs were examined and compared.31
DSC
Differential scanning calorimetry (DSC) was performed on EPL, SBE7 β-CD, IC and NP by placing 5 mg of test samples on an aluminum pan heated to 20–200 °C at a flow rate of 30 mL/min. As a standard, indium and zinc were used, while nitrogen was used as a purge gas.32
Particle Size Analysis
The diameter of the polymeric nanoparticles is crucial, as they need to be small enough to penetrate through semi-permeable cellular membrane and permit the nanoparticles to pass through the reticuloendothelial junction. The test sample of EPL loaded SBE7 β-CD CS NP was examined using DLS (Malvern Instrument, Malvern, UK). The prepared NP was dispersed in ultra-pure distilled water (1/5), maintained at 25±0.5 °C. Disposable cuvettes were used for the size analysis. Following dilution with 0.1 mM KCl solution, the zeta potential was measured.
Surface Morphology
The morphology and geometrical appearance of pure EPL, IC and NPs were evaluated using the SEM technique. The test samples were lyophilized prior to analysis, to remove the moisture and sprayed with gold on an aluminum pan wrapped with carbon adhesion film. The photographs were acquired at high resolution to have the best results.33
The NPs surface morphology was further evaluated through transmission electron microscopy (TEM). The voltage of TEM was adjusted to 200 kV. One drop of test sample was placed on the copper and was allowed to dry at room temperature before being examined.34
In Vitro Dissolution Study
The dialysis bag approach was used to study in vitro release assays of pure EPL, IC and NPs. The apparatus consisted of a glass beaker with release media of 100 mL of 0.1 M phosphate buffer, pH 6.8 maintained at temperature 37±0.5 °C. The weighed amounts of pure EPL, IC and NP were inserted in the dialysis bag that had previously been immersed in release media overnight. The clamps were used to secure the dialysis membrane’s open ends to prevent the medium from leaking. To preserve the sink condition, 3 mL of test samples were withdrawn and replaced with fresh buffer at 0, 0.25, 0.5, 0.75, 1, 1.5, 2, 3, 4, 6, 8, 10, and 12 h. Cellulose acetate syringe filters with a pore size 0.45 µm were used to filter each sample taken.35 The concentration of EPL in IC and NP was measured at 388 nm wavelength using a UV-Vis spectrophotometer and analyzed using DD-Solver (Microsoft Add-In) software.
Alpha-Glucosidase Enzyme Inhibition Activity
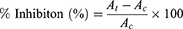
The mechanism of action of EPL against α-glucosidase enzyme was assessed using the methodology described by Kang and his coworkers in 2011 with small alterations.36 The substrate p-nitrophenyl-D-glucopyranose (PNPG, Sigma-Aldrich, Germany) solution was prepared using 0.2 M sodium phosphate buffer at pH 6.8. The 0.2 M sodium phosphate buffer solution was used as precursor solution 10 μL of 0.02 U/μL α-Glu in 0.2 M served as the precursor solution. Mix 10 μL of sample with 50 μL of buffer and incubate the reaction solution for 20 min in 8 μL dimethyl sulfoxide (DMSO) with varying concentrations of drug solution (1000, 500, 250, 125, and 62.5 μg/mL). After mixing 50 μL of 0.02 M PNPG, incubate the mixture for another 30 min. 100 μL of 0.2 M Na2CO3 solution was added to stop the reaction. The amount of p-nitrophenol released by PNP-glycosidase at 405 nm was measured using 96-microplates.36 The inhibitory rate of sample on α-Glu was calculated using the formula given in Equation 1.
Molecular Docking
The goal of computer aided molecular docking is to assess the non-covalent binding of the ligand with the receptor. In fact, forecasting the ligand binding to the receptor is essential, since it is applied to assess the drug discovery process. AutoDock version 1.5.6, vina and Discovery studio (Biovia, 2021) was used to predict the interaction site of EPL with α-Glu. A 3D structure of receptor and ligand was acquired through PubChem. Using OpenBabel software the files were transformed to pdb (Protein data bank) format. The ligand and the receptor files were processed using the AutoDock program. Finally, The Discovery studio/Biovia was utilized to visualize the collected data.37
Pharmacokinetics Evaluation
Instruments and Chromatography Conditions
Waters Gradient HPLC (Waters 2487 Dual absorbance detector, Waters 1525 Binary HPLC pump, Waters 717 Plus HPLC, Autosampler) was used to develop an HPLC method for analyses of EPL. The column used was BDS, C18, 250×4.6 mm. Empower 2 Software was used to analyze the data processing for sample analysis. Elution was carried out using acetonitrile:potassium dihydrogen phosphate (60:40) as mobile phase. The pH of the solvent system was checked with the help of a pH meter (Inolab Xylem Analytics, Germany) and adjusted to 4.0 using dilute orthophosphoric acid. In order to degas the mobile phase a sonicator (Elma, Transsonic Digitals, Germany) was used. The mobile phase was filtered using a vacuum filtration assembly (Membrane, Vacuubrand, Germany) with 0.45 μm millipore filter (Merck, Germany). The flow rate of the solvent system was 1 mL/min. The sample solution of 20 μL was injected through the elution port and measured at 388 nm of wavelength. Other instruments used were a vortex mixer (MS2 minishaker IKA, Germany), laboratory centrifuge machine (Sigma-Zentrifugen, Osterode, Germany), and a digital weighing balance (Shimadzu, Kyoto, Japan).
Method Validation
Animals
The Pharmacy Animal Ethics Committee (PAEC) at the Faculty of Pharmacy, The Islamia University of Bahawalpur (IUB), Pakistan was established following the guidelines of the European Medicines Agency on ethical use of animals in medicine testing that evaluated and approved the study protocols to use laboratory animals for this research project, letter no. 2020/21/PAEC dated on 17/09/2020. The investigation was carried out on eighteen adult rabbits (Oryctolagus cuniculus), provided by the Animal Facility Centre of the Faculty of Pharmacy, IUB, Pakistan. The animals were housed in a transitory room with 20±3 °C room temperature, 40% humidity and 12 h of day/night cycle. The animals were given a healthy diet, water and were properly tagged for identification. All the animals were stored in cages, throughout the period of dosing and sampling. Furthermore, all the selected animals were non-pregnant with average body weight of 2.5±0.1 kg. The animals were categorized into three separate groups of six animals in each group as stated below:
Control group/Group I: Oral administration of pure EPL
Test group 1/Group II: Oral administration of EPL-SBE7 β-CD complexation prepared through co-precipitation method (IC)
Test group 2/Group III: Oral administration of EPL-SBE7 β-CD complexed nanoparticles (NP).
Plasma Extraction
The rabbit's blood samples were taken by puncturing the jugular vein of rabbits. Before sample collection, the hair of the animals was removed using depilatory cream. The rabbits were kept in wooden rabbit carriers and 3 mL of blood samples were taken in EDTA tubes using disposable sterile syringes at specific intervals of time. The collected blood samples were centrifuged at 12,000 rpm for half an hour. The obtained plasma was kept at −70 °C before investigation. Before preparing different dilutions, the frozen plasma was placed at room temperature to convert it into liquid form. At this stage protein precipitating agent was added, such as perchloric acid. The resultant solution was vortexed for 3–4 min, followed by centrifugation at 12,000 rpm. The supernatant was collected and labelled in separate, clean Eppendorf tubes. Before injecting the samples into the system, the samples were filtered (0.22 μm syringe filters, PTFE, Agilent technology). The system and column were purged for about half an hour with a solvent system to get reliable results.
Pharmacokinetics Profiling and Quantification of EPL
PK Solver (Microsoft Excel Add-In) software was used to determine the pharmacokinetics of EPL in the selected groups. The log-linear trapezoidal method was used to calculate various parameters from plasma concentration and time curve, including the area under the curve from zero to infinity (AUC0-α), time to reach maximum concentration (Tmax), maximum concentration in plasma (Cmax), half-life (T1/2) and mean residence time (MRT).
Validation Method
To quantify the concentration of EPL in plasma a complete validation of technique was designed in accordance to US FDA guidelines. In order to assess specificity, linearity, precision and accuracy, limit of detection (LOD) and limit of quantification (LOQ), the calibration curve of EPL in plasma was constructed.
Specificity
The isolation of the EPL peak from unwanted peaks of plasma proteins and other components of the solvent system was used to determine the specificity. As a consequence, the selectivity of blank and spiked plasma was assessed. To verify that additional analysis of the sample matrix is separated from the parent components, a representative chromatogram was created. Rabbit plasma samples were thoroughly treated to get the highest possible analyte resolution. As a result, the proposed approach yielded outstanding results.38
Linearity and Standard Curve
By graphing the mean peak area against EPL concentration a calibration curve was plotted. Our method’s linearity was determined by evaluating at different concentrations. The predicted drug concentrations were plotted against the peak area. The correlation co-efficient, slope and intercept parameters were calculated using least square linear regression analysis.
Limit of Detection (LOD) and Limit of Quantification (LOQ)
LOD refers to the minimum concentration of test sample that can be differentiated by detection while the minimum concentration of analyte that can be successfully quantified using a given technique is known as limit of quantification (LOQ). The minimum plasma spiked concentration of the curve under which a sufficient degree of precision and accuracy (20%) attainted was used to calculate the LOQ.39 LOD is generally three times smaller than LOQ and therefore, calculated simply by dividing LOQ by 3.
Accuracy and Precision
Precision refers to the closeness of the observed values for a technique to be deemed appropriate. The value of relative standard deviation (RSD %) is commonly used to describe the precision. The smaller the value of RSD, the more accurate was the developed method. Repeatability and intermediate precision are the two key parameters of precision. Repeatability is achieved by preparing duplicates on the same day (intra-day) with same equipment, whereas intermediate precision was achieved by altering any of the two variables like changing day (inter-day) or using different equipment. The method’s intra-day variability was assessed using replicate analysis of five samples taken on the same day. The inter-day variation was also determined using replicate analysis of five validation samples on five separate days. Accuracy, often known as bias, is the degree to which outcomes match the real values. It is calculated by comparing the actual value to the mean observed values.40
Analysis Time
One of the key parameters in assessing the total examination time is the overall run time needed in an analytical technique as well as the use of chemicals or solvents, both of which have an indirect impact on the cost of analysis process. The run time for any method is usually 0–15 min., however, it might be varied depending upon the analyte used. The recommended method’s overall run time has been reduced to 15 min. The precision and accuracy of an analytical process can be harmed by reducing the run time.
Robustness
To test the effect on EPL separation, chromatographic conditions were changed intentionally. The flow rate has been increased by 0.2 units. The impact of the solvent system was investigated by varying the concentration of both the solvent (ACN:KH2PO4). The effect of column age was also investigated by comparing fresh column to responses from the column age 10, 15 and 30 days, while keeping other parameters constant.
Statistics
The obtained results were presented as mean with standard deviation (SD). For the concentration of drug in plasma of control groups and prepared formulations, a post hoc test with one-way analysis of variance (ANOVA) was applied. As a statistical tool, IBM SPSS Statistics version 23, was employed. The value of p < 0.05 indicated a significant difference.
Results
Characterization
FT-IR
The FT-IR method was used to identify unique absorption peaks in EPL, SBE7 β-CD CS, IC and NPs (Figure 1) The absorption spectrum for the pure drug (Figure 1A) at 1653.32 cm−1, is due to amide stretching. The distinctive peak at 1558.29 cm−1 proved the existence of thio-carbonyl stretching. The absorption band at 1717 cm−1 is caused by carboxylic acid stretching. Similarly, Furuishi and coworkers in 2017 also reported the occurrence of the same EPL peaks.41 The absorption band formed in the region of 3500–3000 cm−1 was due to O-H stretching, whereas, the absorption peak at 1195.10 cm−1 was because of C-N stretching. The spectrum analysis of SBE7 β-CD (Figure 1B) indicated that the peak at 3419.06 cm−1 appeared due to O-H stretching mode. The vibrating functional groups of -CH and -CH2 appeared in the range of 2800–3000 cm−1. At the absorption spectrum of 1636.24 cm−1, the H-O-H stretching was found. The stretching vibration of the C-O-C functional group causes a prominent distinctive peak at 1148.60 cm−1. Sulfoxide stretching was verified by the appearance of a strong peak at 1028.02 cm−1.42 The strong peak at 3401.88 cm−1 in the CS spectrum (Figure 1C) was caused by the bending of the O-H bond and intermolecular H-bonding, as well as N-H stretching of primary amines. The strong peaks at 1090.36 cm−1 and 1417.60 cm−1 are caused by symmetric C-O-C and C-N stretching respectively. The IR spectra of CS also shows N-H bending at 1581.44 cm−1, amide I at 1623.88 cm−1, amide II at 1581.44 cm−1, and amide III at 1336.21 cm−1,43 and the mode of vibration at 2887.94 cm−1 and 2969.57 cm−1 is a strong indicator of C-H stretching. The band at 1375.57 cm−1 proved the presence of the CH2-OH functional group. The infrared spectra of IC are shown in Figure 1D. The O-H vibrational stretching was seen throughout the frequency range, with the strongest band at 3600–3000 cm−1. The C-H vibrational stretching of EPL is also visible as seen by the peak at 2358.98 cm−1. There is also an overlapping effect for H-O-H bending of water molecules coupled to CDs as illustrated in the graph at 1635.88 cm−1 in the prepared complex all the basic peaks of aromatic amines, O-H bonds and carboxylic groups were seen for EPL. As a result, EPL is thought to have effectively complexed into the cavities of CD. The NPs spectrum can be seen in Figure 1D. EPL characteristic N-H and C-O bonding extended at 1694.18 cm−1 and 1743.42 cm−1, respectively. The absorption band of O-H stretching was discovered in the spectra of all NPs at 1537.38 cm−1, and the thio-carbonyl stretching was observed in the spectra of all NPs at 3300–3000 cm−1. The C=O group of EPL with the frequency shifting reflected in the spectrum that the drug’s behavior remained intact and no compatibility was seen when CD complexed EPL was inserted into the nano-system. The cross-linking of CS and sTPP demonstrated no change in chemical interaction, confirming that NPs were successfully manufactured.
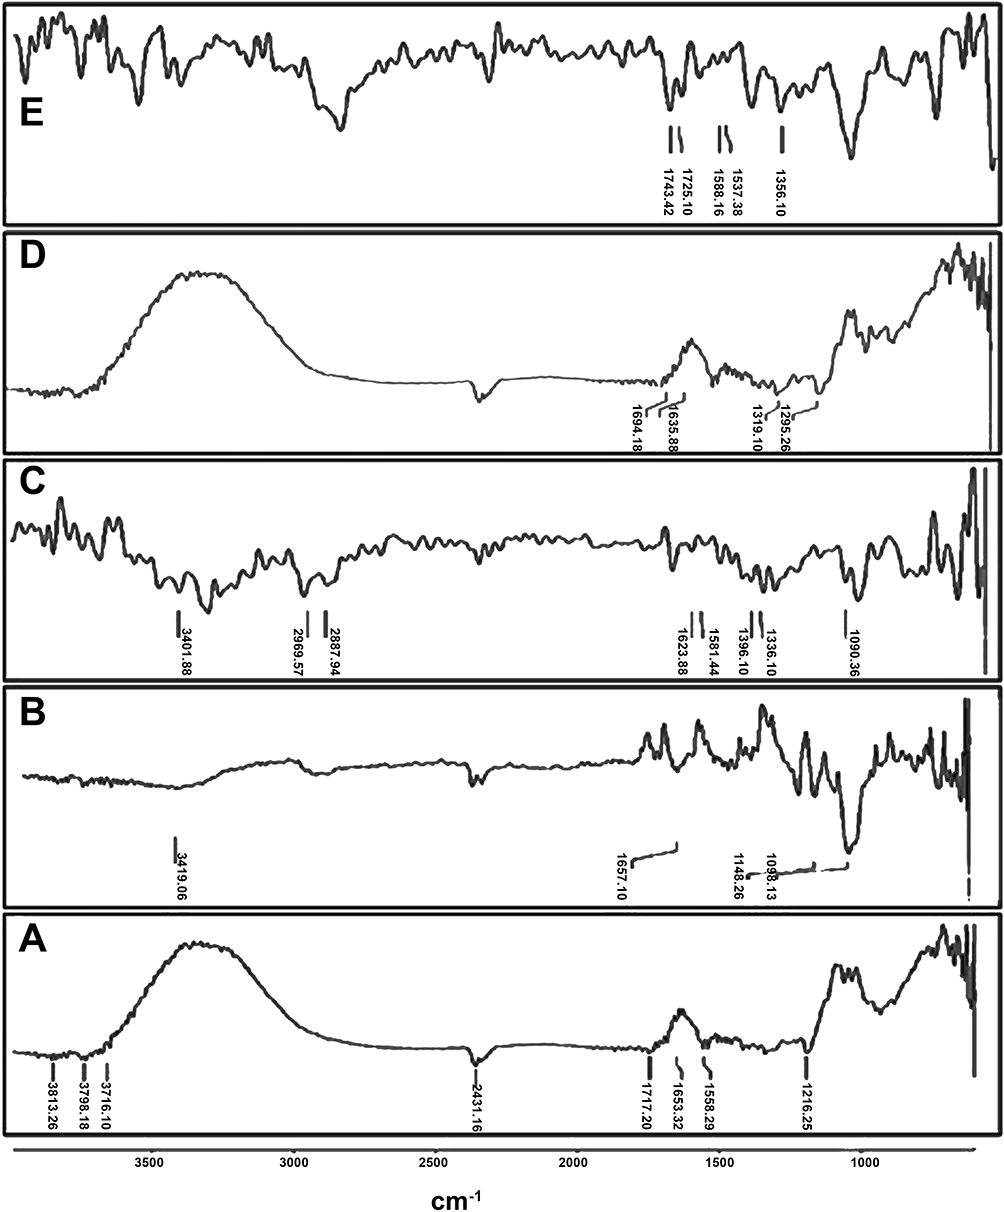 |
Figure 1 FT-IR of epalrestat (A), sulfobutyl ether7 β-cyclodextrin (B), chitosan (C), prepared complex IC through co-precipitation (D), prepared nanoparticles NPs through ionic gelation method (E). |
PXRD
Powder X-ray diffraction (PXRD) analysis is a prominent method for determining the crystallinity of a material. Figure 2 depicts the X-ray diffraction behavior of EPL. PXRD revealed the crystalline character of pure EPL, revealing distinctive, comparatively sharp, less diffuse peak values at 20–25° and 30–40°, which are remarkably close to the peaks of EPL as reported by Furuishi and co-workers.41 The diffractogram of CS revealed a peak at 20–35°, indicating that CS is crystalline, with a crystal lattice of 4.075.44 As illustrated in Figure 2 the halo pattern with no strong peaks suggested the amorphous phase of CD derivative for SBE7 β-CD. The prepared complex IC exhibited the less intense and more dispersed peaks. The crystalline nature of EPL was changed into an amorphous form in the prepared complex, which improved the drug’s aqueous solubility. Because EPL is complexed with CDs in the prepared NPs, peak intensities were reduced and the diffused pattern was seen. The characteristic crystal peak of EPL merged and vanished, most likely due to the hydrophilic nature of CDs which give wetting properties and hence improve water solubility.
 |
Figure 2 Powder X-ray diffraction analysis of EPL (epalrestat), SBE7 β-CD (sulfobutylether7 β-cyclodextrin), CS (chitosan), IC (inclusion complex), NPs (EPL complexed SBE7 β-CD loaded CS nanoparticles). |
DSC
The thermodynamics of EPL, SBE7 β-CD, IC and NP were examined using DSC to estimate the thermal behavior of drug, excipient and formulations as shown in Figure 3. The DSC of pure EPL revealed a peak at 200–250 °C, indicating the crystalline nature of the drug. Because SBE7 β-CD is amorphous, it has a minor endothermic peak at 200 °C. The SBE7 β-CD demonstrated a large endothermic peak at a temperature exceeding 200 °C due to the loss of water molecules. The endothermic peak of EPL in the solid complex generated by co-precipitation technique diminished, lowering the crystalline nature of the pure drug. EPL aqueous solubility was improved when its crystallinity was reduced. The board endothermic peak of SBE7 β-CD vanished as well, demonstrating that EPL is diffused in the cavity of CD. The thermogram of NP (Figure 3D) indicated an endothermic peak, which was most likely caused by the endothermic peak produced by EPL and CD. Furthermore, the appearance of an exothermic peak between 250–300 °C might be attributable to SBE7 β-CD.
 |
Figure 3 Differential scanning calorimetry of A. epalrestat, B. sulfobutyl ether7 β-cyclodextrin, C. prepared complex (IC), D. prepared nanoparticles (NPs). The samples were heated at temperature ranges between 20-200 °C at a flow rate of 30 ml/min. |
Particle Size Analysis
The most important parameter while fabricating NPs are the required size because these nanometer molecules have to cross the cellular membrane to reach the target site. The particles with much smaller diameter may result in more efficient drug dispersion. In this research study, NP was synthesized in a two step procedure. In the first step, a co-precipitation approach was used to produce an inclusion complexation between EPL and SBE7 β-CD. In the next step, CS/sTPP NPs were produced through the ionic gelation method. In fact, this unique interaction of CS and CD along with ionic interaction with sTPP is incorporated into the NP creation process for successful fabrication of NPs. The result of particle size and zeta potential are shown in Figure 4. The size of the prepared NP was found to be in the nano-metric range with low poly dispersity index and a positive zeta potential value. The obtained size of developed NP was 241.5 nm, indicating that complexing EPL with SBE7 β-CD had no significant effect on the diameter of NPs (Figure 4A). Another important factor in determining the homogeneity of the dispersal is the poly dispersity index (PDI). PDI value was reported to be 0.363 indicating the stability of the particles. As a result, homogeneous size distribution with nanoscale range was achieved in our study. The synthesis of EPL/SBE7 β-CD CS NPs had a significant impact on total zeta potential (ζ) as given in Figure 4B. The value of ζ was +31.8. The positive value of the NP showed that the charge on the surface of CS was not hidden which is very important when making NP from SBE7 β-CD.45 The positive value for zeta potential is essential to prevent particle-particle agglomeration and to encourage particle contact with biological membrane.46,47
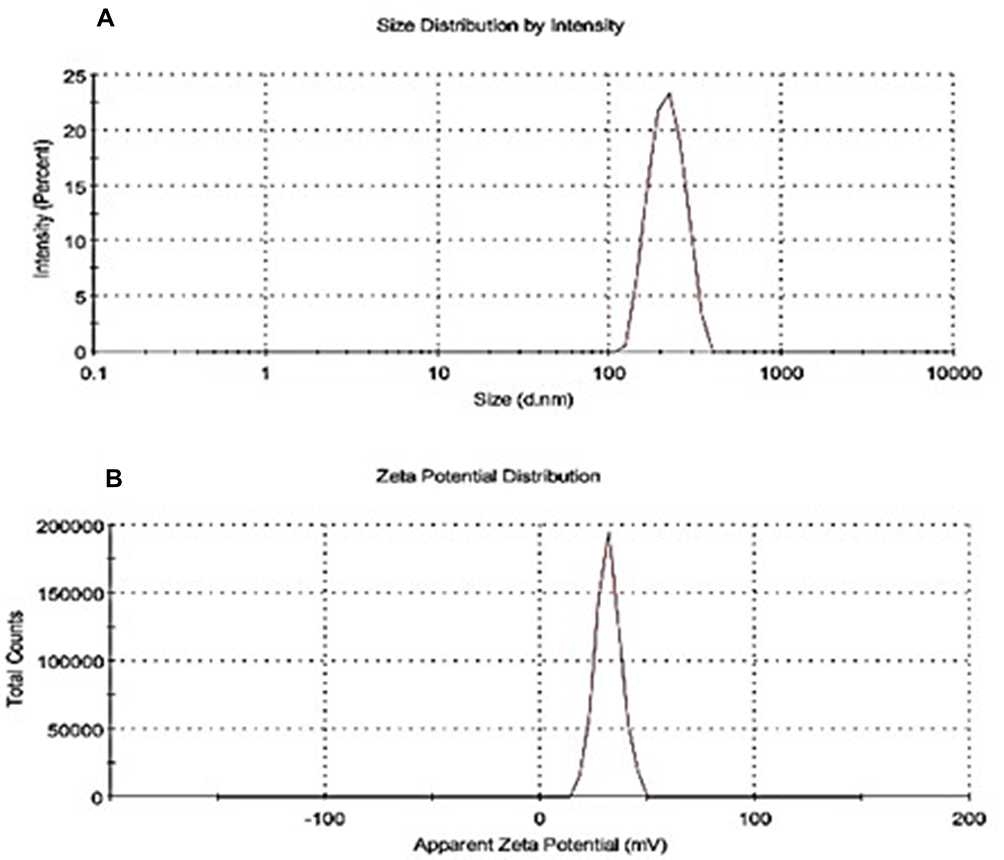 |
Figure 4 (A) Particle size analysis of EPL/SBE7 β-CD CS NPs in ultra-pure water (1:5) maintained at 25±0.5 °C, with 0.1 mM KCl dilution with mean particle size of 241 nm. (B) Zeta potential of EPL/SBE7 β-CD CS NPs with positive values of +31.8±5.90 mV. Abbreviation: EPL, epalrestat; SBE7 β-CD, sulfobutyl ether7 β-cyclodextrin; CS, chitosan; NPs, nanoparticles; KCl, potassium chloride. |
Surface Morphology
Scanning electron microscopy technique was used to evaluate the morphology of EPL, SBE7 β-CD, IC and NP. According to the results as shown in Figure 5, pure EPL seems to have a crystal structure with varying forms and sizes (Figure 5A). The method used to complex EPL to SBE7 β-CD preserved the geometry of the EPL crystal, adhering to the surface of SBE7 β-CD (Figure 5C). However, the surface characteristics of IC revealed an arbitrary structure that was distinct from that of EPL and SBE7 β-CD.47 SEM images of NP are shown in Figure 5D and the result demonstrated that drug loaded NP has a smooth shape and well-defined porosity. The smooth surface of NP was due to the amorphous nature of the formulation with nano-sizes diameter.
 |
Figure 5 Scanning electron microscopy of (A) epalrestat, (B) sulfobutyl ether7 β-cyclodextrin, (C) prepared complex (IC), (D) prepared nanoparticles (NPs) at 2 μm. |
The shape of the prepared NPs was investigated by TEM analysis. According to Figure 6, the NPs are in the nano-size range, which is consistent with the SEM results.48 The results are additionally validated by the DLS test, which demonstrated the correct size distribution of NPs.
 |
Figure 6 Transmission electron microscopy of prepared nanoparticle (NPs) at 1 μm. |
Modified In Vitro Drug Release Study
To investigate the influence of EPL release from IC and NP, a modified in vitro drug release study was conducted in phosphate buffer (pH 6.8) maintained at 37±0.5 °C The result of the drug dissolution profile is shown in Figure 7. Due to the hydrophobic nature of the drug, pure EPL had a cumulative drug release of around 20–25%. Inclusion complexation and development of NPs were used to overcome this obstacle. The emergence of soluble complexation between drug and SBE7 β-CD was revealed to be responsible for 73.41% of IC drug release. On the other hand, 30% of drug released from NPs system was released in a rapid burst that lasted about 30 minutes. After that, the drug slowly releases from the system. After 12 hours, 90% of the drug has been released from the nanoparticulate system. The greater release impact of SBE7 β-CD can explain why EPL was released at a much faster rate from EPL/SBE7 β-CD CS NPs.
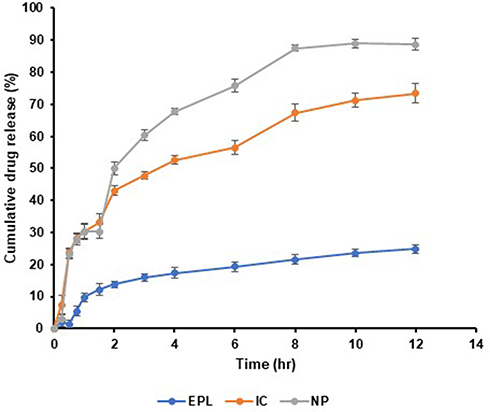 |
Figure 7 In vitro dissolution studies EPL (eplrestat), IC (prepared complex), NPs (prepared nanoparticles) in 100 mL 0.1 M phosphate buffer pH 6.8 maintained at 37±0.5 °C. |
α-Glucosidase Inhibitory Activity
Glucosidase that cleaves glycosidic linkages to release glucose molecules from the non-reducing terminal of either oligosaccharides or polysaccharides is deemed to be a highly promising target. Besides that, alpha glucosidase inhibitors have been used to treat patients with type II diabetes or patients with poor glycemic control by preventing carbohydrates from being absorbed from the gastrointestinal tract. Using the α-glucosidase for screening % inhibition, we examined the inhibitory efficiency of epalrestat against α-glucosidase. For this purpose, α-glucosidase inhibitory effects were studied, and the findings revealed that EPL potency against α-glucosidase enzyme inhibition was greater than 70%. When compared with the standard, the inhibitory impact was determined to be in the range of 1000–62.5 μg/mL. At a concentration above 62.5 μg/mL, EPL strongly inhibited the enzyme as measured by %inhibition given in Figure 8. When using a concentration of 1000 μg/mL, the highest % inhibition of 74.17% was found. The results were quite satisfactory when compared to that reference standard having a %inhibition value of 94.7%. As a result, the data acquired from our findings confirmed that EPL has potency to inhibit α-glucosidase and can thus be used to treat diabetes mellitus.
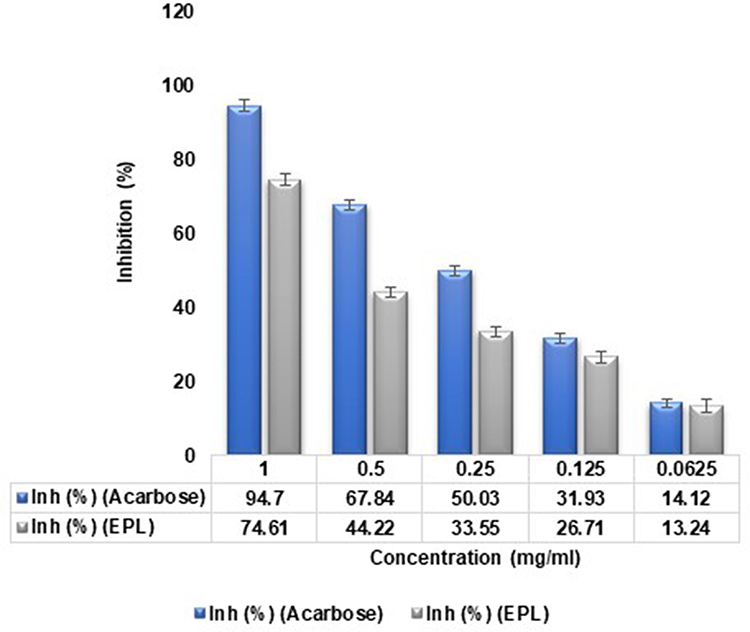 |
Figure 8 Alpha-glucosidase inhibitory effects of epalrestat (EPL) in comparison to standard drug acarbose at 405 nm by using 96 microplates. |
Computer Aided Simulation Studies
In order to understand the interaction between EPL and α-glucosidase active site, it was subjected to molecular modelling aided by docking tools (AutoDock and Vina) and Biovia/Discovery studio. By attaching to a specific protein or ligand, proteins improve overall efficiency of their bioactivity. Delivery system, biochemical pathway and protein mode of action contributed towards the efficient binding of the receptor to the ligand. The structure of enzyme α-glucosidase was acquired from RCSB as shown in Figure 9A in protein data bank (pdb) format. The ligand (Figure 9B) attached with a protein molecule was removed from the binding site, and the grid box was positioned in such a manner so as to perform blind docking. The grid box center coordinates were adjusted to x = −9.31, y = −12.598 and z = 11.653. The parameter of size for x, y and z dimensions were 60, 62 and 92 respectively. The grid point spacing of 1°A was chosen to completely encircle the binding site. The components, tautomers and proton transfer state as well as polar hydrogens and ligand location were all modified. Partial charges were added to the ligand in the dataset, proceeded by total energy minimization, to produce the stable conformation. Ultimately, the inhibitory effects of EPL on glucosidase was explained by determining the binding mode of EP with glucosidase (Figure 9C). As shown in Figure 9D the receptor interacts with the ligand through conventional H-bonds at TRY A:8, GLY A:265, HIS A:292, carbon-hydrogen bonding at ASP A:261, Pi-alkyl at MET A:6. In this simulation study, the computed binding affinity value was calculated to be −6.6 kcal/mol. The negative value for the binding affinity resulted in a more stable protein-ligand interaction. The optimum 2D structural position between the ligand and the receptor is represented in Figure 9E.
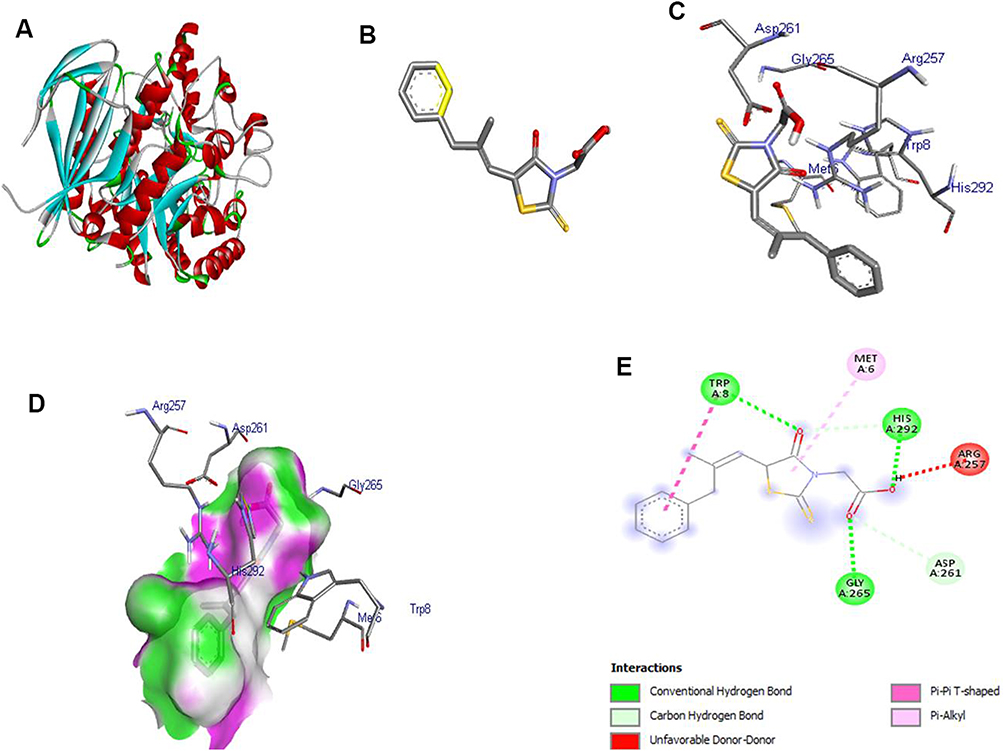 |
Figure 9 (A) 3D structure of α-glucosidase (receptor), (B) 3D structure of EPL (ligand), (C) docking of receptor and ligand, (D) 3D structure of ligand-receptor containing H-bond, (E) 2D structure of receptor-ligand interaction. |
In Vivo Pharmacokinetic Analysis
Method Development
Any chromatographic technique must begin with optimization of the method developed. The purpose of optimization is to get a high resolution, sensitivity, precision, accuracy and reproducibility. Different columns of particles, size 5 μm were tested during the development of methods like hypersil BDS C18 (250×4.6 mm), hypersil ODS (250×4.6 mm), hypersil ODS (150×4.6 mm) and others. Furthermore, a number of mobile phases were tested by varying the ratio of organic and aqueous components or tested buffers in different ratios with water, ACN and methanol. Three different phosphate buffers, ammonium dihydrogen phosphate, potassium dihydrogen phosphate and sodium dihydrogen phosphate, were tried with the goal of achieving the best separation of EPL in the pH ranges between 2–8. Asymmetric peak was identified at higher values of pH. As a result, the pH range is 2–4 on the lower side. After testing a number of columns, hypersil BDS C18 (250×4.6 mm, 5 μm) was selected for HPLC study. From the tested buffers, KH2PO4 produced the requisite symmetrical peak of the drug. Furthermore, the mobile system having KH2PO4 and ACN (60:40) with pH 3.0 resulted in sufficient peak symmetry. Increasing the pH to 4 and changing the composition of KH2PO4 and ACN to 40:60 resulted in a sharp peak with high resolution. Thus, in terms of shape of peak, retention time and sensitivity, a mobile system composed of ACN and KH2PO4 (60:40) with pH 4 adjusted using orthophosphoric acid was found to be optimal. A flow rate of 0.5–1.5 mL/min was also investigated. It has been noted that an optimal and reliable separation time was attained at a flow rate of 1 mL/min. The EPL retention time in this approach was found to be 9–10 min, although the overall analysis duration was retained at 15 min. The peak response was also determined while scanning the wavelength in the range of 190–800 nm50 EPL has a maximum absorption at 388 nm, which has been chosen for the study. During the analysis, the temperature was kept at 25 °C and pressure was adjusted at 108–116 bars.
Plasma Calibration Curve
An EPL calibration curve was prepared in spiked plasma with known concentration and dilution ranges between 0.02–10 μg/mL. The mean area of repeated injections was plotted against the corresponding concentrations. In order to create a straight line, linear regression has been used as shown in Figure 10. The values of b-intercept and y-intercept were found to be 41.79 and 783.82, respectively. The linearity co-efficient R2 was 0.999 indicating that the methodology behaved linearly over this range.
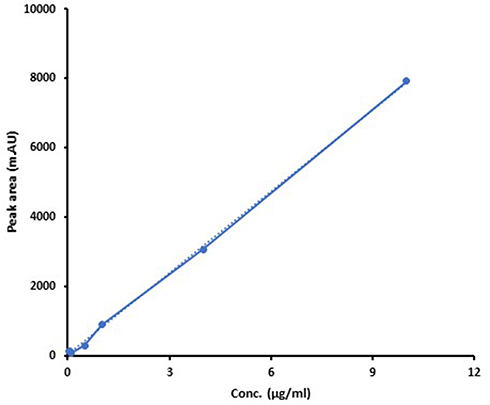 |
Figure 10 Standard curve of EPL in different concentrations of blank plasma rabbit (R2= 0.999). |
Working Range
The maximum and minimum concentration of analyte within which the system response remained linear, precise, and accurate are defined as the method’s working range.51 Because the method remained linear throughout the concentration range of 0.02–10 μg/mL of EPL in plasma rabbit, therefore, this range has been designated as the working range of EPL in the plasma of rabbits.
Isolation and Selectivity
EPL was effectively isolated from rabbit plasma in less than 15 min of total run time. EPL had a retention time of 9.9–10.2 with no endogenous emergence of plasma peaks. The isolation of EPL from plasma was good at optimized chromatographic conditions. Figure 11 showed typical chromatograms of EPL without added plasma and with plasma.
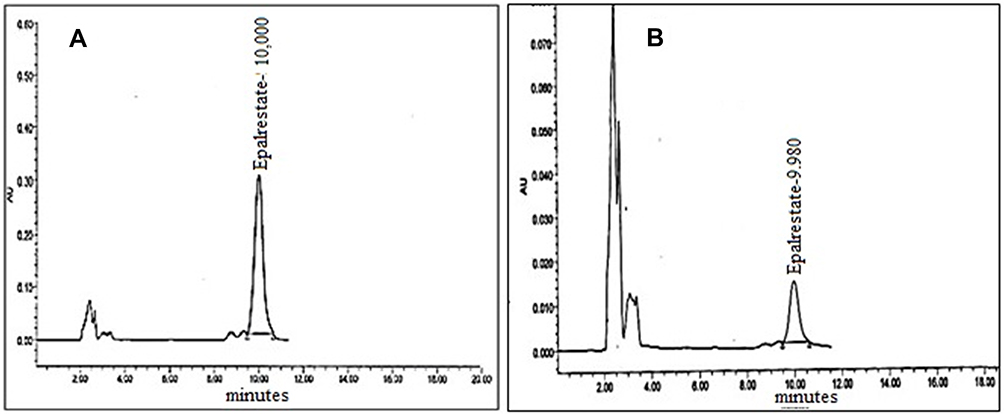 |
Figure 11 (A) Chromatogram of EPL without rabbit plasma (B) Chromatogram of EPL in rabbit plasma. |
Limit of Detection and Quantification (LOD, LOQ)
The sensitivity of the sample extraction may be assessed through HPLC technique to determine the LOD and LOQ of EPL. The sample LOD was found to be 0.047 μg. This amount of EPL could be identified but not quantified. The limit of quantification (LOQ) was determined to be 0.142 μg, therefore, the lowest quantity of EPL that could be detected and successfully quantified was 0.142 μg.
Precision and Accuracy
Five replicates of each control concentration LQC (0.5 μg/mL), MQC (5 μg/mL) and HQC (10 μg/mL) were prepared for accuracy at the intra-day variation. Five samples of LQC, MQC and HQC were prepared for precision at inter-day level. Table 1 depicting that the biological fluids have more than 98% accuracy supports the reliability and validation of the developed method. The findings of this method’s intra-day and inter-day precision showed the repeatability and would produce consistent results when used under certain conditions. LQC, MQC and HQC values for RSD (%) for intra-day levels were 6.19%, 3.49% and 6.02% while for inter-day levels were 6.96%, 11.17% and 4.52%, respectively. The data demonstrated very accurate findings of the developed method. The accuracy of the method developed lay in the range of 98–98.9% indicating reliable results. The intra-day and inter-day precision and accuracy provide adequate evidence to declare that the developed method for quantification of EPL in plasma is accurate and reliable.
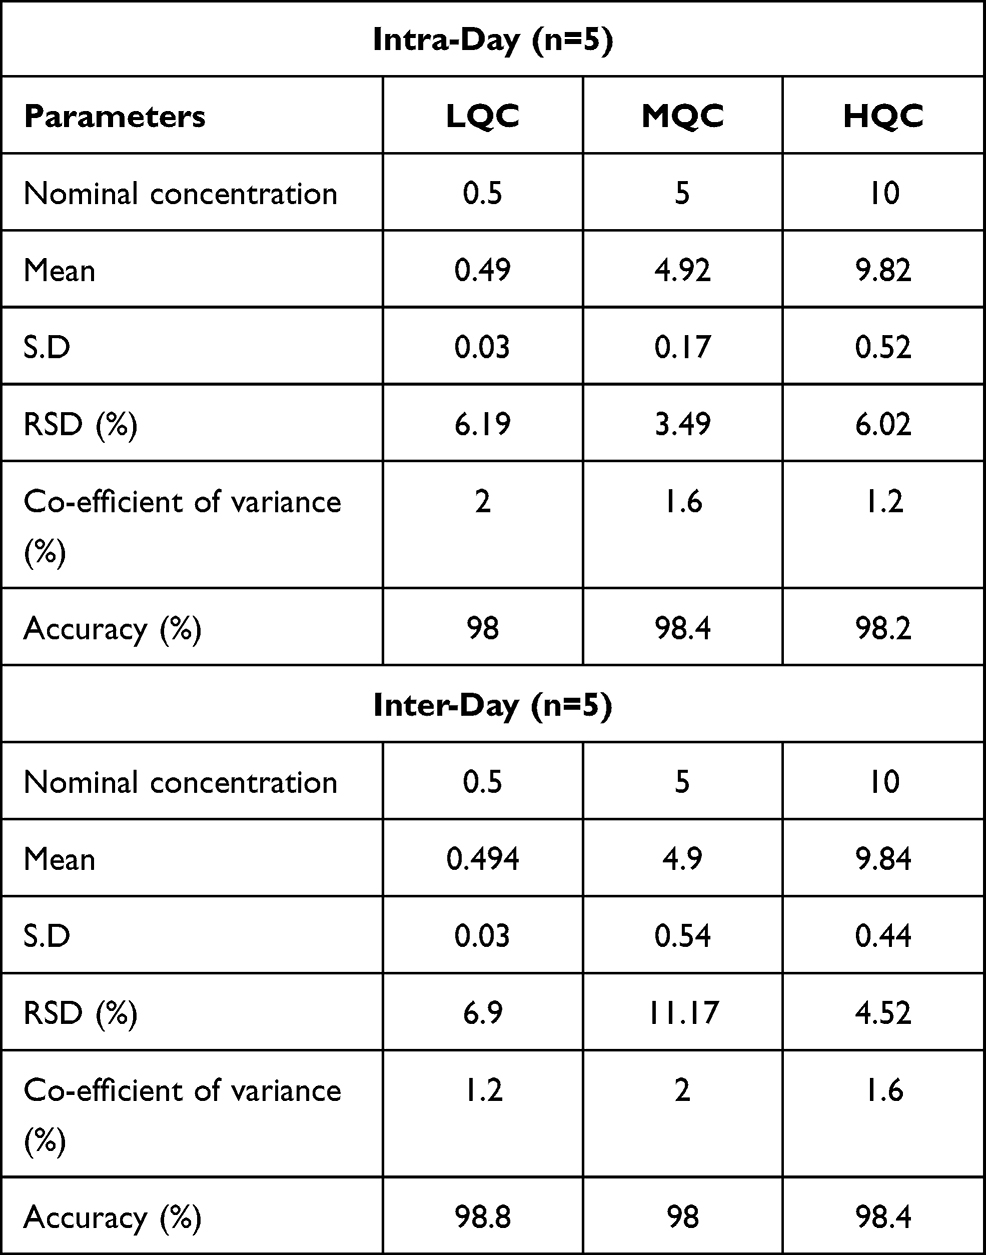 |
Table 1 Intra-Day and Inter-Day Precision and Accuracy of the Developed Method or Pharmacokinetic Evaluation |
Robustness
To investigate the effects of EPL separation, chromatography conditions were intentionally changed. The flow rate has been increased by 0.2 units (1±0.2). The influence of the solvent system was investigated by varying the content of both solvents by 2 mL (ACN:KH2PO4). The effect of column age was also investigated by comparing the responses of fresh column to that of a column having an age of 10, 15 and 30 days, while maintaining all the other circumstances as constants.
Pharmacokinetic Profiling and Quantification of EPL in Rabbit Plasma
The average concentration of EPL reached in plasma in three different groups of rabbits (n = 18) after administration of pure EPL, EPL-loaded SBE7 β-CD (IC) and nanoparticles of EPL-loaded SBE7 β-CD (NP) are summarized in Table 2 and Figure 12.
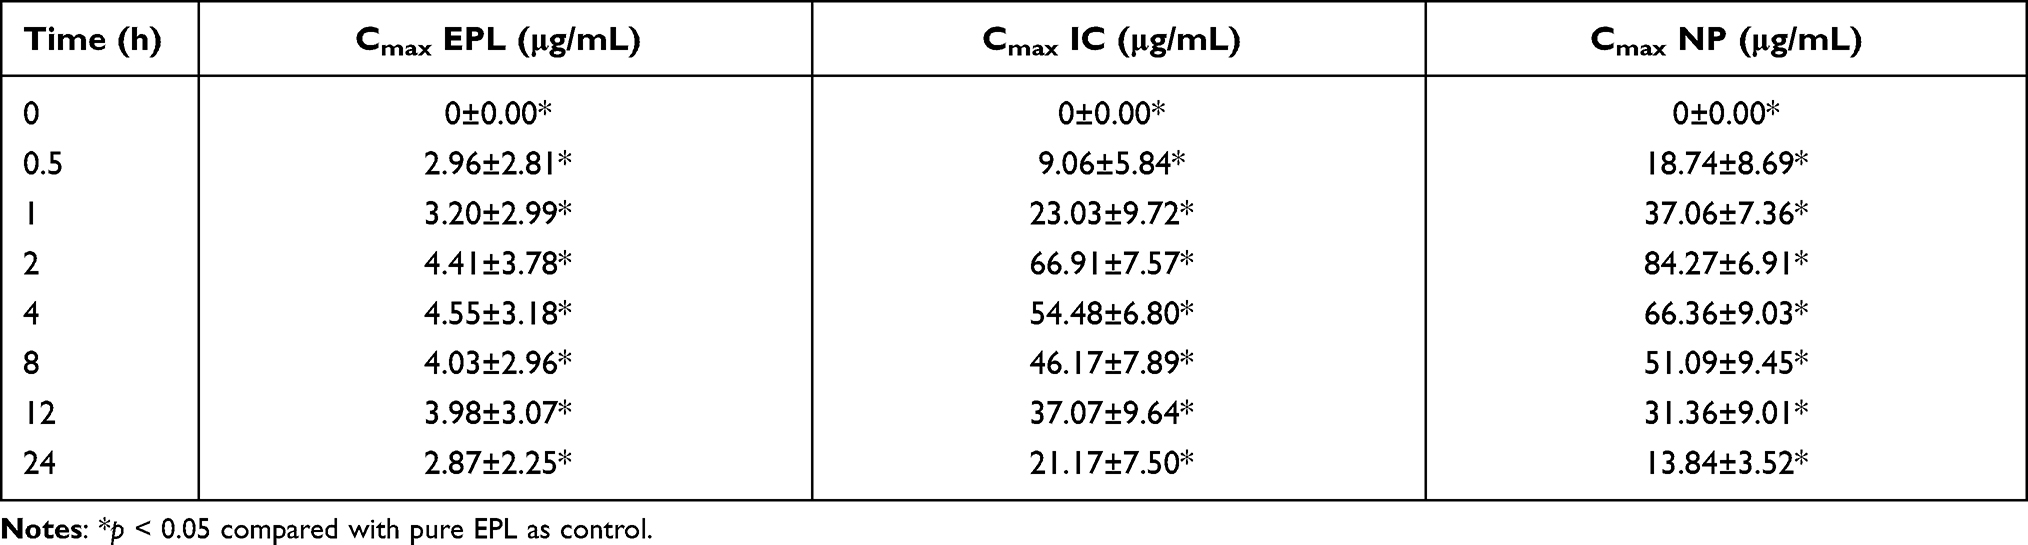 |
Table 2 Maximum Concentration of EPL in Control Group, IC and NP in Different Groups of Rabbits |
 |
Figure 12 Plasma concentration time profiling of EPL (Cmax 4.75±3.64), IC (66.91±7.58), NP (84.27±6.91), p < 0.05 compared with pure epalrestat as control. |
When post hoc test was applied, the statistical results revealed a significant difference in drug concentration in plasma of the control group in comparison to the prepared formulations. IC and NPs demonstrated a significant increase in drug concentration in blood at a p < 0.05 as compared to pure EPL.
In comparison to the pure drug, the overall performance and pharmacokinetic performance and parameters are given in Table 3.
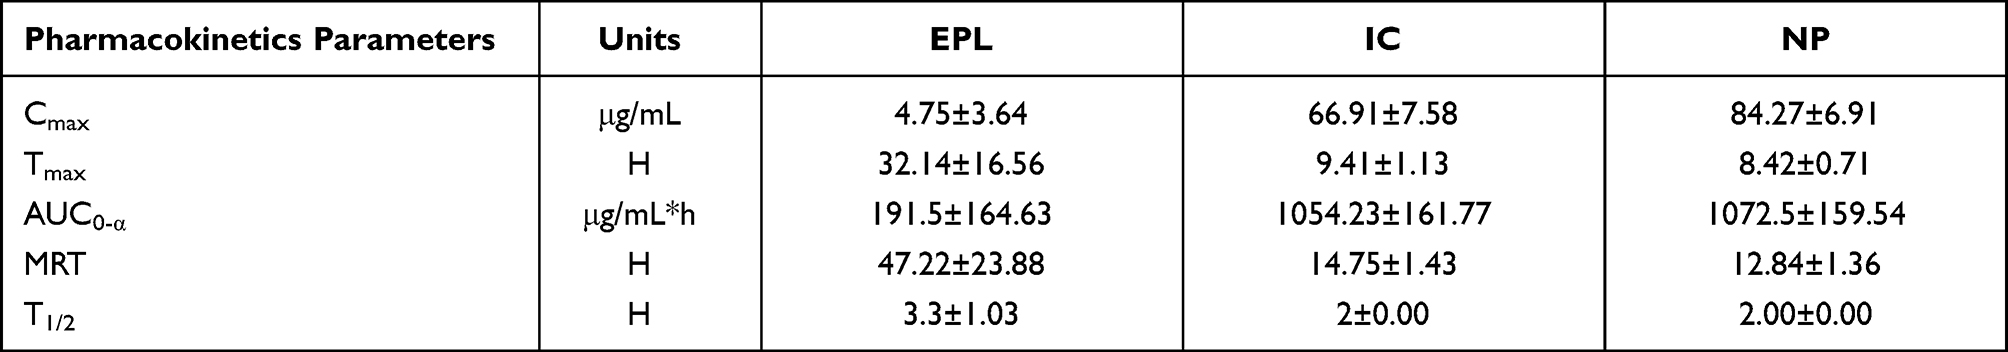 |
Table 3 Comparison of Mean Values of Various Pharmacokinetics Factors of EPL, IC and NP |
After the administration of the drug, Cmax is the maximum concentration of drug, reaches the systemic system in unaltered form. The values of Cmax for EPL, IC and NP are 4.75±3.64 μg/mL, 66.91±7.58 μg/mLand 84.27±6.91 μg/mL respectively (mean±SD). The substantially higher values of Cmax for both the test formulations may result in increased drug bioavailability. For all the test formulations, the values of Cmax were in the following order: Cmax NP > Cmax IC > Cmax EPL. Tmax is the time required for any drug substance to reach the maximum plasma concentration Tmax for EPL, IC and NP and was 32.14±16.56, 9.4±1.13 and 8.42±0.71 h, respectively. The reason might be the fast release of the drug from test formulations as compared to the pure drug. AUC stands for area under the plasma concentration curve. The statistical moment theory described the curve as a zero-moment curve. There are several approaches, but the trapezoidal rule is the most frequent. It illustrated the pharmaceutical product’s bioavailability. And is highly useful in determining the relative effectiveness of different pharmaceutical products. For EPL, IC and NP the mean±SD for AUC0-α were 191.51±164.63, 1054±161.77 and 1072.52±159.54 μg/mL*h, respectively. The AUC0-α values were in the following order NP > IC > EPL. The larger values of AUC0-α for test formulations indicated that they have higher bioavailability. The mean residence time (MRT) for EPL, IC and NP were 47.22±3.88, 14.75±1.43 and 12.84±1.36 h. The time it takes for the drug to reduce to half of its original concentration is termed as drug plasma half-life, which is an important pharmacokinetic parameter. This value represented the delivery system’s circulation time and stability in the physiological environment. The half-life for EPL, IC and NP is 4, 2 and 2 h, respectively. According to the calculated values the observed half-life for IC and NP is half to that of EPL, implying that the test formulation will have better bioavailability.
Discussion
Poor aqueous solubility of lipophilic drugs has a considerable impact on the pharmacokinetic profile of drugs. Currently 40% of the available drug substances and 70% of new chemical entities have limited solubility in water. To address this problem, recent research has successfully developed polymeric cyclodextrin-chitosan nanoparticles to increase the solubility and bioavailability of such hydrophobic drugs.52 The objective of this research study is to use a co-precipitation approach to formulate an inclusion complex of EPL with SBE7 β-CD which will be subsequently manufactured into EPL-SBE7 β-CD chitosan nanoparticles using the ionic gelation method. FT-IR, PXRD, DSC as well as particle size analysis, surface morphology, and in vitro dissolution studies were used for the verification of inclusion complexation and NPs characterizations. FT-IR studies were carried out in order to determine the nature of drug, polymers and the prepared formulations. The O-H vibrational stretching pattern of EPL was visible in the infrared spectrum which was in the range of an intense band between 3600–3000 cm−1. At 2358.98 cm−1, C-H vibrational stretching is also visible. There is also an overlapping effect for H-O-H bending of water molecules linked to SBE7 β-CD at 1635.88 cm−1. In the complexes prepared by the co-precipitation method for EPL, all the characteristic peaks of aromatic amines, O-H bonds and carboxyl groups were seen. As a result, EPL is thought to have been complexed into the cavity of CD, hence increasing the drug’s solubility and bioavailability. The N-H and C-O bonding of EPL stretched at 1694.18 cm−1 and 1743.42 cm−1 in the spectra of EPL-SBE7 β-CD-CS NPs. The O-H stretching absorption band was identified in the spectra of the prepared NPs at 3300–3000 cm−1, and the thio-carbonyl stretching in pure EPL was found at 1554.58 cm−1. When CD complexed EPL was inserted into the nano-system, the behavior of the drug remained unchanged and no-compatibility was found in the spectrum, indicating that C=O group of EPL with frequency shifting. The cross-linking of CS and sTPP demonstrated no change in chemical interaction, indicating that EPL-CDs-Cs NPs were successfully manufactured.
PXRD investigation confirmed the crystalline nature of EPL, which revealed unique, reasonably sharp, and less dispersed peaks. In 2017, Furuishi and coworkers, reported similar peaks in their research work.41 The peak intensities of the prepared complex and NPs are reduced, resulting in diffused pattern. Because of the hydrophilic nature of CDs, which confer the wetting property, improves the drug’s aqueous solubility and dissolution, the sharp peaks of EPL were overlapping and disappearing. Sadaquat and her colleagues in 2021 also reported similar results, claiming that increasing the drug’s aqueous solubility reduced its crystallinity and improved the bioavailability of the drug.53
Polysaccharides have a strong attraction to water in their solid form; hence these molecules have disordered geometries that are easily hydrated. The hydration levels of these macromolecules are determined by their mean supramolecular structure. The diffractogram of pure EPL showed a strong peak. Indicating that EPL is crystalline.41 Because of the amorphous nature, SBE7 β-CD demonstrated a large endothermic peak of EPL was reduced in solid complex generated by co-precipitation method, lowering the crystalline form of the pure drug. The aqueous solubility of EPL was improved when the crystallinity was reduced. SBE7 β-CD broad endothermic peak vanished as well, demonstrating that EPL is diffused throughout the cavity of SBE7 β-CD. The thermogram of NPs exhibited an endothermic peak, which was most likely caused by EPL and SBE7 β-CD generating an endothermic peak. The normal EPL characteristic peak, on the other hand, has vanished and so cannot be seen in loaded NPs, indicating that EPL’s crystalline nature has been transformed to an amorphous form.
Because small nano-scale molecules must traverse the cellular membrane to reach the target site, the size required when synthesizing NPs is the most significant parameter. The ionic gelation method was used to make NPs in this research investigation. Particle size, polydispersity index, and total zeta potential were all significantly affected by the synthesis of EPL-CDs-CS NPs. The nanometric size of the prepared NPs was discovered along with a low polydispersity index and a positive zeta potential value. The produced NPs had a diameter of 241.5 nm, indicating that complexing EPL with CDs had no influence on the diameter of NPs. The polydispersity index is another key aspect in assessing the homogeneity. The PDI value of 0.363 was reported, indicating particle stability. +31.8 mV value of zeta potential indicated that the charge on the surface of CS was not hidden which is critical when preparing NPs. The presence of positive zeta potential value is required to prevent particle-particle aggregation and promote particle interaction with biological membrane.
The ability of a therapeutic agent that has been carried by the polymer to reach the binding site in a sufficient amount of time is a critical parameter for effective drug delivery. While designing therapeutic moiety, we must investigate factors of drug release efficiency and polymer degradation.
The ability of a therapeutic agent that has been carried by the polymer to reach the binding site in a sufficient amount is a critical parameter for effective drug delivery. While designing therapeutic moiety, we must investigate factors of drug release efficiency and polymer degradation. Pure EPL had a cumulative drug release of roughly 20–25%. The reason might be the hydrophobic nature of drug, crystallinity, low aqueous solubility, and wettability. All these factors contributed poor release rate of EPL which hinders its usage as drug delivery. In order to overcome this challenge, inclusion complexation and development of NPs were carried out. The cumulative drug release of IC was found to be 73.41% which might be due to the decrease in particle size, emergence of soluble complexation between drug and CD, conversion of the drug’s crystalline nature into an amorphous state and the surfactant nature of SBE7 β-CD. On the other hand, the release of EPL from nanoparticulate system exhibited sudden burst release followed by a much slower but steady release pattern. This sudden outburst of EPL lasted around half an h and approximately 30% drug has been released from NPs. After about 1 h the drug was slowly released from the interior core of NPs due to the erosion and degradation of the polymer. In just 12 h about 90% of drug has been discharged from the NPs. EPL was released at a considerably faster rate from EPL/SBE7 β-CD CS NP which can be explained by the increased release impact of SBE7 β-CD complexed CS NPs. This research study was also linked to previous work on drug-loaded CS NPs. The drug distribution at the surface of NPs may be responsible for spontaneous drug release, permitting a quick diffusion through the porous layer of NPs. Because the drug release mechanism has been moved into diffusion phenomenon, the rate of drug release decline after the burst release phase.49
High-performance liquid chromatography was designed and validated or verified for several characteristics such as precision (reproducibility), accuracy, uniformity and working range. Limit of detection and quantification were conducted in order to undertake the pharmacokinetic study. There were three groups in the pharmacokinetic evaluation of the designed formulations. The formulations IC and NP were tested against the control group. The pharmacokinetic parameters such as peak plasma drug concentration (Cmax), time to achieve maximum concentration (Tmax), area under the concentration time curve (AUC0-α), mean residence time (MRT) and half-life (t1/2) were studied using a non-compartment pharmacokinetic model. From the obtained results it can be assessed that the solubility of the epalrestat has been successfully enhanced by fabricating it in a nanoparticulate system resulting in improved bioavailability of the developed formulation.
Conclusion
The proposed study objective was to prepare and characterize an inclusion complex of EPL with SBE7 β-CD and CS NP loaded with EPL/SBE7 β-CD. α-Glucosidase enzyme inhibition activity of EPL was conducted and compared with acarbose taken as a standard. The fact that EPL has a higher enzyme inhibition activity at various concentrations, indicated that it has the potential to be employed as an anti-diabetic drug. This aspect of EPL has never been reported before. Furthermore, in silico modelling demonstrated that EPL binds to α-glucosidase successfully. In vivo studies of control EPL, IC and NP on healthy rabbits revealed acceptable pharmacokinetic characteristics, suggesting that prepared IC and NPs might be good candidates for substantially enhancing the solubility and thereby enhancing the efficacy of poorly aqueous soluble drugs.
Acknowledgment
The success and final outcomes required assistance from many people. The authors are extremely grateful to Symed Labs, Hyderabad, India for providing epalrestat as a gift to accomplish our research work. We are also very thankful to the technical assistance provided by the Institute of Physics and Materials Chemistry Laboratory at the Institute of Chemistry, The Islamia University of Bahawalpur, Pakistan for analyses of the samples.
Disclosure
The authors declare no conflicts of interest in this work.
References
1. Assefa ST, Yang E-Y, Chae SY, et al. Alpha glucosidase inhibitory activities of plants with focus on common vegetables. Plants. 2020;9(1):2. doi:10.3390/plants9010002
2. Derosa G, Maffioli P. α-Glucosidase inhibitors and their use in clinical practice. Arch Med Sci. 2012;8(5):899. doi:10.5114/aoms.2012.31621
3. Kumar S, Narwal S, Kumar V, Prakash O. α-glucosidase inhibitors from plants: a natural approach to treat diabetes. Pharmacogn Rev. 2011;5(9):19. doi:10.4103/0973-7847.79096
4. Davies GJ, Gloster TM, Henrissat B. Recent structural insights into the expanding world of carbohydrate-active enzymes. Curr Opin Struct Biol. 2005;15(6):637–645. doi:10.1016/j.sbi.2005.10.008
5. Vocadlo DJ, Davies GJ. Mechanistic insights into glycosidase chemistry. Curr Opin Struct Biol. 2008;12(5):539–555. doi:10.1016/j.cbpa.2008.05.010
6. Sun H, Bo Y, Zhang M, et al. Simultaneous determination of epalrestat and puerarin in rat plasma by UHPLC–MS/MS: application to their pharmacokinetic interaction study. Biomed Chromatogr. 2017;31(4):3855. doi:10.1002/bmc.3855
7. An-Chang L, Li-Xia Z, Shu-Wen Y, Hong-Xiang L. Pre-treatment with puerarin affects pharmacokinetics of warfarin, but not clopidogrel, in experimental rats. Chin J Nat Med. 2015;13(4):257–263. doi:10.1016/S1875-5364(15)30012-1
8. Ohmura C, Watada H, Azuma K, et al. Aldose reductase inhibitor, epalrestat, reduces lipid hydroperoxides in type 2 diabetes. Endocr J. 2009;56(1):149–156. doi:10.1507/endocrj.K08E-237
9. Putra OD, Umeda D, Nugraha YP, et al. Solubility improvement of epalrestat by layered structure formation via cocrystallization. Cryst Eng Commun. 2017;19(19):2614–2622. doi:10.1039/C7CE00284J
10. Huang J, Sun R, Feng S, et al. Sensitive analysis and pharmacokinetic study of epalrestat in C57BL/6J mice. J Chromatogr B Anal Technol Biomed Life Sci. 2017;1055:98–103. doi:10.1016/j.jchromb.2017.03.040
11. Nirogi R, Kandikere V, Ajjala DR, Bhyrapuneni G, Muddana NR. LC–MS/MS method for the quantification of aldose reductase inhibitor–Epalrestat and application to pharmacokinetic study. J Pharm Biomed Anal. 2013;74:227–234. doi:10.1016/j.jpba.2012.10.020
12. Naik J, Rajput R, Singh MK. Development and evaluation of ibuprofen loaded hydrophilic biocompatible polymeric nanoparticles for the taste masking and solubility enhancement. BioNanoScience. 2021;11(1):21–31. doi:10.1007/s12668-020-00798-y
13. Mora-Huertas CE, Fessi H, Elaissari A. Polymer-based nanocapsules for drug delivery. Int J Pharm. 2010;385(1–2):113–142. doi:10.1016/j.ijpharm.2009.10.018
14. Prego C, Garcia M, Torres D, Alonso MJ. Transmucosal macromolecular drug delivery. J Control Release. 2005;101(1–3):151–162. doi:10.1016/j.jconrel.2004.07.030
15. Vila A, Sánchez A, Janes K, et al. Low molecular weight chitosan nanoparticles as new carriers for nasal vaccine delivery in mice. Eur J Pharm Biopharm. 2004;57(1):123–131. doi:10.1016/j.ejpb.2003.09.006
16. Csaba N, Köping-Höggård M, Alonso MJ. Ionically crosslinked chitosan/tripolyphosphate nanoparticles for oligonucleotide and plasmid DNA delivery. Int J Pharm. 2009;382(1–2):205–214. doi:10.1016/j.ijpharm.2009.07.028
17. Loutfy SA, Elberry MH, Farroh KY, et al. Antiviral activity of chitosan nanoparticles encapsulating curcumin against hepatitis C virus genotype 4a in human hepatoma cell lines. Int J Nanomed. 2020;15:2699–2715. doi:10.2147/IJN.S241702
18. Çirpanli Y, Bilensoy E, Doğan AL, Çaliş S. Biopharmaceutics. Comparative evaluation of polymeric and amphiphilic cyclodextrin nanoparticles for effective camptothecin delivery. Eur J Pharm Biopharm. 2009;73(1):82–89. doi:10.1016/j.ejpb.2009.04.013
19. Van Hees T, Piel G, de Hassonville SH, Evrard B, Delattre L. Determination of the free/included piroxicam ratio in cyclodextrin complexes: comparison between UV spectrophotometry and differential scanning calorimetry. Eur J Pharm Sci. 2002;15(4):347–353. doi:10.1016/S0928-0987(02)00018-0
20. Wu J, Shen Q, Fang L. Sulfobutylether-β-cyclodextrin/chitosan nanoparticles enhance the oral permeability and bioavailability of docetaxel. Drug Dev Ind Pharm. 2013;39(7):1010–1019. doi:10.3109/03639045.2012.694588
21. Song M, Li L, Zhang Y, Chen K, Wang H, Gong R. Carboxymethyl-β-cyclodextrin grafted chitosan nanoparticles as oral delivery carrier of protein drugs. React Funct Polym. 2017;117:10–15. doi:10.1016/j.reactfunctpolym.2017.05.008
22. Varela-Fernández R, García-Otero X, Díaz-Tomé V, et al. Design, Optimization, and characterization of Lactoferrin-Loaded chtison/TPP and Chitosan/Sulfobutylether-β-cyclodextrin Nanoparticles as a Pharmacological Alternative for Keratoconus Treatment. ACS. 2021;13(3):3559–3575.
23. Yin YM, Cui FD, Mu CF, et al. Docetaxel microemulsion for enhanced oral bioavailability: preparation and in vitro and in vivo evaluation. J Control Release. 2009;140(2):86–94. doi:10.1016/j.jconrel.2009.08.015
24. Marchettini P, Stuart AO, Mohamed F, Yoo D, Sugarbaker PH. Docetaxel: pharmacokinetics and tissue levels after intraperitoneal and intravenous administration in a rat model. Cancer Chemother Pharmacol. 2002;49(6):499–503. doi:10.1007/s00280-002-0439-1
25. Krauland AH, Alonso MJ. Chitosan/cyclodextrin nanoparticles as macromolecular drug delivery system. Int J Pharm. 2007;340(1–2):134–142. doi:10.1016/j.ijpharm.2007.03.005
26. Trapani A, Lopedota A, Franco M, et al. A comparative study of chitosan and chitosan/cyclodextrin nanoparticles as potential carriers for the oral delivery of small peptides. Eur J Pharm Biopharm. 2010;75(1):26–32. doi:10.1016/j.ejpb.2010.01.010
27. Maestrelli F, Garcia-Fuentes M, Mura P, Alonso MJ. A new drug nanocarrier consisting of chitosan and hydoxypropylcyclodextrin. Eur J Pharm Biopharm. 2006;63(2):79–86. doi:10.1016/j.ejpb.2005.12.006
28. Osadebe P, Onugwu L, Attama A. Energetics of the interaction between piroxicam and beta-cyclodextrin (-CD) in inclusion complexes. Scien Res Essay. 2008;3(3):86–93.
29. Sapkal N, Kilor V, Bhursari K, Daud A. Evaluation of some methods for preparing gliclazide-β-cyclodextrin inclusion complexes. Trop J Pharm Res. 2007;6(4):833–840. doi:10.4314/tjpr.v6i4.14667
30. Sapkal NP, Kilor VA, Shewale BD, Bhusari K, Daud A. Study of the complexation behaviour of fexofenadine with β-cyclodextrin. Indian J Pharm Sci. 2010;72(3):318. doi:10.4103/0250-474X.70477
31. Motiei M, Kashanian S. Novel amphiphilic chitosan nanocarriers for sustained oral delivery of hydrophobic drugs. Eur J Pharm Sci. 2017;99:285–291. doi:10.1016/j.ejps.2016.12.035
32. Garcia A, Leonardi D, Salazar MO, Lamas MC. Modified β-cyclodextrin inclusion complex to improve the physicochemical properties of albendazole. Complete in vitro evaluation and characterization. PLoS One. 2014;9(2):e88234. doi:10.1371/journal.pone.0088234
33. Rampino A, Borgogna M, Blasi P, Bellich B, Cesàro A. Chitosan nanoparticles: preparation, size evolution and stability. Int J Pharm. 2013;455(1–2):219–228. doi:10.1016/j.ijpharm.2013.07.034
34. Samy M, Abd El-Alim SH, Amin A, Ayoub MM. Formulation, characterization and in vitro release study of 5-fluorouracil loaded chitosan nanoparticles. Int J Biol Macromol. 2020;156:783–791. doi:10.1016/j.ijbiomac.2020.04.112
35. Giram PS, Wang JT-W, Walters AA, et al. Green synthesis of methoxy-poly (ethylene glycol)-block-poly (L-lactide-co-glycolide) copolymer using zinc proline as a biocompatible initiator for irinotecan delivery to colon cancer in vivo. RSC. 2021;9(3):795–806.
36. Kang W-Y, Song Y-L, Zhang L. α-Glucosidase inhibitory and antioxidant properties and antidiabetic activity of Hypericum ascyron L. Med Chem Res. 2011;20(7):809–816. doi:10.1007/s00044-010-9391-5
37. Santos PL, Brito RG, Oliveira MA, et al. Docking, characterization and investigation of β-cyclodextrin complexed with citronellal, a monoterpene present in the essential oil of Cymbopogon species, as an anti-hyperalgesic agent in chronic muscle pain model. Phytomedicines. 2016;23(9):948–957. doi:10.1016/j.phymed.2016.06.007
38. Padullés A, Colom H, Armendariz Y, et al. Determination of ganciclovir in human plasma by ultra performance liquid chromatography–UV detection. Clin Biochem. 2012;45(4–5):309–314. doi:10.1016/j.clinbiochem.2011.12.014
39. Krier F, Brion M, Debrus B, et al. Optimisation and validation of a fast HPLC method for the quantification of sulindac and its related impurities. J Pharm Biomed Anal. 2011;54(4):694–700. doi:10.1016/j.jpba.2010.10.022
40. Vo HC, Henning PA, Leung DT, Sacks SL. Development and validation of a plasma assay for Acyclovir using high-performance capillary electrophoresis with sample stacking. J Chromatogr B. 2002;772(2):291–297. doi:10.1016/S1570-0232(02)00116-2
41. Furuishi T, Takahashi S, Ogawa N, et al. Enhanced dissolution and skin permeation profiles of epalrestat with β-cyclodextrin derivatives using a cogrinding method. Eur J Pharm Sci. 2017;106:79–86. doi:10.1016/j.ejps.2017.05.047
42. Mahmoud AA, El-Feky GS, Kamel R, Awad GE. Chitosan/sulfobutylether-β-cyclodextrin nanoparticles as a potential approach for ocular drug delivery. Int J Pharm. 2011;413(1–2):229–236. doi:10.1016/j.ijpharm.2011.04.031
43. Gomathi T, Sudha P, Florence JAK, Venkatesan J, Anil S. Fabrication of letrozole formulation using chitosan nanoparticles through ionic gelation method. Int J Biol Macromol. 2017;104:1820–1832. doi:10.1016/j.ijbiomac.2017.01.147
44. Ali SW, Rajendran S, Joshi M. Synthesis and characterization of chitosan and silver loaded chitosan nanoparticles for bioactive polyester. Carbohyd Polym. 2011;83(2):438–446. doi:10.1016/j.carbpol.2010.08.004
45. Chen YZ, Huang YK, Chen Y, Ye YJ, Lou KY, Gao F. Novel nanoparticles composed of chitosan and β-cyclodextrin derivatives as potential insoluble drug carrier. Chin Chem Lett. 2015;26(7):909–913. doi:10.1016/j.cclet.2015.05.044
46. Khalil SK, El-Feky GS, El-Banna ST, Khalil WA. Preparation and evaluation of warfarin-β-cyclodextrin loaded chitosan nanoparticles for transdermal delivery. Carbohydr Polym. 2012;90(3):1244–1253. doi:10.1016/j.carbpol.2012.06.056
47. Xu J, Zhang Y, Li X, Zheng Y. Inclusion complex of nateglinide with sulfobutyl ether β-cyclodextrin: preparation, characterization and water solubility. J Mol Struct. 2017;1141:328–334. doi:10.1016/j.molstruc.2017.03.116
48. Kankala RK, Liu CG, Yang DY, Wang SB, Chen AZ. Ultrasmall platinum nanoparticles enable deep tumor penetration and synergistic therapeutic abilities through free radical species-assisted catalysis to combat cancer multidrug resistance. Chem Eng J. 2020;383:123138. doi:10.1016/j.cej.2019.123138
49. Papadimitriou S, Bikiaris D, Avgoustakis K, Karavas E, Georgarakis M. Chitosan nanoparticles loaded with dorzolamide and pramipexole. Carbohydr Polym. 2008;73(1):44–54. doi:10.1016/j.carbpol.2007.11.007
50. Chaudhari VS, Borkar RM, Murty US, Banerjee S. Analytical method development and validation of reverse-phase high-performance liquid chromatography (RP-HPLC) method for simultaneous quantifications of quercetin and piperine in dual-drug loaded nanostructured lipid carriers. J Pharm Biomed Anal. 2020;186:113325. doi:10.1016/j.jpba.2020.113325
51. Chen W, Shen Y, Rong H, Lei L, Guo S. Development and application of a validated gradient elution HPLC method for simultaneous determination of 5-fluorouracil and paclitaxel in dissolution samples of 5-fluorouracil/paclitaxel-co-eluting stents. J Pharm Biomed Anal. 2012; 59:179–83.
52. Zhao L, Tang P, Tang B, et al. Chitosan/sulfobutylether-β-cyclodextrin nanoparticles for ibrutinib delivery: a potential nanoformulation of novel kinase inhibitor. Int J Pharm. 2020;109(2):1136–1144.
53. Sadaquat H, Akhtar M, Nazir M, Ahmad R, Alvi Z, Akhtar N. Biodegradable and biocompatible polymeric nanoparticles for enhanced solubility and safe oral delivery of docetaxel: in vivo toxicity evaluation. Int J Pharm. 2021;598:120363. doi:10.1016/j.ijpharm.2021.120363
 © 2021 The Author(s). This work is published and licensed by Dove Medical Press Limited. The
full terms of this license are available at https://www.dovepress.com/terms
and incorporate the Creative Commons Attribution
- Non Commercial (unported, 3.0) License.
By accessing the work you hereby accept the Terms. Non-commercial uses of the work are permitted
without any further permission from Dove Medical Press Limited, provided the work is properly
attributed. For permission for commercial use of this work, please see paragraphs 4.2 and 5 of our Terms.
© 2021 The Author(s). This work is published and licensed by Dove Medical Press Limited. The
full terms of this license are available at https://www.dovepress.com/terms
and incorporate the Creative Commons Attribution
- Non Commercial (unported, 3.0) License.
By accessing the work you hereby accept the Terms. Non-commercial uses of the work are permitted
without any further permission from Dove Medical Press Limited, provided the work is properly
attributed. For permission for commercial use of this work, please see paragraphs 4.2 and 5 of our Terms.