")
Back to Journals » Drug Design, Development and Therapy » Volume 10
Enhanced oral bioavailability of acetylpuerarin by poly(lactide-co-glycolide) nanoparticles optimized using uniform design combined with response surface methodology
Authors Sun D, Xue A, Zhang B, Xue X, Zhang J, Liu W
Received 10 March 2016
Accepted for publication 13 April 2016
Published 21 June 2016 Volume 2016:10 Pages 2029—2039
DOI https://doi.org/10.2147/DDDT.S108185
Checked for plagiarism Yes
Review by Single anonymous peer review
Peer reviewer comments 2
Editor who approved publication: Prof. Dr. Wei Duan
Deqing Sun,1,2 Aiying Xue,3 Bin Zhang,1 Xia Xue,1 Jie Zhang,1 Wenjie Liu1
1Department of Pharmacy, the Second Hospital of Shandong University, Jinan, People’s Republic of China; 2School of Pharmaceutical Sciences, Shandong University, Jinan, People’s Republic of China; 3Department of Cardiology, the Second Hospital of Shandong University, Jinan, People’s Republic of China
Abstract: Acetylpuerarin (AP), an acetylated derivative of puerarin, shows brain-protective effects in animals. However, AP has low oral bioavailability because of its poor water solubility. The objective of this study was to design and develop poly(lactide-co-glycolide) (PLGA) nanoparticles (NPs) to enhance the oral bioavailability of AP. The NPs were prepared using a solvent diffusion method optimized via uniform design (UD) combined with response surface methodology (RSM) and characterized by their morphology, particle size, zeta (ζ)-potential, encapsulation efficiency (EE), drug loading (DL), and in vitro drug release. A pharmacokinetic study was conducted in Wistar rats administered a single oral dose of 30 mg/kg AP. The optimized NPs were spherical and uniform in shape, with an average particle size of 145.0 nm, a polydispersity index (PI) of 0.153, and a ζ-potential of -14.81 mV. The release of AP from the PLGA NPs showed an initial burst release followed by a sustained release, following Higuchi’s model. The EE and DL determined in the experiments were 90.51% and 17.07%, respectively. The area under the plasma concentration-time curve (AUC0-∞) of AP-PLGA-NPs was 6,175.66±350.31 h ng/mL, which was 2.75 times greater than that obtained from an AP suspension. This study showed that PLGA NPs can significantly enhance the oral bioavailability of AP.
Keywords: acetylpuerarin, nanoparticles, poly(lactic-co-glycolic acid), pharmacokinetics, bioavailability
Introduction
The oral route of drug delivery is considered the most convenient method for the systemic drug delivery because of its high patient compliance. Therefore, the development of novel oral drug delivery methods is a main goal in pharmaceutical research. However, oral formulations have several problems that can influence drug absorption.1,2 For example, the poor water solubility, slow intrinsic dissolution rate, and limited gastrointestinal (GI) permeability of drugs are major factors that affect oral absorption. Furthermore, the GI tract (GIT) has various physiological and anatomical barriers to oral drug delivery that restrict intestinal drug absorption. In addition, various enzymes (eg, esterases and lipases) in the GIT degrade drugs and thus decrease drug absorption. Finally, some drug efflux systems, such as P-glycoprotein (P-gp), in the small intestinal mucosal endothelial cells reduce oral bioavailability because of their ability to efflux various drugs.
To enhance oral bioavailability, some novel drug delivery systems have been designed, including micelles, microspheres, liposomes, nanoemulsions, nanoparticles (NPs), and self-microemulsions.3,4 NPs are solid colloidal particles ranging in size from 1 to 1,000 nm and can be prepared from natural or synthetic polymers. NP drug carriers for oral delivery show great potential because they can deliver poorly water-soluble drugs, target drugs to precise areas of the GIT, and transport drugs across GIT barriers by transcytosis.5 In addition, NPs can improve drug stability and minimize drug degradation, metabolism, and/or cellular efflux, thus enhancing their oral bioavailability.6
Polymers play a major role in the properties of NPs. Biodegradable polymers such as poly(lactide), poly (lactide-co-glycolide) (PLGA), poly(cyanoacrylate), poly(butylcyanoacrylate), and poly(methyl methacrylate) have been explored for potential use in oral drug delivery.7 PLGA is one of the most successfully used biodegradable polymers, and it has minimal systemic toxicity because its metabolite monomers, namely, lactic acid and glycolic acid, are endogenous and easily metabolized by the body via the Krebs cycle.8 Therefore, PLGA has been approved by the US Food and Drug Administration and the European Medicines Agency as part of various drug delivery systems in clinical trials.9 Several studies have utilized PLGA in oral nanodelivery systems with enhanced bioavailability.10–12
Acetylpuerarin (AP; Figure 1A) is an acetylated derivative of puerarin (PUE; Figure 1B), an isoflavonoid compound derived from the Chinese medical herb Radix puerariae. Previous studies have demonstrated the protective effects of AP against cerebrovascular ischemia-reperfusion injury in vivo and nerve cell damage induced by oxygen glucose deprivation or lipopolysaccharides in vitro.13–15 Therefore, AP is considered as a potential drug for the treatment of cerebrovascular diseases. However, AP shows low oral bioavailability because of its poor water solubility.16 We have already successfully prepared d-α-tocopheryl polyethylene glycol 1,000 succinate (TPGS) nanoemulsions and enhanced the oral bioavailability of AP via the mechanism of drug solubilization.15 We have also observed the improvement in the permeability of AP across the blood–brain barrier loaded in PLGA NPs following intravenous administration, and the main mechanisms lie in the endocytosis mediated by low-density lipoprotein receptor and the inhibition of the efflux by P-gp in the brain capillary endothelial cells.17
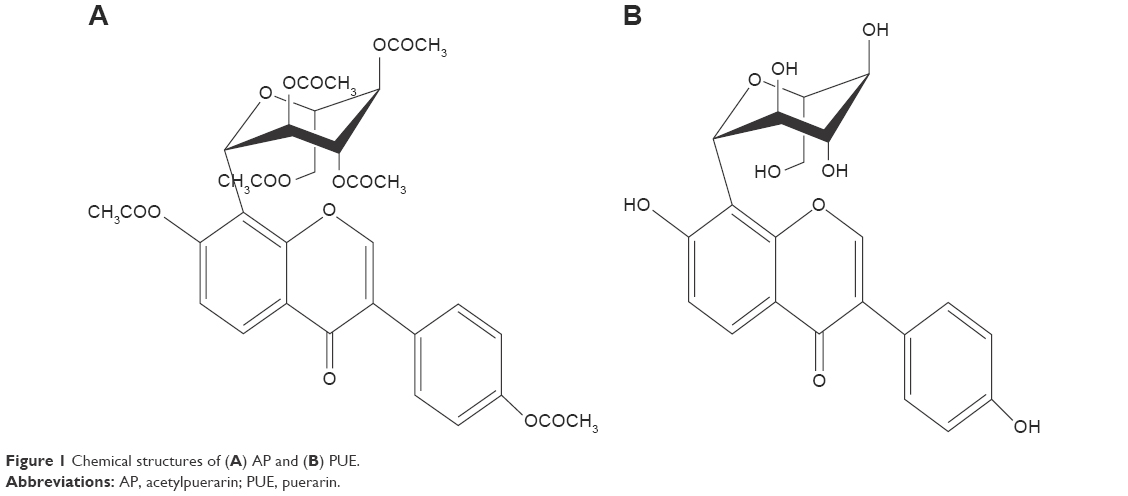 | Figure 1 Chemical structures of (A) AP and (B) PUE. |
Thus, based on our previous studies, we aimed to prepare and characterize AP-loaded PLGA NPs (AP-PLGA-NPs) and to further assess the enhancement in the oral bioavailability of AP using the PLGA NPs in the present study.
Materials and methods
Materials
The AP sample (purity ≥98%) was a gift from the Shandong Academy of Medical Sciences (Jinan, People’s Republic of China). The PUE standard (Batch Number 110752-200912) was acquired from the National Institutes for Food and Drug Control (Beijing, People’s Republic of China). PLGA (lactide/glycolide =50:50, molecular weight =10,000 Da) was obtained from Jinan Daigang Biomaterial Co., Ltd. (Jinan, People’s Republic of China). Polysorbate 80 (Tween 80) was purchased from Sinopharm Chemical Reagent Co., Ltd. (Shanghai, People’s Republic of China). Chromatographic-grade methanol and acetonitrile were obtained from Fisher Scientific (Fair Lawn, NJ, USA). The dialysis membrane was purchased from Viskase Company, Inc. (Darien, IL, USA). All the other chemicals and solvents used in this study were of analytical grade.
Wistar rats were supplied by the Laboratory Animal Center of Shandong University (Jinan, People’s Republic of China).
Preparation of AP-PLGA-NPs
AP-PLGA-NPs were prepared using a solvent diffusion method. Briefly, the organic phase was prepared by dissolving 18 mg of PLGA and 7 mg of AP in 1 mL of acetone under sonication at room temperature. The resulting organic phase was then poured into 4 mL of stirred aqueous phase containing 1% polysorbate 80. To evaporate the organic solvent, the formed oil-in-water (O/W) emulsion was continuously stirred with a magnetic stir bar at 800 rpm at 40°C for 12 hours. The final suspension was subsequently filtered through a 0.8 μm pore-size membrane.
Experimental design and formulation optimization
The NP formulation was optimized by a combination of uniform design (UD) and response surface methodology (RSM). The UD is typically displayed as a table, which is named a UD table. The UD table can be described as Un(qm), where U, n, q, and m stand for the UD, the number of experimental trials, the number of levels, and the maximum number of factors, respectively.18 In this study, the PLGA concentration (X1), the volume ratio of the aqueous phase to the oil phase (X2), and the AP feeding amount (X3) were chosen as three independent variables in the process of formulation optimization on the basis of preliminary experiments, the encapsulation efficiency (EE) and drug loading (DL) were taken as the evaluation indexes, and the UD table U*12 (1210) was used for this experimental design. The factors and levels are presented in Table 1.
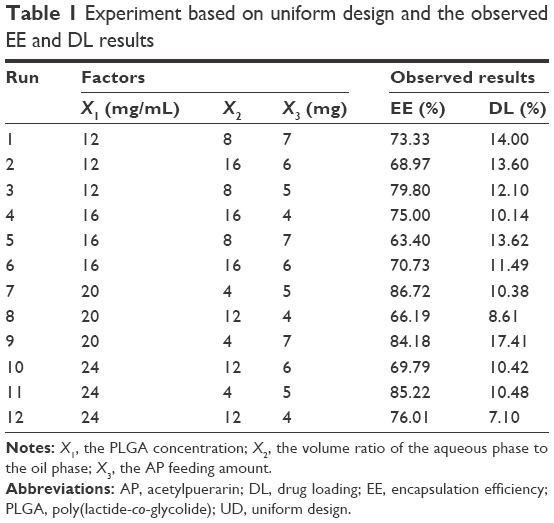 | Table 1 Experiment based on uniform design and the observed EE and DL results |
A regression analysis using IBM SPSS 19.0 (IBM Corp., Armonk, NY, USA) was carried out to fit the mathematical model to the experimental data, and the interactive effects of the independent variables on the dependent ones were illustrated by three-dimensional (3D) and two-dimensional (2D) contour plots.
Characterization of AP-PLGA-NPs
Particle size and zeta (ζ)-potential
Particle size and ζ-potential were measured using a Zetasizer 3000HSA instrument (Malvern Instruments Ltd., Malvern, UK). The prepared samples were dispersed in distilled water at 25°C and diluted 20-fold. The size distribution was measured using the polydispersity index (PI). Experiments were conducted in triplicate.
Morphological examination by transmission electron microscopy
In conjunction with the phosphotungstic acid-based negative dyeing method, transmission electron microscopy (TEM) was used to observe the morphology of the prepared NPs. In brief, a droplet of NP suspension was placed on a copper grid, the excess liquid was drained onto filter paper, and the grid was dried at room temperature. The copper grid was stained for 2 minutes in a 2% phosphotungstic acid solution, and then the morphology of the NPs was observed using TEM (H-7000, Hitachi Company, Tokyo, Japan).
EE and DL
The EE and DL of drug-loaded NPs were determined using an ultrafiltration centrifugation method previously described.19 The free AP was separated from the PLGA NP suspension using centrifugal filter tubes (Amicon Ultra-4, Millipore Corporation, Bedford, MA, USA) with a molecular weight cutoff of 10,000 Da. In brief, 0.1 mL of suspension was added into an ultracentrifugal filter tube. The suspension was then diluted 20-fold with distilled water and then centrifuged at 3,000× g for 30 minutes at room temperature. The total AP in the suspension and the free drug in the filtrate were determined by high-performance liquid chromatography (HPLC) at 250 nm. The EE and DL of the PLGA NPs were calculated based on the following equations:
|
|
|
|
where Wt is the total AP in the NP suspension, Wf is the free drug (AP not loaded in the NPs), and WPLGA is the feeding amount of PLGA.
In vitro release study
The in vitro release study was performed using a dialysis bag diffusion method.20 An aliquot (0.5 mL) of sample was dispensed into a dialysis bag (cellulose membrane, molecular weight cutoff of 10,000 Da), and the dialysis bag was incubated in 40 mL of phosphate-buffered saline (pH 7.4) containing 1% polysorbate 80 (w/v) to maintain a sink condition. The speed of the shaking bath was maintained at 200 rpm at 37°C. At predetermined time intervals, 1 mL of the external medium was removed for analysis and then replaced with the same volume of release medium. An AP-propylene glycol solution control was prepared following the same method described previously.21
The AP concentration in the release medium was determined using a high-performance liquid chromatography (HPLC) instrument (Agilent 1200, Agilent Technologies, Santa Clara, CA, USA). The chromatographic separation was performed on an Eclipse XDB C18 column (250×4.6 mm, 5 μm; Agilent Technologies) at 25°C. The mobile phase consisted of a mixture of 0.1% phosphoric acid solution and methanol (40:60, v/v). The flow rate of the mobile phase was 0.7 mL/min. The eluent was detected using a UV detector at 250 nm.
Pharmacokinetic studies in rats
Pharmacokinetic studies of the test (optimized AP-PLGA-NPs) and control (AP suspension containing 0.1% CMS-Na) formulations were conducted in male Wistar rats (200–250 g). After fasting for 12 hours with free access to water, the rats were randomly divided into two groups (n=6 in each group) by weight and were orally administered AP formulations at a dose of 30 mg/kg. At 0.25, 0.5, 0.75, 1, 1.5, 2, 4, 6, 8, and 12 hours after administration, 0.3 mL of blood sample was collected from the jugular vein into a heparinized tube. Plasma samples were obtained after centrifugation at 3,000× g for 10 minutes and then stored at −20°C prior to analysis.
AP was metabolized to PUE after oral administration in our previous study,15 so our present pharmacokinetic study was based on the quantification of PUE in the rat plasma. The plasma concentration of PUE was determined using a validated liquid chromatography–tandem mass spectrometric method, as described in our previous report.22 In short, the plasma samples were pretreated by precipitating the protein using a mixture of methanol and acetonitrile (50:50, v/v). The chromatographic separation was carried out on a CAPCELL PAK C18 MGШ column (150×2.0 mm, 5 μm; Shiseido, Kanagawa, Japan) in which the mobile phase consisted of a mixture of 0.1% formic acid in water (containing 5 mM ammonium formate) and methanol (35:65, v/v). The analyte was detected using an API 4000 triple-quadrupole mass spectrometric instrument (Applied Biosystems, Framingham, MA, USA) in multiple reaction monitoring mode. The precursors to the product ion transitions of m/z 417.5→297.6 and 271.3→153.0 were used to quantify PUE and the internal standard (genistein), respectively. The weighted (W=1/x2) calibration curve was linear over a plasma concentration range of 2.5–5,000 ng/mL, with a regression equation of
y =2.42×10⁻⁴x +2.65×10⁻⁵ (r=0.9959) | (3) |
The results of precision, accuracy, extraction recovery, matrix effects, and sample stability were found to be within the accepted variable limits.
The rats used in the experiments received care according to University Unit for Laboratory Animal Medicine guidelines. All animal experiments complied with the requirements of the National Act on the Use of Experimental Animals (People’s Republic of China) and were conducted using protocols approved by the Shandong University Institutional Animal Care and Use Committee.
Data analysis and statistics
Pharmacokinetic parameters were calculated following statistical moment theory using Drug and Statistics (DAS) software (version 2.0, Chinese Pharmacological Society, Xicheng, Beijing, People’s Republic of China). The maximum plasma concentration (Cmax) and the time to the maximum concentration (Tmax) were obtained directly from the concentration-time plots.
The results are expressed as the mean ± standard deviation. Statistical significance was determined by one-way analysis of variance for measurement data and the Mann–Whitney U-test for enumeration data using IBM SPSS 19.0 (IBM Corp.). Results with P<0.05 were considered statistically significant.
Results and discussion
Preparation of AP-PLGA-NPs
A schematic diagram of AP-PLGA-NPs is shown in Figure 2. Solvent diffusion is a widely applied method for NP preparation, and the O/W emulsion technique is a simple method for encapsulating a hydrophobic drug.23,24 In this method, both the drug and biodegradable polymer are first dissolved in a water-miscible organic solvent (eg, acetone), and then the resulting organic phase is emulsified in an aqueous solution containing an appropriate emulsifier. Finally, the volatile solvent is removed from the emulsion by evaporation. In the present study, because AP is a hydrophobic drug, the O/W emulsion technique was the first choice for its encapsulation.
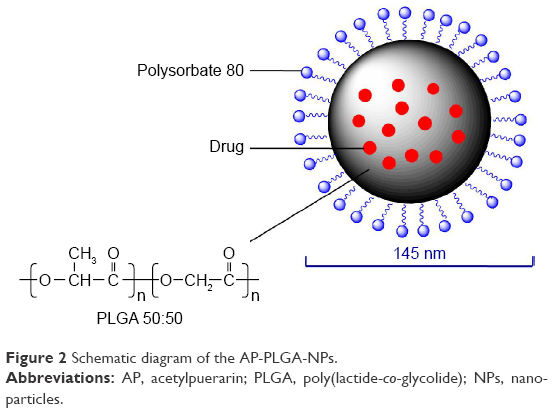 | Figure 2 Schematic diagram of the AP-PLGA-NPs. |
As mentioned in the “Introduction” section, PLGA is one of the most widely applied biodegradable polymers.9 In addition to its commercial availability and its approval in numerous biomedical and pharmaceutical products for human use in both the USA and Europe, PLGA has good solubility in numerous organic solvents, further accounting for its wide use.25 Moreover, the polymer’s properties, such as water uptake and degradation time, can be adjusted based on the selected molecular weight and the lactide/glycolide ratio. Commonly, a higher lactide/glycolide ratio in the polymer can lead to slower degradation. It has been reported that an in vitro degradation time of 4–6 weeks can be achieved using PLGA 50:50 with a relatively low molecular weight.26 In addition, PLGA 50:50 has a degree of hydrophilicity because of its higher glycolide content, which allows water molecules to enter the particle matrix and thus hydrates the polymer, leading to faster drug diffusion through the particle matrix.26 Based on biodegradation and drug diffusion considerations, PLGA 50:50 with a molecular weight of 10,000 Da was used in the present study.
Polysorbate 80 (polyoxyethylene 20 sorbitan monooleate) is a hydrophilic, nonionic surfactant because the polyoxyethylene groups are hydrophilic; however, the C18 chain of oleic acid constitutes a lipophilic group, so polysorbate 80 can dissolve or solubilize hydrophobic drugs.27 In addition to its ability to solubilize the poorly water-soluble AP, polysorbate 80 was utilized in the current study because it acts as an effective emulsifier and stabilizer in the preparation of NPs.23 In the NP preparation, the C18 chain of polysorbate 80 is partitioned into the polymer matrix via hydrophobic interactions; however, the hydrogen bonding between the polyoxyethylene group of polysorbate 80 and the carboxyl group of PLGA leads to the covering of polysorbate 80 on the surface of the NPs,26 which prevents further aggregation among the formed particles by steric repulsion and results in stabilized NPs.28 In addition, in a previous study,29 the smallest NP size was achieved with the application of polysorbate 80 compared with the use of other surfactants (including sodium dodecyl sulfate, macrogol 6000, sodium carboxymethyl cellulose, and sodium carboxymethyl dextran). Furthermore, polysorbate 80 is known to be an inhibitor of P-gp, the membrane protein responsible for transporting xenobiotics back into the extracellular space.30 P-gp is localized in many tissues, particularly in the capillary endothelial cells of the brain and the columnar epithelial cells of the lower GIT. P-gp forms a major physiological barrier and limits drug entry into systemic circulation from the small intestine, leading to poor oral bioavailability.31 In the present study, the prepared NPs were coated with polysorbate 80, which potentially enhanced oral absorption of the drug by inhibiting the efflux by P-gp.
Formulation optimization
The EE and DL results from the experiments based on UD are presented in Table 1. Quadratic polynomial equations with high correlation coefficients for the EE (Equation 4) and DL (Equation 5) were fit, and all of the dependent variables were found to be well described:
YEE% =−11.388X1−20.598X2 +0.21X12 +0.629X22 −0.225X32 +0.375X1X2 +279.84 (r2=0.99, P<0.01) | (4) |
YDL% =2.327X2 –0.020X1X2 –0.382X2X3–1.012X32 +16.602X3 –46.994 (r2=0.96, P<0.01) | (5) |
The variables X1, X2, and X3 represent the PLGA concentration, the volume ratio of the aqueous phase to the oil phase, and the AP feeding amount, respectively.
The 3D response surface plots and its corresponding 2D contour plots were obtained based on the model regression equation (Equations 4 and 5, respectively) using the Origin-Pro software (version 9.0, OriginLab, Northampton, MA, USA). Because a response surface plot can only express a function of two variables,32 in this study, we held one of the three variables at the intermediate level within its range to evaluate the influences of the other two variables and their interactions. By keeping variable X1 at the intermediate level (18 mg/mL), the combined effects of variable X2 and X3 on the DL were investigated. As shown in Figure 3A, the DL value increased as variable X3 increased. Similarly, by keeping the variable X2 and X3 at the intermediate level, respectively, the combined effects of the other two variables were observed in the response surface and contour plots (Figure 3B and C). Based on this comprehensive analysis, we found that the DL value was greatly influenced by variable X3. We therefore maintained variable X3 at its highest level (7 mg) and overlaid the DL and EE contour plots. Naturally, the common parts (green areas) of the contour plots (Figure 4) were the optimal areas for the variables X1 and X2. Considering all factors, including higher DL and EE values as well as AP solubility, the optimized results were as follows: X1=18 mg/mL, X2=4, X3=7 mg.
 | Figure 3 Response surface and contour plots showing the effects of the PLGA concentration, the volume ratio of the aqueous phase to the oil phase, and the AP feeding amount on the DL. |
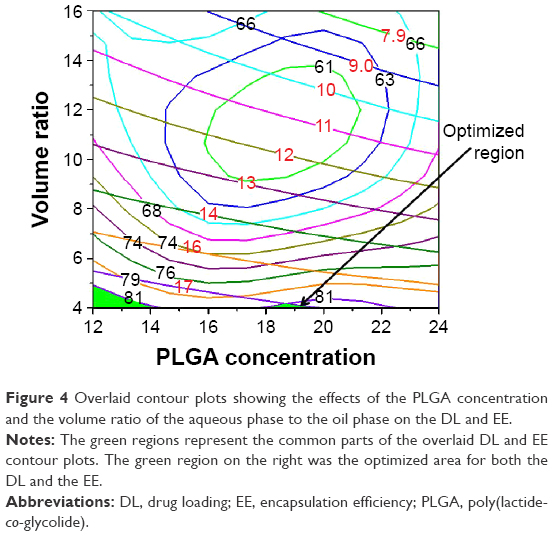 | Figure 4 Overlaid contour plots showing the effects of the PLGA concentration and the volume ratio of the aqueous phase to the oil phase on the DL and EE. |
Compared to the traditional experimental design methods used in RSM, such as central composite design, UD is capable of selecting experimental points uniformly in the experimental region and highly representative in the experimental domain and can be used to investigate more factors with substantially fewer experimental trials, because it determines the number of experimental trials only by the level of factors, rather than by the number of factors.18,33 A combination of UD and RSM can achieve the optimization of a complex multivariate process with the fewest multilevel experiments.34 Therefore, a combination of UD and RSM was used in this study to optimize the formulation of AP-PLGA-NPs.
The final mathematical model was verified experimentally. The predicted results from the model for EE and DL were 86.54% and 16.80%, respectively, whereas the respective experimental results were 90.51% and 17.07%. The low bias indicated that UD combined with RSM was a good predictor of the NP preparation.
Characterization of the NPs
Particle size and size distribution
The average particle size of the prepared NPs was 145.0±1.3 nm, with a PI value of 0.153 (Figure 5A). The PI represents NP stability and uniformity of formation. The PI value reflects the particle size distribution; samples with a wider range of particle sizes have higher PI value, whereas samples consisting of evenly sized particles have lower PI value.35 In our study, a low PI value of 0.153 indicates the uniformity and stability of the prepared samples.
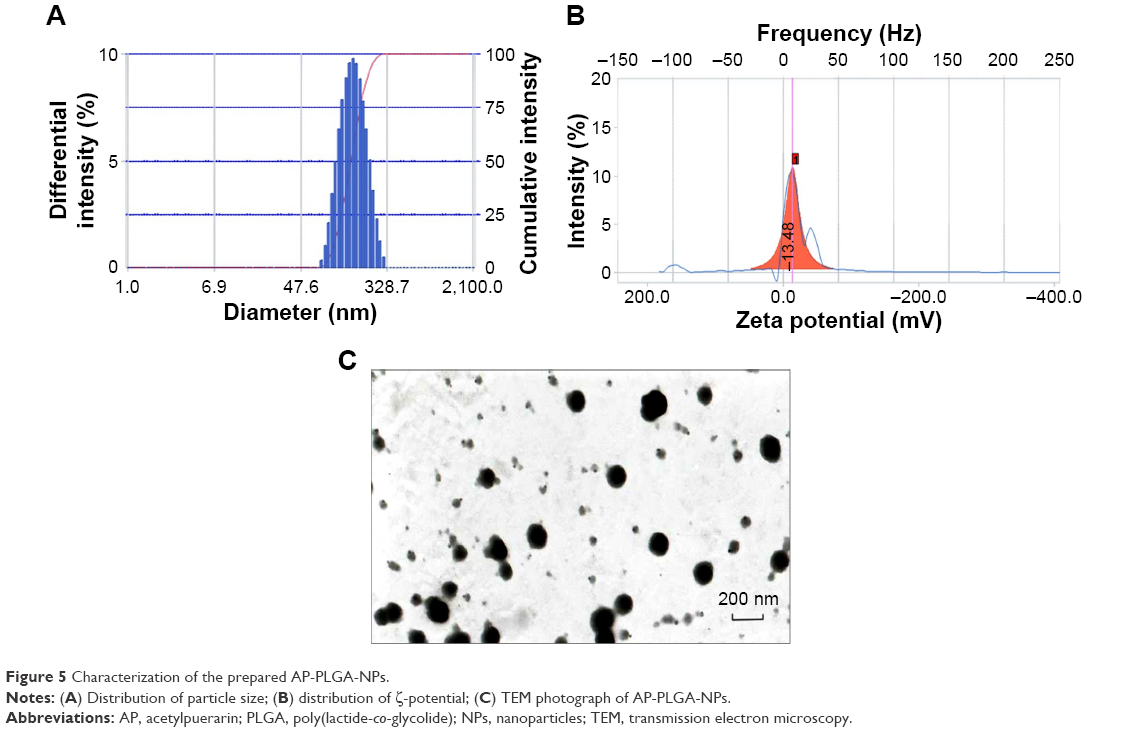 | Figure 5 Characterization of the prepared AP-PLGA-NPs. |
Particle size is an important parameter that influences the biodistribution and pharmaceutical properties of particle preparations. Particle uptake is generally considered size dependent, as the uptake of smaller particles is easier.36 However, the cellular uptake of NPs has an optimal size range. It was reported37 that NPs within the 100–200 nm size range had the best properties for cellular uptake, and smaller-sized (50 nm) or larger-sized (≥500 nm) particles had reduced uptake, indicating the existence of an optimal range and a key role for size in the extent of the uptake. It is assumed that particles up to ~100–200 nm in size can be internalized by receptor-mediated endocytosis and that larger particles may be taken up by phagocytosis.38 In addition, in oral delivery, NPs smaller than 200 nm may minimize reticuloendothelial system clearance.39 Thus, we can presume that the prepared NPs could be efficiently taken up after oral administration.
ζ-potential
The mean ζ-potential of the AP-PLGA-NPs was found to be −14.81±1.39 mV (Figure 5B), whereas that of the empty NPs was −36.13±3.35 mV. The negative ζ-potential of empty NPs results from the free end of the carboxyl group in PLGA,37 and the change in surface charge for drug-loaded NPs may be caused by the positive charge of the oxonium salt of AP. ζ-Potential is an essential property that influences the physical stability of a colloidal dispersion because the electrostatic repulsion between the particles can prevent aggregation of the spheres and thus stabilize particle suspensions.40 It has been found that particles with a negative charge can be taken up by the Peyer’s patches in the mucus-secreting lining of the small intestine and can then be translocated into the systemic circulation.41
Morphology
The morphological characteristics of the NPs were observed using TEM. As shown in Figure 5C, the prepared AP-PLGA-NPs were spherical and uniform in shape with a smooth surface, which was consistent with the data for the particle size distribution.
EE and DL
As mentioned earlier, high EE of 90.51% and DL of 17.07% were obtained under the optimized experimental conditions. Many factors may affect EE and DL including polymer and drug affinity, drug solubility, internal volume of the hydrophobic matrix, drug and polymer natures, and drug concentration in the formulation.42 In the present study, AP is a water-insoluble drug and can be easily encapsulated in the hydrophobic matrix. Studies showed that a higher concentration of PLGA generally led to higher EE and also affected the correlation between the drug and the polymer.42,43 An increase in the drug/polymer ratio resulted in an increased EE. This relationship was confirmed in our study, where PLGA NPs had a drug/polymer ratio of ~1:3 (7 mg drug and 18 mg polymer).
In vitro release
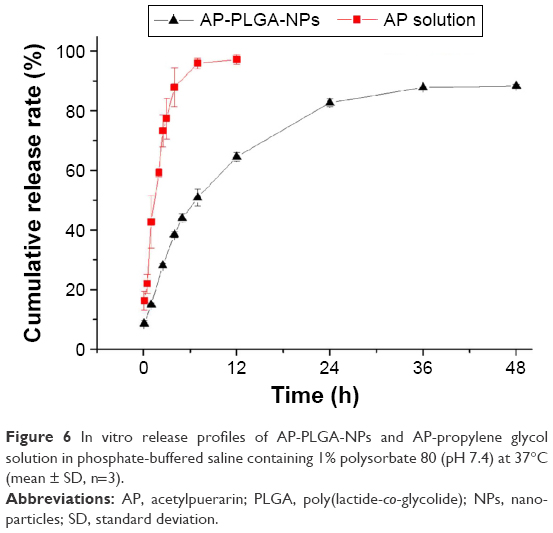
The release profiles of the AP-PLGA-NPs and AP-propylene glycol solution are shown in Figure 6. The release of AP from the controlled propylene glycol solution was found to be much faster, with ~90% released in 4 hours, whereas only 38% of the drug was released from the PLGA NPs in the same period. In addition, less than 90% of the drug was released from the PLGA NPs after 48 hours, indicating sustained drug release. The release profile of the AP-PLGA-NPs showed a biphasic pattern, with an initial burst release followed by a sustained release phase. The initial burst release was attributed to the weakly bound or absorbed drug on the surface of the NPs. Thereafter, the release rate decreased, reflecting the release of the drug entrapped in the NPs. The slower release in the second phase may be controlled by the drug diffusion rate across the polymer matrix or by the degradation of the polymer.36
 | Figure 6 In vitro release profiles of AP-PLGA-NPs and AP-propylene glycol solution in phosphate-buffered saline containing 1% polysorbate 80 (pH 7.4) at 37°C (mean ± SD, n=3). |
The release kinetics were characterized by fitting the data obtained from the in vitro release study to standard model release equations, and r values were calculated to check the best model fit. The AP-propylene glycol solution was found to have a higher r value (0.95) for the first-order kinetic model, which meant that the drug release was concentration dependent, whereas the release pattern of the AP-PLGA-NPs followed Higuchi’s model, suggesting diffusion-controlled release.44
Pharmacokinetics in rats
The metabolite PUE was identified and determined in the rat plasma after oral administration of the AP formulations. As shown in Figure 7, at all time points, the plasma concentrations of PUE in the test group (AP-PLGA-NPs) were significantly higher than those in the control group (AP suspension). At 12 hours postadministration, the mean plasma concentration of PUE in the rats treated with AP-PLGA-NPs was maintained at a high level of 97.00±12.45 ng/mL, whereas in the rats treated with AP suspension, the concentration was only 7.64±2.44 ng/mL.
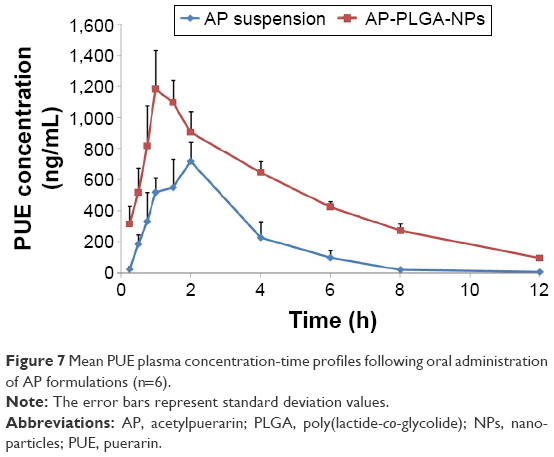 | Figure 7 Mean PUE plasma concentration-time profiles following oral administration of AP formulations (n=6). |
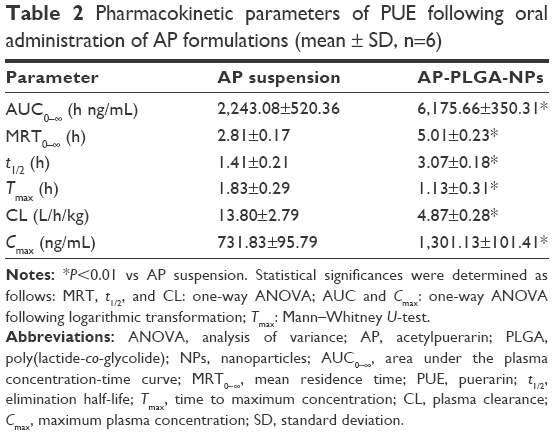
The pharmacokinetic parameters of PUE are presented in Table 2. The Tmax value of PUE was 1.13±0.31 hours for the AP-PLGA-NPs and 1.83±0.29 hours for the AP suspension, indicating that more rapid drug absorption was achieved using the PLGA NPs. The elimination half-life (t1/2) value of PUE in the test group was 3.07±0.18 hours, which was much longer than the 1.41±0.21 hours value found in the control group, suggesting a prolonged residence time for the AP-PLGA-NPs in rats. The area under the plasma concentration-time curve (AUC0−∞) and the Cmax values of PUE in the test group were 6,175.66±350.31 h ng/mL and 1,301.13±101.41 ng/mL, which were 2.75 and 1.78 times greater than those in the control group, respectively. This increase demonstrates a significant enhancement in drug absorption.
 | Table 2 Pharmacokinetic parameters of PUE following oral administration of AP formulations (mean ± SD, n=6) |
The results indicate that PLGA NPs can accelerate the absorption of PUE but delay its elimination in rats, thus increasing the AUC and enhancing the oral bioavailability of the drug. The improvement in bioavailability may be attributed to the following causes:
- A lipophilic drug or lipid formulation can be delivered to the systemic circulation without suffering hepatic first-pass effects from intestinal lymphatic transport.45,46 In the present study, the PLGA NPs transported the loaded drug to the intestinal lymphoid tissue after absorption through the M cells in Peyer’s patches and thereafter into systemic circulation through the mesenteric lymph ducts, thus enhancing drug absorption.47
- The large surface area of the NPs allows more drugs to interact with the GIT fluid, leading to more drug dissolution and absorption.48
- The PLGA NPs protect the entrapped drug from GIT degradation as well as gut wall metabolism, ensuring drug stability in the GIT before absorption.49
- The bioadhesive properties of the polymer contribute to the increased rate of absorption. It has been reported that particles synthesized from polymers such as PLGA could achieve mucoadhesion via hydrogen bonding, polymer entanglements with mucins, hydrophobic interactions, or a combination of these mechanisms, which could lead to a prolonged residence time in vivo and improved oral bioavailability of drugs.50
- Use of the surfactant polysorbate 80 in the NP preparation can solubilize the drug in the digestion medium, inhibit the efflux by P-gp in the endothelial cells of the intestinal mucosa, and help the drug-loaded NPs to penetrate the mucus barriers, resulting in further improvement of drug absorption.30
In our previous study,15 the AUC value of AP in d-α-tocopheryl polyethylene glycol 1,000 succinate (TPGS) nanoemulsions was 5,760±560 ng h/mL; however, a higher AUC value of 6,175.66±350.31 h ng/mL was achieved in the present study using PLGA NPs, indicating a higher oral absorption. The possible reason could be that polysorbate 80 coated on the PLGA NPs inhibited the efflux by P-gp and thus enhanced drug absorption.
Conclusion
In the present study, AP-PLGA-NPs were successfully prepared using a solvent diffusion method optimized with a combination of UD and RSM. The NPs were characterized in terms of their morphology, particle size, ζ-potential, EE, DL, and in vitro drug release. The AP-PLGA-NPs showed an initial burst release followed by a sustained release in vitro, consistent with Higuchi’s diffusion mechanism. The oral pharmacokinetic study in rats indicated that the PLGA NPs greatly prolonged the drug residence time and increased the drug absorption in rats after oral administration, and the AP-PLGA-NPs showed a 2.75-fold increase in relative bioavailability compared with the AP suspension. These findings indicate that, as an oral drug delivery system, PLGA NPs can significantly enhance the oral bioavailability of AP.
Acknowledgments
This work was supported by Seed Fund of the Second Hospital of Shandong University (No S2015010019) and National Natural Science Foundation of China (No 81503061).
Disclosure
The authors report no conflicts of interest in this work.
References
Ensign LM, Cone R, Hanes J. Oral drug delivery with polymeric nanoparticles: the gastrointestinal mucus barriers. Adv Drug Deliv Rev. 2012;64(6):557–570. | ||
Zhang L, Wang S, Zhang M, Sun J. Nanocarriers for oral drug delivery. J Drug Target. 2013;21(6):515–527. | ||
Zhang Z, Gao F, Jiang S, Ma L, Li Y. Nano-based drug delivery system enhances the oral absorption of lipophilic drugs with extensive presystemic metabolism. Curr Drug Metab. 2012;13(8):1110–1118. | ||
Gupta S, Kesarla R, Omri A. Formulation strategies to improve the bioavailability of poorly absorbed drugs with special emphasis on self-emulsifying systems. ISRN Pharm. 2013;2013:848043. | ||
Agrawal U, Sharma R, Gupta M, Vyas SP. Is nanotechnology a boon for oral drug delivery. Drug Discov Today. 2014;19(10):1530–1546. | ||
Xie X, Tao Q, Zou Y, et al. PLGA nanoparticles improve the oral bioavailability of curcumin in rats: characterizations and mechanisms. J Agric Food Chem. 2011;59(17):9280–9289. | ||
Kumari A, Yadav SK, Yadav SC. Biodegradable polymeric nanoparticles based drug delivery systems. Colloids Surf B Biointerfaces. 2010;75(1):1–18. | ||
Kapoor DN, Bhatia A, Kaur R, Sharma R, Kaur G, Dhawan S. PLGA: a unique polymer for drug delivery. Ther Deliv. 2015;6(1):41–58. | ||
Danhier F, Ansorena E, Silva JM, Coco R, Le BA, Preat V. PLGA-based nanoparticles: an overview of biomedical applications. J Control Release. 2012;161(2):505–522. | ||
Alibolandi M, Alabdollah F, Sadeghi F, et al. Dextran-b-poly(lactide-co-glycolide) polymersome for oral delivery of insulin: in vitro and in vivo evaluation. J Control Release. 2016;227:58–70. | ||
Li Z, Liu K, Sun P, et al. Poly(d, l-lactide-co-glycolide)/montmorillonite nanoparticles for improved oral delivery of exemestane. J Microencapsul. 2013;30(5):432–440. | ||
Paul A, Das S, Das J, Samadder A, Khuda-Bukhsh AR. Cytotoxicity and apoptotic signalling cascade induced by chelidonine-loaded PLGA nanoparticles in HepG2 cells in vitro and bioavailability of nano-chelidonine in mice in vivo. Toxicol Lett. 2013;222(1):10–22. | ||
Liu DM, Wang ZH, Liu L, Zhang XM, Lou FL. Acetylpuerarin increases cell viability and reduces apoptosis in rat hippocampal neurons following oxygen glucose deprivation/reperfusion. Mol Med Rep. 2013;8(5):1453–1459. | ||
Xiang Y, Wei X, Chen L, et al. Anti-inflammatory effect of acetylpuerarin on eicosanoid signaling pathway in primary rat astrocytes. J Mol Neurosci. 2014;52(4):577–585. | ||
Sun D, Wei X, Xue X, et al. Enhanced oral absorption and therapeutic effect of acetylpuerarin based on d-α-tocopheryl polyethylene glycol 1000 succinate nanoemulsions. Int J Nanomed. 2014;9:3413–3423. | ||
Zhang Y, Zhong GY, Li YM, et al. Research on synthesis and bioavailability of puerarin acetyl derivatives. Nat Prod Res Dev. 2010; 22:73–76. | ||
Sun D, Xue A, Zhang B, Lou H, Shi H, Zhang X. Polysorbate 80-coated PLGA nanoparticles improve the permeability of acetylpuerarin and enhance its brain-protective effects in rats. J Pharm Pharmacol. 2015;67(12):1650–1662. | ||
Wang JP, Chen YZ, Wang Y, Yuan SJ, Yu HQ. Optimization of the coagulation-flocculation process for pulp mill wastewater treatment using a combination of uniform design and response surface methodology. Water Res. 2011;45(17):5633–5640. | ||
Liu Z, Zhao H, Shu L, et al. Preparation and evaluation of Baicalin-loaded cationic solid lipid nanoparticles conjugated with OX26 for improved delivery across the BBB. Drug Dev Ind Pharm. 2015;41(3):353–361. | ||
Zhang X, Sun M, Zheng A, Cao D, Bi Y, Sun J. Preparation and characterization of insulin-loaded bioadhesive PLGA nanoparticles for oral administration. Eur J Pharm Sci. 2012;45(5):632–638. | ||
Mahajan HS, Mahajan PR. Development of grafted xyloglucan micelles for pulmonary delivery of curcumin: in vitro and in vivo studies. Int J Biol Macromol. 2016;82:621–627. | ||
Sun D, Xue A, Wu J, et al. Simultaneous determination of acetylpuerarin and puerarin in rat plasma by liquid chromatography-tandem mass spectrometry: application to a pharmacokinetic study following intravenous and oral administration. J Chromatogr B Analyt Technol Biomed Life Sci. 2015;995–996:24–30. | ||
Vaculikova E, Grunwaldova V, Kral V, Dohnal J, Jampilek J. Primary investigation of the preparation of nanoparticles by precipitation. Molecules. 2012;17(9):11067–11078. | ||
Lai P, Daear W, Lobenberg R, Prenner EJ. Overview of the preparation of organic polymeric nanoparticles for drug delivery based on gelatine, chitosan, poly(d,l-lactide-co-glycolic acid) and polyalkylcyanoacrylate. Colloids Surf B Biointerfaces. 2014;118:154–163. | ||
Makadia HK, Siegel SJ. Poly lactic-co-glycolic acid (PLGA) as biodegradable controlled drug delivery carrier. Polymers (Basel). 2011;3(3): 1377–1397. | ||
Wischke C, Schwendeman SP. Principles of encapsulating hydrophobic drugs in PLA/PLGA microparticles. Int J Pharm. 2008; 364(2):298–327. | ||
Zheng G, Selvam A, Wong JW. Enhanced solubilization and desorption of organochlorine pesticides (OCPs) from soil by oil-swollen micelles formed with a nonionic surfactant. Environ Sci Technol. 2012;46(21):12062–12068. | ||
Li X, Qin Y, Liu C, Jiang S, Xiong L, Sun Q. Size-controlled starch nanoparticles prepared by self-assembly with different green surfactant: the effect of electrostatic repulsion or steric hindrance. Food Chem. 2016;199:356–363. | ||
Vaculikova E, Placha D, Pisarcik M, et al. Preparation of risedronate nanoparticles by solvent evaporation technique. Molecules. 2014;19(11):17848–17861. | ||
Choi YA, Yoon YH, Choi K, et al. Enhanced oral bioavailability of morin administered in mixed micelle formulation with PluronicF127 and Tween80 in rats. Biol Pharm Bull. 2015;38(2):208–217. | ||
Zakeri-Milani P, Valizadeh H. Intestinal transporters: enhanced absorption through P-glycoprotein-related drug interactions. Expert Opin Drug Metab Toxicol. 2014;10(6):859–871. | ||
Pascacio-Villafan C, Lapointe S, Williams T, Sivinski J, Niedz R, Aluja M. Mixture-amount design and response surface modeling to assess the effects of flavonoids and phenolic acids on developmental performance of Anastrepha ludens. J Chem Ecol. 2014;40(3):297–306. | ||
Li DJ, Song JF, Xu AQ, Liu CQ. Optimization of the ultrasound-assisted synthesis of lutein disuccinate using uniform design. Ultrason Sonochem. 2014;21(1):98–103. | ||
Luo D. Optimization of total polysaccharide extraction from Dioscorea nipponica Makino using response surface methodology and uniform design. Carbohydr Polym. 2012;90(1):284–288. | ||
Masarudin MJ, Cutts SM, Evison BJ, Phillips DR, Pigram PJ. Factors determining the stability, size distribution, and cellular accumulation of small, monodisperse chitosan nanoparticles as candidate vectors for anticancer drug delivery: application to the passive encapsulation of [(14)C]-doxorubicin. Nanotechnol Sci Appl. 2015;8:67–80. | ||
Shah N, Chaudhari K, Dantuluri P, Murthy RS, Das S. Paclitaxel-loaded PLGA nanoparticles surface modified with transferrin and Pluronic((R))P85, an in vitro cell line and in vivo biodistribution studies on rat model. J Drug Target. 2009;17(7):533–542. | ||
Win KY, Feng SS. Effects of particle size and surface coating on cellular uptake of polymeric nanoparticles for oral delivery of anticancer drugs. Biomaterials. 2005;26(15):2713–2722. | ||
des Rieux A, Fievez V, Garinot M, Schneider YJ, Preat V. Nanoparticles as potential oral delivery systems of proteins and vaccines: a mechanistic approach. J Control Release. 2006;116(1):1–27. | ||
Shah U, Joshi G, Sawant K. Improvement in antihypertensive and antianginal effects of felodipine by enhanced absorption from PLGA nanoparticles optimized by factorial design. Mater Sci Eng C Mater Biol Appl. 2014;35:153–163. | ||
das Neves J, Amiji M, Bahia MF, Sarmento B. Assessing the physical–chemical properties and stability of dapivirine-loaded polymeric nanoparticles. Int J Pharm. 2013;456(2):307–314. | ||
Tariq M, Alam MA, Singh AT, Iqbal Z, Panda AK, Talegaonkar S. Biodegradable polymeric nanoparticles for oral delivery of epirubicin: in vitro, ex vivo, and in vivo investigations. Colloids Surf B Biointerfaces. 2015;128:448–456. | ||
Silveira N, Longuinho MM, Leitão SG, et al. Synthesis and characterization of the antitubercular phenazine lapazine and development of PLGA and PCL nanoparticles for its entrapment. Mater Sci Eng C Mater Biol Appl. 2016;58:458–466. | ||
Cun D, Jensen DK, Maltesen MJ, et al. High loading efficiency and sustained release of siRNA encapsulated in PLGA nanoparticles: quality by design optimization and characterization. Eur J Pharm Biopharm. 2011;77(1):26–35. | ||
Dhana Lekshmi LU, Poovi G, Kishore N, Reddy PN. In vitro characterization and in vivo toxicity study of repaglinide loaded poly(methyl methacrylate) nanoparticles. Int J Pharm. 2010;396(1–2):194–203. | ||
Nauli AM, Nauli SM. Intestinal transport as a potential determinant of drug bioavailability. Curr Clin Pharmacol. 2013;8(3):247–255. | ||
Zhou A, Lu T, Wang L, et al. Lymphatic transport of puerarin occurs after oral administration of different lipid-based formulations to unconscious lymph duct-cannulated rats. Pharm Dev Technol. 2014;19(6):743–747. | ||
Gao Y, Wang Y, Ma Y, et al. Formulation optimization and in situ absorption in rat intestinal tract of quercetin-loaded microemulsion. Colloids Surf B Biointerfaces. 2009;71(2):306–314. | ||
Pridgen EM, Alexis F, Farokhzad OC. Polymeric nanoparticle technologies for oral drug delivery. Clin Gastroenterol Hepatol. 2014;12(10): 1605–1610. | ||
Khan S, Baboota S, Ali J, Khan S, Narang RS, Narang JK. Nanostructured lipid carriers: an emerging platform for improving oral bioavailability of lipophilic drugs. Int J Pharm Investig. 2015;5(4):182–191. | ||
Lai SK, Wang YY, Hanes J. Mucus-penetrating nanoparticles for drug and gene delivery to mucosal tissues. Adv Drug Deliv Rev. 2009; 61(2):158–171. |
 © 2016 The Author(s). This work is published and licensed by Dove Medical Press Limited. The full terms of this license are available at https://www.dovepress.com/terms.php and incorporate the Creative Commons Attribution - Non Commercial (unported, v3.0) License.
By accessing the work you hereby accept the Terms. Non-commercial uses of the work are permitted without any further permission from Dove Medical Press Limited, provided the work is properly attributed. For permission for commercial use of this work, please see paragraphs 4.2 and 5 of our Terms.
© 2016 The Author(s). This work is published and licensed by Dove Medical Press Limited. The full terms of this license are available at https://www.dovepress.com/terms.php and incorporate the Creative Commons Attribution - Non Commercial (unported, v3.0) License.
By accessing the work you hereby accept the Terms. Non-commercial uses of the work are permitted without any further permission from Dove Medical Press Limited, provided the work is properly attributed. For permission for commercial use of this work, please see paragraphs 4.2 and 5 of our Terms.