Back to Journals » Neuropsychiatric Disease and Treatment » Volume 17
EMT-Related Markers in Serum Exosomes are Potential Diagnostic Biomarkers for Invasive Pituitary Adenomas
Authors Chen K, Li G, Kang X, Liu P, Qian L, Shi Y, Osman RA, Yang Z, Zhang G
Received 22 September 2021
Accepted for publication 1 December 2021
Published 21 December 2021 Volume 2021:17 Pages 3769—3780
DOI https://doi.org/10.2147/NDT.S339067
Checked for plagiarism Yes
Review by Single anonymous peer review
Peer reviewer comments 3
Editor who approved publication: Professor Taro Kishi
Kelin Chen,1– 3,* Guoge Li,1,* Xixiong Kang,1– 3 Pinan Liu,4 Lingye Qian,1 Yijun Shi,1 Rasha Alsamani Osman,1 Zhijun Yang,4 Guojun Zhang1– 3
1Department of Clinical Diagnosis, Laboratory of Beijing Tiantan Hospital, Capital Medical University, Beijing, People’s Republic of China; 2NMPA Key Laboratory for Quality Control of In Vitro Diagnostics, Beijing, China; 3Beijing Engineering Research Center of Immunological Reagents Clinical Research, Beijing, People’s Republic of China; 4Department of Neurosurgery of Beijing Tiantan Hospital, Capital Medical University, Beijing, China
*These authors contributed equally to this work
Correspondence: Guojun Zhang
Department of Clinical Diagnosis, Laboratory of Beijing Tiantan Hospital, Capital Medical University, No. 119 Nansihuan West Road, Fengtai District, Beijing, China
, Email [email protected]
Zhijun Yang
Department of Neurosurgery of Beijing Tiantan Hospital, Capital Medical University, NO. 119 Nansihuan West Road, Fengtai District Beijing, China Email [email protected]
Purpose: Assessing the invasiveness of pituitary adenomas (PAs) is critical to making the best surgical and treatment plan. However, it is difficult to determine the invasiveness of pituitary adenomas based on current clinical methods, such as imaging and histological methods. The present article aims to investigate noninvasive methods to discover viable biomarkers for invasive pituitary adenomas and provide a basis for early intervention of pituitary adenomas.
Methods: E-cadherin, N-cadherin, Epcam, TGF-β, Smad3, and Smad7 were detected in the tissues and exosomes in 10 cases of invasive PAs and 10 cases of noninvasive PAs by real-time quantitative reverse transcription polymerase chain reaction (qRT-PCR), Western blotting, and immunohistochemical analysis.
Results: Compared with that in the noninvasive group, the expression of N-cad in the exosomes of the invasive group was significantly increased, and the expression of E-cad and Epcam was reduced. In the invasive group, the expression levels of TGF-β 1 and Smad3 were reduced. These results were consistent across exosomes and groups. In further cell experiments, the EMT ratio in the SIS3 treatment group, and especially in the TGF-β 1 plus SIS3 treatment group (P < 0.001), was significantly increased, and the EMT ratio was significantly lower when one-half the dose of TGF-β and SIS3.
Conclusion: The results indicate that EMT-related biomarkers in serum exosomes can be potentially used for assessing the invasiveness of pituitary adenoma.
Keywords: pituitary adenoma, serum exosomes, epithelial-mesenchymal transition, TGF-β/Smad, invasiveness
Graphical Abstract:

Introduction
Pituitary adenoma is a relatively common neuroendocrine tumor that represents 10–15% of intracranial neoplasms.1 Pituitary adenomas can be classified as functional pituitary adenomas (FPAs) or nonfunctional pituitary adenomas (NFPAs) according to the clinical perspective.2 FPAs often accompany changes in hormone levels and can be treated with drugs or surgical intervention. NFPAs account for more than 40% of all pituitary adenomas, and they are frequently difficult to diagnose until they become a large tumor mass, and hypopituitarism, visual field defects, or neurological symptoms are observed due to the production of fewer functional hormones. NFPAs are more difficult to treat than FPAs because there are nearly no clinical signs until the NFPAs reach a large enough mass to produce compression symptoms. Although pituitary adenomas are considered benign, they also show early aggressive behavior associated with the invasion into adjacent structures such as the cavernous sinus, skull base, and sphenoid sinus when clinical symptoms are atypical; this type of adenoma is called invasive pituitary adenoma (IPA).3 During tumor surgery, complete resection is almost impossible because of the invasion into adjacent structures, and other treatment options (such as postoperative chemotherapy and radiotherapy) have traditionally been ineffective.4 As a result, the diagnosis, phenotype and real-time monitoring of invasive pituitary adenomas remain challenging. It is difficult to assess the biological characteristics of tumors based on current clinical approaches, namely, imaging and histology. Currently, there is a lack of accurate noninvasive methods and viable biomarkers for the diagnosis of invasive pituitary adenomas.5
Exosomes are extracellular vesicles with a lipid bilayer and are 20–100 nm in diameter. They can carry a variety of proteins, mRNAs, microRNAs, and DNA and participate in important physiological and pathological processes, such as cell communication, cell migration, angiogenesis, and tumor cell growth. These functions make exosomes interesting sources of potential cancer biomarkers.6 In recent years, a many studies have shown that exosomes can act on the central nervous system by passing the blood-brain barrier.7 Although certain circulating tumor cells (CTCs) CTCs are used worldwide as markers, there is a particular need for new biomarkers due to the technological limitations of CTC detection. In this regard, exosomes have constituted an important research area in recent years.
The epithelial-mesenchymal transition (EMT) is a unique process that transforms polar, immobile epithelial cells into mesenchymal cells. This change is usually accompanied by a decrease in the strengthening intercellular adhesion proteins such as E-cadherin and Epcam and an increase in the expression of mesenchymal markers such as vimentin and N-cadherin.8 M Yilmaz and G Christofori found that the EMT plays an important role in tumor invasion and metastasis.9 Through EMT phenotypic transformation, cells that have no invasion or migration ability can gain the ability to infiltrate and metastasize during tumorigenesis and ultimately be transferred to other tissues or organs. Consisting with previous studies,10 we confirmed that epithelial markers (such as Epcam) are underexpressed in exosomes in invasive pituitary adenomas. These results led us to investigate whether the expression of epithelial markers is low in exosomes and whether exosomes can be used to evaluate invasiveness of tissues and thus have potential clinical applications. The purpose of this study was to verify the expression and molecular mechanism of EMT-related signals in exosomes and tissues and to explore the value of exosomes for diagnosing invasive pituitary adenomas.
Materials and Methods
Serum and Tissue Collection from Patients
This study was authorized by Beijing Tian Tan Hospital, Capital Medical University (KY2014-021-02). Twenty pituitary adenoma patients were enrolled on the basis of an institutional board approved protocol. All patients signed the informed consent form. The study complies with the principles of the Declaration of Helsinki. Peripheral blood was taken before the surgery, and pituitary adenoma tissues were obtained during the surgery with informed consent. The serum was extracted by centrifugation at 2500 g for 10 min and was then aliquoted in 1.5-mL centrifugal tubes. Then, the serum and tissues were stored at −80°C for further analysis.
Isolation of Exosomes
Exosomes in serum were isolated by ultracentrifugation: 800 µL of serum was spun at 800 g for 5 min to precipitate all the cells, followed by centrifugation at 2000 g for 10 min to precipitate large cell debris. Then, the supernatant was ultracentrifuged at 150,000 g for 6 h and 2 h to obtain exosomes that stick to the wall of the tube, and the exosomes were then resuspended in 100 µL of PBS and stored at −80°C for preservation.
The Characterization of Exosomes
We fixed exosomes in 2% paraformaldehyde in PBS. Then We deposited five microliters of exosomes on carbon-coated Formvar 400-mesh grids and held them for two minutes to allow the exosomes to absorb. The grids were subsequently negatively stained with 1% buffered uranyl acetate and ddH2O for 45s. The grids were cleaned with ultrapure water and then dried in a cleaning culture dish for approximately 2 hours before using. Finally, the grids were observed using a transmission electron microscope (TEM) (HT-7700; Hitachi, Ltd., Japan) operated at 180 kV.
Nanoparticle Tracking Analysis
Nanoparticle tracking analysis (NTA) was performed to determine particle concentration and size with a ZetaView (Particle Metrix GmbH, Meerbusch, Germany) equipped with ZetaView 8.04.02 SP2 analytical software. A syringe was used for sample injection, and exosomes were diluted in PBS before the analysis. These parameters were used in the analysis: maximum size 1000, minimum size 10, minimum brightness 30, sensitivity 65, and shutter 100.
Western Blot Analysis of Exosome Proteins
The protein concentration of the exosome suspension was determined by a bicinchoninic acid (BCA) protein assay kit (Solarbio, PC0020). The exosomes were first lysed by lysis buffer (Cell Signaling Technology, 9803 s) on ice for 30 minutes, followed by ultrasonic lysis. The BCA experimental procedure was performed precisely according to the manufacturer’s instructions, and the absorbance value at 562 nm was obtained with a microplate reader. The protein concentration of exosomes was obtained by BCA protein assay as described above. Equal amounts of total protein from each sample were resolved using 10% sodium dodecyl sulfate-polyacrylamide gel electrophoresis (SDS-PAGE) and then transferred to polyvinylidene difluoride (PVDF) membranes (Roche, Shanghai, China). After blocking with 5% nonfat milk in Tris-buffered saline Tween (TBST) for 1 h, the membranes were incubated with various primary antibodies overnight and an appropriate HRP-conjugated secondary antibody for 1 h. Density analysis was detected using the ECL system. Proteins were detected with the following antibodies: CD63 (Abcam), CD81 (Abcam), TGF-β1 (Abcam), E-cadherin (Abcam), N-cadherin (Abcam), and Epcam (Abcam).
RNA Extraction and RT-qPCR
Total RNA was extracted from exosomes using the RNeasyMini Kit (QIAGEN, Germany) according to the manufacturer’s instructions. Reverse transcription was performed with the PrimeScript™ RT reagent Kit with gDNA Eraser (TaKaRa, Japan) according to the manufacturer’s instructions. Primers were designed and synthesized by Invitrogen to locate gene sequences (Table 1). Quantitative PCR (qPCR) was performed using SYBR Premix Ex Taq™ II, ROX Plus (TaKaRa, Japan), and a real-time PCR system (ABI7500, USA). The relative quantities of each gene were analyzed by 2−ΔΔCt.
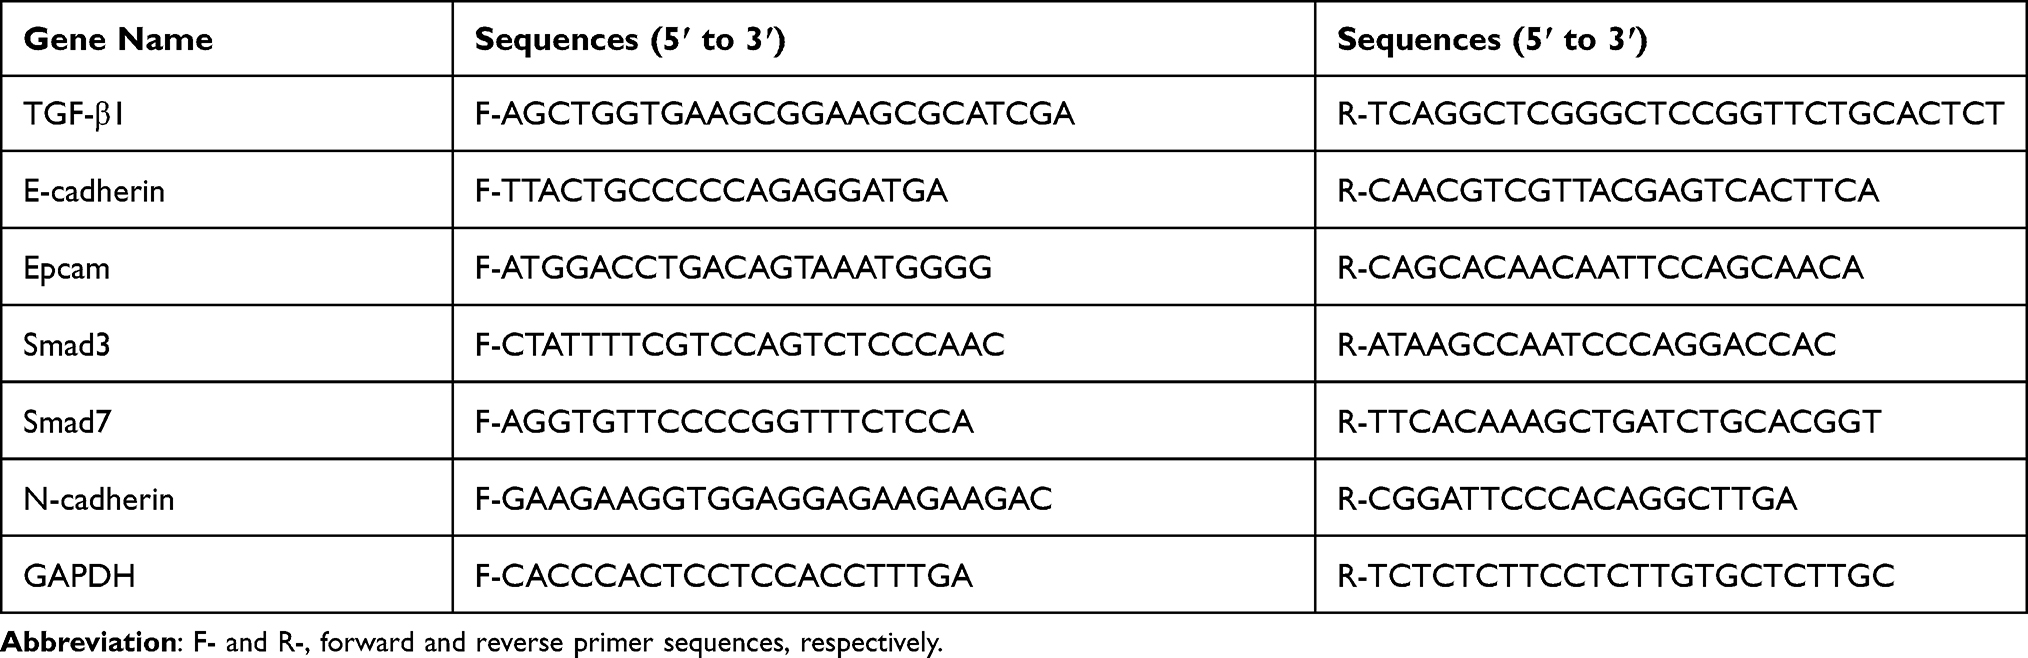 |
Table 1 Sequences of the Primers Used for RT-qPCR |
Immunofluorescence of Human Tissue Specimens
Immunohistochemistry was performed on 5-μm sections from paraffin-embedded pituitary adenoma blocks. After conventional xylene dewaxing and gradient ethanol hydration, the sectioned samples were placed in 0.01 mol/L sodium citrate buffer (pH 6.0), heated for antigen retrieval and then cooled to room temperature. The sections were then incubated in 0.3% hydrogen peroxide solution at room temperature for 30 min to inactivate endogenous peroxidase. Sections were subsequently blocked with 5% goat serum/0.3% Triton X for 1 h and then incubated with various primary antibodies overnight at 4°C. Next, the primary antibody was targeted with an appropriate HRP-conjugated secondary antibody (1:500) for 1 h. The reaction was visualized using DAB staining reagent (Zhongshan Golden Bridge, Beijing, China) to produce a brown product, and sections were counterstained with hematoxylin. Finally, each section was mounted in buffered glycerol, observed and photographed under a microscope (ZEISS Axio Vert. A1, Zeiss, Germany). For the immunohistochemical analyses, the following antibodies were used: anti-TGF-β1 (Abcam), anti-E-cadherin (Abcam), anti-N-cadherin (Abcam), anti-Epcam (Abcam), anti-vimentin (Abcam), anti-Smad3 (Abcam), and anti-Smad7 (Abcam).
Immunofluorescence Staining
Immunofluorescence staining was performed on the tissue sections. After blocking in 10% goat serum for 1 h, sections were incubated with primary antibodies followed by incubation with fluorescence-conjugated secondary antibodies (AF488; Invitrogen). Nuclei were counterstained with DAPI (Sigma) and observed by confocal microscopy (FLUOVIEW FV300, Olympus, Tokyo, Japan).
Western Blot Analysis for Tissue Specimens
The tissue homogenates were processed for immunoblotting studies. To extract protein from pituitary adenomas, ∼100 mg of tissue was homogenized in RIPA buffer on ice using a rotor/stator. Lysates were then centrifuged for 10 min at 10,000 g at 4°C. Supernatants were collected, and the protein concentrations were determined using a BCA assay kit followed by Western blot analysis. Equal amounts (20 μg) of proteins were separated by 10% sodium dodecyl sulfate–polyacrylamide gel electrophoresis (SDS-PAGE) and transferred to a polyvinyl difluoride membrane. Membranes were blocked at room temperature for 1 h in a blocking buffer containing 5% bovine serum albumin to prevent nonspecific binding and then incubated with an appropriate primary antibody at 4°C overnight. Density analysis was detected using the ECL system.
Cell Culture and Treatment
GH3 cells were obtained from a rat pituitary adenoma that spontaneously synthesizes and secretes both prolactin (PRL) and growth hormone (GH). The GH3 cell line was purchased from Cell Resource Center at Peking Union Medical College (Beijing, China). The use of this cell line did not require an ethics statement from the institutional review board. GH3 cells were cultured in 82.5% Ham’s F10 medium with 15% horse serum and 2.5% fetal calf serum, 100 U/mL penicillin, and 100 μg/mL streptomycin at 37°C in a humidified atmosphere of 95% air-5% CO2. The nutrient solution was changed every 3 days. GH3 cells were seeded in a six-well plate. When cells reached 70% to 80% confluence, they were serum-starved for 24 h and then stimulated with 3 μM SIS3 (Selleck Chemicals, Houston, TX; Cat. #S7959) and/or 20 ng/mL TGF-β1 (PeproTech, Rocky Hill, NJ; Cat. #100‐21) for the indicated times. Protein was collected at specific time points.
Statistical Analysis
All statistical analyses were performed with GraphPad Prism software. Unpaired t-test was used to calculate the difference in the expression of the markers, with a P-value of <0.05 determined to be statistically significant. In exosomes obtained from patients with invasive and noninvasive PA, protein and mRNA expression of EMT-related markers and TGF-β/Smad markers were normalized using the following equation:

where  represents the individual expression level of the marker proteins or mRNA in the exosomes or cells, which were tested by Western blot and qRT-PCR, respectively;
 represents the minimum value of the protein or mRNA expression level, and
  represents the maximum value of the protein or mRNA expression level.
The EMT tendency was calculated according to the following equation:
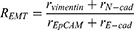
where r represents the normalized expression of the markers as calculated according to Equation 1.
Results
Exosomes Were Characterized Using TEM, Western Blot and NTA
First, we verified the existence of exosomes by transmission electron microscopy (TEM), and their morphology displayed classical aspects (Figure 1A). Analysis by TEM revealed that the exosomes had a size of 100–250 nm, which is consistent with the results obtained through the nanoparticle tracking system (Figure 1B). The purity of the exosomes was determined by Western blotting with a panel of exosomes markers. TSG101, CD63 and CD81 and showed a positive band, indicating the purity of the exosomes samples (Figure 1C).
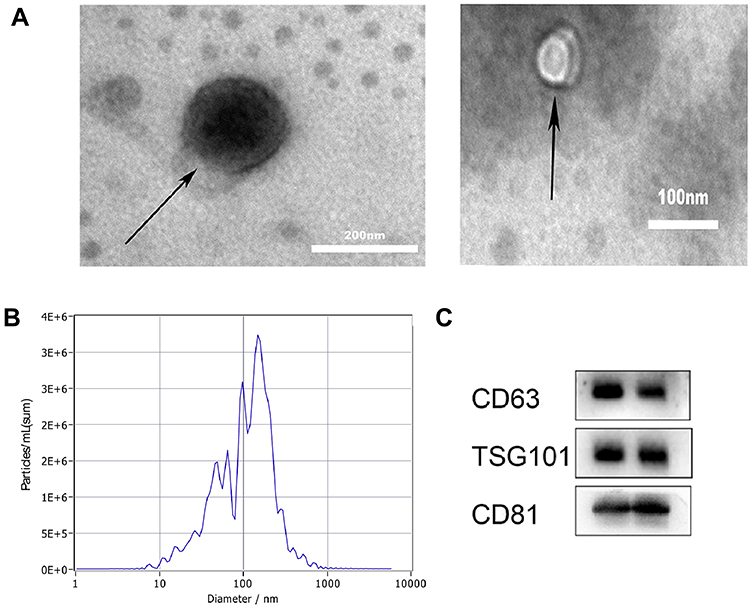 |
Figure 1 Characterizing exosomes. (A) Transmission electron microscopy (TEM) images showing the morphology of isolated exosomes. (B) Nanoparticle tracking analysis (NTA) revealed the size distribution and particle concentration of isolated exosomes. (C) Western blot analysis confirmed EV-specific protein marker expression. |
The Expression of TGF-β1/Smads and EMT-Related Markers in Pituitary Adenoma Tissues
Expression levels for each protein were detected by two methods(immunohistochemistry and Western blot), and their results were consistent. Western blot and immunohistochemistry revealed that the N-cad/Vimentin expression in invasive tissues (n=3) was significantly higher than that in non-invasive tissues (n=2). Additionally, the expression of E-cad and Epcam was significantly lower in the invasive group than the non-invasive group(Figures 2 and 3A and B). The key proteins of TGF-β/Smads pathway’s were also detected using immunohistochemistry and Western blot assays (Figures 4 and 3A and B). Although TGF-β1 and Smad3 expression levels were higher in the non-invasive group than in the invasive group, there was no significant statistical difference between these groups due to the small sample size.
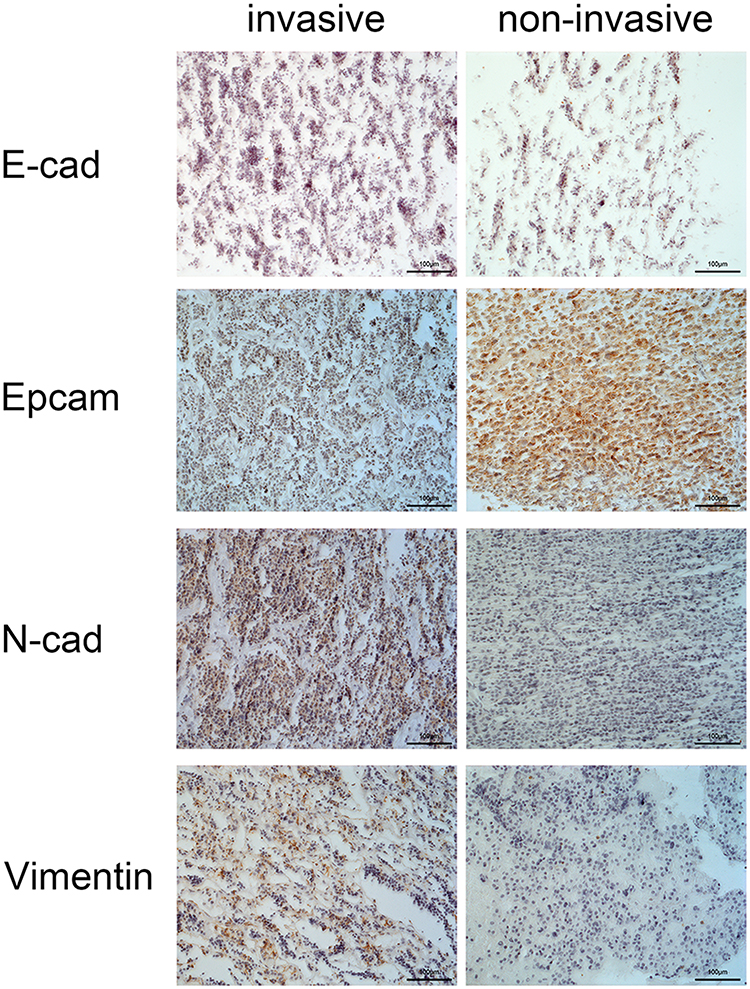 |
Figure 2 Immunohistochemical staining of EMT-related marker proteins in representative tissue specimens. Immunohistochemical staining for E-cad, Epcam, N-cad, and vimentin in pituitary adenoma tissue in each group as observed with a Zeiss microscope (20×). |
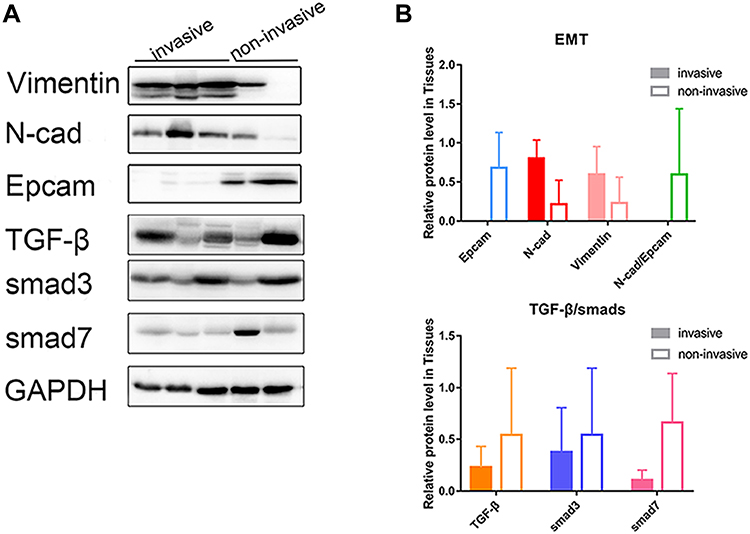 |
Figure 3 Protein expression of TGF-β/Smad and EMT-related markers and in tissues of pituitary adenomas was analyzed by Western blot analysis. (A) A representative Western blot of EMT-related markers and TGF-β/Smad pathway protein in pituitary adenomas. GAPDH was probed as a loading control. (B) Quantitative analysis showed that the level of EMT-related markers and TGF-β/Smad protein. Internal control used was GAPDH. |
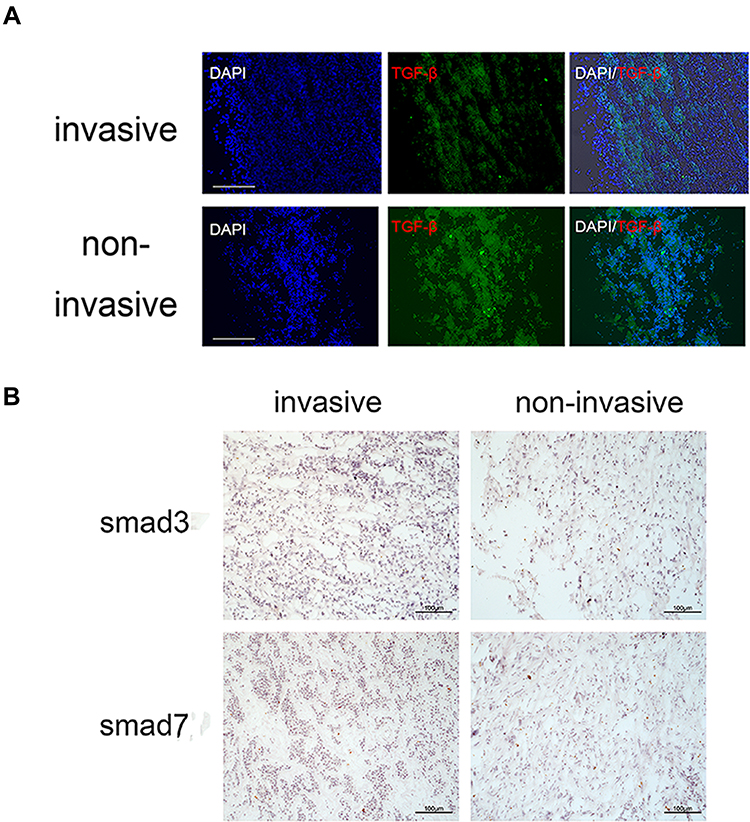 |
Figure 4 Immunohistochemical staining of TGF-β/Smad marker proteins in representative tissue specimens. (A) Immunofluorescent staining for TGF-β in pituitary adenoma tissue in each group (20×). (B) Immunohistochemical staining for Smad3 and Smad7 in pituitary adenoma tissue in each group observed with a Zeiss microscope (×20). |
An Analysis of TGF-β1/Smads and EMT-Related Markers in Exosomes
Compared with that in the noninvasive group, the expression of N-cad was increased in the invasive group at the RNA and protein levels (Figure 5)(Table S1). Compared with the noninvasive group, the expression of E-cad and Epcam was reduced significantly in the invasive group at the protein level (p<0.001 or<0.05)(Figure 5C). This was consistent with the results obtained by q-PCR analyses (Figure 5A and B). In serum exosomes, the expression trend of EMT-related markers was consistent with that in tissues. It was found that the epithelial marker Epcam and E-cad expressed low in invasive group and high in non-invasive group, whereas N-cad showed the opposite trend, which was significantly different between invasive and non-invasive groups. The TGF-β1 expression trend between the two groups, however, was not significantly different. According to this research, EMT is important for cell migration and invasion of pituitary adenomas, but TGF-β1/Smad pathway is barely involved in this process, and tissue trend is consistent with that of exosomes.
 |
Figure 5 Comparison of the expression of EMT-related markers and TGF-β/Smad at the RNA and protein levels in serum exosomes from invasive and noninvasive PAs. (A) Relative gene expression of EMT-related markers in exosomes showing higher expression of EMT markers in the invasive group (n=7) than in the noninvasive group (n=7). (B) No significant differences were seen in the relative gene expression of TGF-β/Smad markers between the two groups. (C) The expression of EMT-related markers and TGF-β/Smad markers at the protein level in serum exosomes from patients (n = 10 individuals, 20 patients). *P<0.05,***P<0.001. |
Invasive PA Patients Showed an EMT Tendency in Serum Exosomes
To better illustrate the EMT tendency in the individual patient, we calculated the N-cad/Epcam ratio and found that this ratio was significantly higher in the exosomes from the invasive group than in those in the noninvasive group (P<0.01) (Figure 6A and B), further proving the EMT tendency in the exosomes from the invasive PA patients. Furthermore, there were three patients with recurring PA in the invasive group, and we found that N-cad expression can be used to distinguish the recurrence and initial diagnosis groups (P<0.05) (Figure 6C). A logistic regression model was developed for markers associated with EMT (Figure 6D). In order to evaluate the diagnostic efficacy of EMT-related markers and models for invasive pituitary adenomas (Table S2).
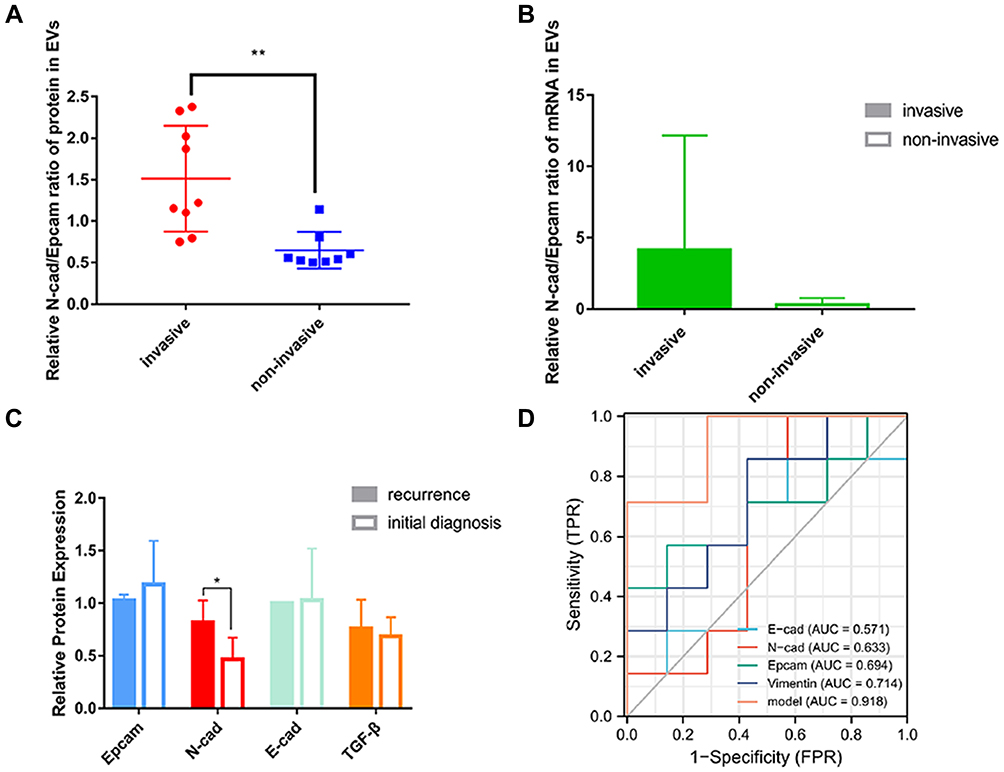 |
Figure 6 Invasive PA patients exhibited the epithelial−mesenchymal transition (EMT). (A) The N-cad/Epcam ratio of proteins in exosomes of noninvasive and invasive patients. (B) The N-cad/Epcam ratio of mRNA in exosomes of noninvasive and invasive patients. (C) Protein expression in exosomes in the recurrence (n=3) or initial diagnosis groups (n=7). (D) ROC curves of EMT-related markers for diagnosing invasive pituitary adenomas. **P<0.01. |
The TGF-β/Smad Signaling Pathway Negatively Regulates EMT-Related Protein Expression Levels in GH3 Cells
Based on our literature review, we found the TGF-β/Smad signaling pathway is closely linked to tumor invasion, and particularly TGF-β/Smad involved in epithelial-mesenchymal transformation of tumors. However, we found no significant differences between invasive and non-invasive pituitary adenomas in TGF-β/Smad signaling pathways in previous clinical sample experiments. Due to the large variations in clinical sample individualization and our small sample size, we decided to further investigate whether the TGF-β/Smad pathway mediates EMT in invasive pituitary adenomas in pituitary adenoma cell lines.
The relative EMT ratio, (N-cad+Vimentin)/(E-cad+Epcam), is used to calculate changes in EMT, in order to better describe expression trend in EMT. In pituitary adenoma cells, the expression of EMT did not change significantly based on TGF-β1 stimulation, but inhibiting Smad3 by SIS3 enhanced its expression (Figure 7A). We found decreased expression of the epithelial markers Epcam and E-cadherin and increased expression of the mesenchymal markers N-cadherin and vimentin in the group treated with SIS3. This implies that Smad3 negatively regulated the EMT tendency in GH3 cells.
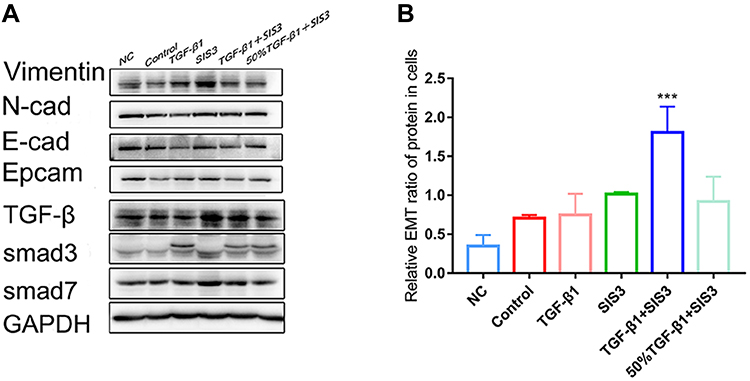 |
Figure 7 EMT-related marker and TGF-β/Smad expression in GH3 cells. (A) Representative Western blotting bands showing the protein expression of EMT-related factors and TGF-β/Smad signaling pathway. (B)The relative EMT ratio in cells of each group. The relative EMT ratio was calculated according to the equation in the Materials and Methods, P value <0.001. ***P<0.001. |
Since stimulation of GH3 cells with TGF-β1 alone failed to reduce EMT as expected, so we created two groups of 50% TGF-β1/SIS3 and TGF-β1/SIS3 to test the real effect of TGF-β1 on EMT. TGF-β1 levels were positively correlated with EMT rate when Smad3 was blocked and TGF-β1 was increased (Figure 7B, P < 0.001). Therefore, there may be other signaling pathways related to TGF-β1 that promote EMT in pituitary adenomas. It appears that TGF-β1/Smad3 signaling, rather than other TGF-β1-related pathways, inhibits epithelial-mesenchymal transformation in pituitary adenoma cells.
Discussion
The current traditional diagnosis of invasive pituitary adenomas is based on imaging and histopathology. Until tumors are invasive and detected by MRI or CT, there are currently no effective marker levels to evaluate tumor biological behavior. Pathological puncture has risks, especially for use in brain tumors, which cannot be repeatedly detected and tracked dynamically. Liquid biopsy has become an emerging method for the diagnosis of tumors and other diseases. Noninvasive blood monitoring can provide many pieces of molecular information to help diagnose, treat and monitor the prognosis of tumors.11 Numerous studies have shown that exosomes can be successfully used to diagnose cancers.12,13 However, there are currently few studies on exosomes that have been applied to pituitary adenoma diagnosis. In our study, we found that the expression of markers in serum exosomes was consistent with that in tumor tissues, suggesting that serum exosomes can be used as a noninvasive detection method for invasive pituitary adenomas in clinical applications.
The EMT is an important phenomenon in which epithelial cells acquire the properties of mesenchymal cells that possess a fibroblastoid morphology with increased motility and have the potential to cross through the basal membrane by losing adhesion and tight junctions to help them communicate with neighboring cells.14 The EMT is accompanied by changes in the expression of multiple markers. The most significant epithelial markers are downregulated, while mesenchymal markers are upregulated.15 The EMT is involved in multiple processes, such as wound healing, tissue fibrosis and cancer metastasis.16 Recently, its role has been extended to tumor progression, invasion and metastasis. Studies have shown that tumor cells with EMT characteristics are not sensitive to apoptotic and senescence signals and are accompanied by changes in the tumor cell microenvironment, which is one of the important mechanisms for the development of various tumors. In recent years, the EMT has been observed in studies of breast cancer, lung cancer, and pancreatic cancer. Studies have shown that the EMT plays an important role in the invasion and metastasis of hepatocellular carcinoma.17 In pituitary adenomas, the EMT may play an important role in the occurrence and development of pituitary adenomas.18–22 The results of our study indicated that mesenchymal markers (such as N-cadherin and vimentin) were overexpressed and that epithelial markers (such as E-cadherin and Epam) were weakly expressed in exosomes in invasive pituitary adenomas. The opposite trend was observed in the noninvasive group, and we also verified this trend in tissue samples. These results suggest that infiltration and migration of pituitary adenomas may be related to the EMT. Epithelial-mesenchymal markers can be used as biological indicators to judge whether pituitary adenomas invade. In addition, the results from exosomes and tissues were consistent, and we consider that exosomes can be used as noninvasive, and feasible diagnostic markers. To further investigate the underlying characteristics of the EMT, we also investigated the relationship between the TGF-β/Smad signaling pathway and the trend of EMT.
Previous reports have described TGF-β/Smad signaling pathway as a negative regulator of invasion in benign adenomas,23,24 such as pituitary adenomas.25 In our study, pathway-associated signaling proteins, such TGF-β and Smad3 expression at the protein and RNA levels, showed differences between the invasive and noninvasive groups. We next performed experiments in cells and found that although the TGF-β/Smad pathway inhibits EMT in GH3 cells, blocking this pathway can promote the EMT. Interestingly, after blocking the TGF-β/Smad signaling pathway, TGF-β stimulation increased the EMT ratio. Thus, we hypothesize that TGF-β may promote the EMT through a nonclassical pathway. Hence, we used one-half the concentration of TGF-β in the same situation and found that the EMT ratio was lower than before. This result further supported our conjecture. These results implied that the TGF-β/Smad signaling pathway can play a role in the negative regulation of invasion.
However, in exosomes, the TGF-β/Smad pathway showed no significant difference in patients with invasive and noninvasive pituitary adenomas. This may be because exosomes transmit EMT-related signals between pituitary adenoma cells, not through TGF signaling pathways, but through other signaling pathways.8 Another possible reason is that due to the small sample size in our study, the results were not reliable. Thus, the intrinsic molecular mechanism was not studied in depth. In subsequent experiments, a larger sample size and in-depth research into molecular mechanisms are required.
In summary, we observed a significant EMT tendency in invasive pituitary adenomas. Furthermore, we observed that the expression of EMT-related markers in serum exosomes was consistent with that in tumor tissues. The consistency of the EMT tendency in serum exosomes and tumor tissues suggests the potential of serum exosomes as an effective biomarker to evaluate the EMT tendency in pituitary adenoma and to diagnose invasive pituitary adenomas.
The limitation of this study is the small number of pituitary adenoma samples. The pituitary adenoma subtype was not homogeneous. Further studies with larger sample sizes and homogeneous patient groups are necessary to confirm these findings.
Abbreviations
EMT, Epithelial-Mesenchymal Transition; Epcam, epithelial cell adhesion molecule; PAs, pituitary adenomas; NFPAs, nonfunctional pituitary adenomas; FPAs, functional pituitary adenomas; IPA, invasive pituitary adenomas; TGF-β, transforming growth factor-β; qRT-PCR, quantitative reverse transcription PCR; SIS3, smad3 inhibitor; CTCs, circulating tumor cells; PBS, phosphate buffered saline; NTA, nanoparticle tracking analysis; DAB, diaminobenzidine; HRP, horseradish peroxidase; DAPI, 4ʹ,6-diamidino-2-phenylindole; TEM, transmission electron microscope.
Acknowledgments
The authors want to take this chance to thanks to Guanghui Zheng and Chenxi Zhang for giving many academic and precious suggestions in this study and helped with editing the paper. This abstract of this paper was presented at “The International Society for Extracellular Vesicles” Conference as a poster presentation with interim finding. The poster’s abstract was published in “Poster Abstracts” in Journal of Extracellular Vesicles, named “The TGF-β/smads signaling pathway and epithelial-mesenchymal transition in invasive pituitary adenomas by serum exosomes”
Disclosure
The authors declare no conflicts of interest.
References
1. McNeill KA. Epidemiology of brain tumors. Neurol Clin. 2016;34(4):981–998. doi:10.1016/j.ncl.2016.06.014
2. Jiang X, Zhang X. The molecular pathogenesis of pituitary adenomas: an update. Endocrinol Metab. 2013;28(4):245–254. doi:10.3803/EnM.2013.28.4.245
3. Raverot G, Burman P, McCormack A, et al. European society of endocrinology clinical practice guidelines for the management of aggressive pituitary tumours and carcinomas. Eur J Endocrinol. 2018;178(1):G1–1G24. doi:10.1530/EJE-17-0796
4. Theodros D, Patel M, Ruzevick J, Lim M, Bettegowda C. Pituitary adenomas: historical perspective, surgical management and future directions. CNS Oncol. 2015;4(6):411–429. doi:10.2217/cns.15.21
5. Lopes M. The 2017 World Health Organization classification of tumors of the pituitary gland: a summary. Acta Neuropathol. 2017;134(4):521–535. doi:10.1007/s00401-017-1769-8
6. Vautrot V, Chanteloup G, Elmallah M, et al. Exosomal miRNA: small molecules, big impact in colorectal cancer. J Oncol. 2019;2019:8585276. doi:10.1155/2019/8585276
7. Kang X, Zuo Z, Hong W, Tang H, Geng W. Progress of research on exosomes in the protection against ischemic brain injury. Front Neurosci. 2019;13:1149. doi:10.3389/fnins.2019.01149
8. Lamouille S, Xu J, Derynck R. Molecular mechanisms of epithelial-mesenchymal transition. Nat Rev Mol Cell Biol. 2014;15(3):178–196. doi:10.1038/nrm3758
9. Yilmaz M, Christofori G. EMT, the cytoskeleton, and cancer cell invasion. Cancer Metastasis Rev. 2009;28(1–2):15–33. doi:10.1007/s10555-008-9169-0
10. Wang H, Chen K, Yang Z, et al. Diagnosis of invasive nonfunctional pituitary adenomas by serum extracellular vesicles. Anal Chem. 2019;91(15):9580–9589. doi:10.1021/acs.analchem.9b00914
11. Nilsson J, Skog J, Nordstrand A, et al. Prostate cancer-derived urine exosomes: a novel approach to biomarkers for prostate cancer. Br J Cancer. 2009;100(10):1603–1607. doi:10.1038/sj.bjc.6605058
12. Matsumura T, Sugimachi K, Iinuma H, et al. Exosomal microRNA in serum is a novel biomarker of recurrence in human colorectal cancer. Br J Cancer. 2015;113(2):275–281. doi:10.1038/bjc.2015.201
13. Khalyfa A, Gozal D. Exosomal miRNAs as potential biomarkers of cardiovascular risk in children. J Transl Med. 2014;12(1):162. doi:10.1186/1479-5876-12-162
14. Das V, Bhattacharya S, Chikkaputtaiah C, Hazra S, Pal M. The basics of epithelial–mesenchymal transition (EMT): a study from a structure, dynamics, and functional perspective. J Cell Physiol. 2019;234(9):14535–14555. doi:10.1002/jcp.28160
15. De Craene B, Berx G. Regulatory networks defining EMT during cancer initiation and progression. Nat Rev Cancer. 2013;13(2):97–110. doi:10.1038/nrc3447
16. Yoshida S, Kato T, Kato Y. EMT involved in migration of stem/progenitor cells for pituitary development and regeneration. J Clin Med. 2016;5(4):4. doi:10.3390/jcm5040043
17. Li YM, Han KQ, Zheng L, et al. [Expression and roles of the epithelial mesenchymal transition markers E-cadherin and vimentin in hepatocellular carcinoma]. Zhonghua Gan Zang Bing Za Zhi. 2013;21(4):279–284. Chinese. doi:10.3760/cma.j.issn.1007-3418.2013.04.010
18. Wang J, Zhang Z, Li R, et al. ADAM12 induces EMT and promotes cell migration, invasion and proliferation in pituitary adenomas via EGFR/ERK signaling pathway. Biomed Pharmacother. 2018;97:1066–1077. doi:10.1016/j.biopha.2017.11.034
19. Li B, Cheng J, Wang H, et al. CCNB1 affects cavernous sinus invasion in pituitary adenomas through the epithelial-mesenchymal transition. J Transl Med. 2019;17(1):336. doi:10.1186/s12967-019-2088-8
20. Fang Y, Liang X, Jiang W, Li J, Xu J, Cai X. Cyclin b1 suppresses colorectal cancer invasion and metastasis by regulating e-cadherin. PLoS One. 2015;10(5):e0126875. doi:10.1371/journal.pone.0126875
21. Jia W, Zhu J, Martin TA, Jiang A, Sanders AJ, Jiang WG. Epithelial-mesenchymal Transition (EMT) markers in human pituitary adenomas indicate a clinical course. Anticancer Res. 2015;35(5):2635–2643.
22. Yang Q, Li X. Molecular network basis of invasive pituitary adenoma: a review. Front Endocrinol. 2019;10:7. doi:10.3389/fendo.2019.00007
23. David CJ, Massagué J. Contextual determinants of TGFβ action in development, immunity and cancer. Nat Rev Mol Cell Biol. 2018;19(7):419–435. doi:10.1038/s41580-018-0007-0
24. David CJ, Huang YH, Chen M, et al. TGF-β tumor suppression through a lethal EMT. Cell. 2016;164(5):1015–1030. doi:10.1016/j.cell.2016.01.009
25. Liu C, Li Z, Wu D, Li C, Zhang Y. Smad3 and phospho-Smad3 are potential markers of invasive nonfunctioning pituitary adenomas. Onco Targets Ther. 2016;9:2265–2271. doi:10.2147/OTT.S99699
 © 2021 The Author(s). This work is published and licensed by Dove Medical Press Limited. The
full terms of this license are available at https://www.dovepress.com/terms
and incorporate the Creative Commons Attribution
- Non Commercial (unported, 3.0) License.
By accessing the work you hereby accept the Terms. Non-commercial uses of the work are permitted
without any further permission from Dove Medical Press Limited, provided the work is properly
attributed. For permission for commercial use of this work, please see paragraphs 4.2 and 5 of our Terms.
© 2021 The Author(s). This work is published and licensed by Dove Medical Press Limited. The
full terms of this license are available at https://www.dovepress.com/terms
and incorporate the Creative Commons Attribution
- Non Commercial (unported, 3.0) License.
By accessing the work you hereby accept the Terms. Non-commercial uses of the work are permitted
without any further permission from Dove Medical Press Limited, provided the work is properly
attributed. For permission for commercial use of this work, please see paragraphs 4.2 and 5 of our Terms.