Back to Journals » Diabetes, Metabolic Syndrome and Obesity » Volume 18
Elevated Triglyceride-Glucose Index as a Risk Stratification Marker for Diabetic Retinopathy in Type 2 Diabetes Mellitus: The Influence of Glycemic Control
Authors Wan X ![]() , Zhang R, Abudukeranmu A
, Zhang R, Abudukeranmu A ![]() , Wei W, Zhu H, Zhang L, Hu Y
, Wei W, Zhu H, Zhang L, Hu Y
Received 10 November 2024
Accepted for publication 22 February 2025
Published 11 March 2025 Volume 2025:18 Pages 743—759
DOI https://doi.org/10.2147/DMSO.S503672
Checked for plagiarism Yes
Review by Single anonymous peer review
Peer reviewer comments 2
Editor who approved publication: Dr Rebecca Baqiyyah Conway
Xiaohua Wan,1– 3 Ruihuan Zhang,4 Adilan Abudukeranmu,5 Wei Wei,6 Hong Zhu,5 Lin Zhang,6– 8 Yanwei Hu1,2
1Department of Clinical Laboratory, Beijing Chao-Yang Hospital, Capital Medical University, Beijing, People’s Republic of China; 2Beijing Center for Clinical Laboratories, Beijing, People’s Republic of China; 3Department of Clinical Laboratory, Beijing Tongren Hospital, Capital Medical University, Beijing, People’s Republic of China; 4The Inner Mongolia Medical Intelligent Diagnostics Big Data Research Institute, Hohhot, Inner Mongolia, People’s Republic of China; 5Department of Epidemiology and Biostatistics, School of Public Health/Tianjin Key Laboratory of Environment, Nutrition and Public Health/Center for International Collaborative Research on Environment, Nutrition and Public Health, Tianjin Medical University, Tianjin, People’s Republic of China; 6Department of Medical Record, Beijing Tongren Hospital, Capital Medical University, Beijing, People’s Republic of China; 7Department of Endocrinology, Beijing Tongren Hospital, Capital Medical University, Beijing, People’s Republic of China; 8Beijing Diabetes Research Institute, Beijing, People’s Republic of China
Correspondence: Yanwei Hu, Department of Clinical Laboratory, Beijing Chao-Yang Hospital, Capital Medical University, Beijing Center for Clinical Laboratories, GongTiNanLu 8#, Chaoyang District, Beijing, 100020, People’s Republic of China, Tel +86-10-85231575, Email [email protected] Lin Zhang, Department of Medical Record, Beijing Tongren Hospital, Capital Medical University. Department of Endocrinology, Beijing Tongren Hospital, Capital Medical University, Beijing Diabetes Research Institute, No. 1, Dongjiaomin Lane, Dongcheng District, Beijing, 100730, People’s Republic of China, Tel +86-10-58533988, Email [email protected]
Background: Diabetic retinopathy (DR) is a common microvascular complication observed in people with type 2 diabetes mellitus (T2DM). The triglyceride-glucose (TyG) index, an indicator of insulin resistance, has an uncertain role in glycemic management in T2DM patients at risk for DR. This study aimed to evaluate the association between the TyG index and DR risk across different glycemic control status.
Methods: A total of 4,372 T2DM in-patients from Beijing Tongren Hospital (2013– 2024) were included in this study. The patients were categorized into four groups based on TyG index quartiles (Q1-Q4). Participants were stratified by TyG index quartiles (Q1-Q4) and glycemic control status (HbA1c < 7%, 7– 9%, and > 9%). Restricted cubic spline (RCS) analysis, logistic regression, and subgroup analyses were employed to explore the associations among the TyG index, glycemic control and DR risk.
Results: Overall, there were positive association of the TyG index and DR risk. The highest TyG Q4 was significantly associated with an increased risk of DR (odds ratio [OR]: 1.289; 95% confidence interval [CI]: 1.008– 1.648, P< 0.05), compared with the lowest TyG Q1. Significant interaction was observed between the TyG index and glycemic control (P for interaction < 0.05). Notably, the association was strongest in patients with HbA1c > 9%.
Conclusion: The relationship between high TyG index and DR risk was more pronounced in patients with HbA1c > 9% group, indicating that TyG index may serve as a useful tool for making risk stratification on glycemic control in T2DM patients.
Keywords: diabetes retinopathy, triglyceride-glucose index, glycemic control, glycated hemoglobin A1c, insulin resistance, diabetes mellitus
Introduction
Diabetic retinopathy (DR) is a microvascular complication of diabetes mellitus (DM) and represents a primary cause of acquired blindness among working-age individuals.1 According to the International Diabetes Federation (IDF), the global population with DM was estimated at 463 million in 2019, with a projected increase to 700 million by 2045. The number of individuals affected by DR is expected to rise by 55.6% (57.4 million) between 2020 and 2045, primarily due to the rapidly increasing global prevalence of DM.1,2 The prevalence of DR in type 2 diabetes mellitus (T2DM) patients is approximately 34.6%, with 12% of cases involving vision-threatening DR, making it a major public health issue.3,4 For T2DM patients, ocular examination very necessary, and early detection and diagnosis of DR are vital for prompt intervention and the prevention of vision loss. The screening of diabetes and its complications is incomplete without a dilated fundoscopy (including peripheral fundus).3–5 However, due to the asymptomatic nature of DR in its early stages, lack of awareness among patients, and limited primary healthcare resources, especially in underdeveloped regions, early detection remains challenging. Therefore, it is clinically important to identify simple and reliable biomarkers to monitor the presence of DR for enabling timely interventions.5,6
Insulin resistance (IR), characterized by a reduced cellular sensitivity to insulin, plays a crucial role in the development of T2DM and its related vascular complications. The pathogenesis of DR is complex, involving multiple mechanisms and contributing factors, including persistent hyperglycemia, hypertension, dysregulated lipid metabolism, inflammation, and IR.7,8 Currently, the hyperinsulinemic normoglycemic clamp (HIEC) is regarded as the gold standard for evaluating insulin resistance.9 However, its complexity and high cost limit its widespread use in routine clinical practice. Alternatively, Homeostatic model assessment of insulin resistance (HOMA-IR) is commonly used to assess insulin resistance.10 HOMA-IR may cause considerable bias due to insulin measurements and lacks robust validation in T2DM patients with insulin therapy. Furthermore, these measurement methods are constrained by significant biological variability in insulin levels (intra and inter-subject variability), as well as challenges in obtaining fasting insulin measurements and the lack of standardized quantification techniques. Additionally, these methods are invasive, costly, and complex, making them unsuitable for clinical and epidemiological studies. As a result, there is a growing need for non-invasive, insulin-free surrogates to assess IR.5
Interestingly, growing evidence suggests that the triglyceride-glucose (TyG) index, calculated from triglyceride (TG) and fasting blood glucose (FBG) levels, shows a strong correlation with both the HIEC and HOMA-IR. The TyG index has recently been proposed as a simple and reliable indicator for assessing IR. Several studies have demonstrated that the TyG index plays a predictive role in identifying patients with T2DM at higher risk of prevalence and prognosis of DR,5,11–13 whereas another study did not find such as association.14 Emerging machine learning approaches, as highlighted by Montaser et al15 showed promise in predicting incident DR in Type 1 diabetes mellitus (T1DM) patients using glycemic features. Semeraro et al16 also demonstrated predictive models for DR in T2DM patients, underscoring the importance of integrating novel biomarkers with existing approaches. Despite these advancements, the role of surrogate markers like the TyG index in DR prediction across diverse diabetes populations remains underexplored.
Glycated hemoglobin A1c (HbA1c) is widely recognized as a dependable marker for evaluating long-term glycemic control, and has consistently been shown to be associated with the progression of both microvascular and macrovascular complications in DM.17,18 To our knowledge, the role of the TyG index in DR risk and its relationship with glycemic control in T2DM patients remains unclear. Therefore, this study aimed to investigate the association between the TyG index, glycemic control status, and DR risk in T2DM patients.
Subjects and Methods
Research Design and Study Patients
The clinical data from 4,372 in-patients diagnosed with T2DM were collected from the Department of Endocrinology at Beijing Tongren Hospital between December 2013 and July 2024. For patients with multiple hospitalizations, only data from their initial admission were included. This study was conducted in accordance with the Declaration of Helsinki and approved by the Ethics Committee of Beijing Tongren Hospital, Capital Medical University (approval number TREC2024-KY040). Written informed consent was obtained from all the participants.
The inclusion criteria consisted of patients with a discharge diagnosis of T2DM and patients aged 18 years or older. T2DM diagnosed according to 1999 World Health Organization (WHO) criteria and Chinese Diabetes Association criteria: (1) FPG≥7.0 mmol/L; or (2) oral glucose tolerance test (OGTT): 2 h plasma glucose (PG) ≥11.1 mmol/L, or (3) Random plasma glucose (RPG) ≥11.1 mmol/L for a patient with classic symptoms of hyperglycemia or hyperglycemic crisis; or (4) HbA1c ≥6.5%.19,20 Data from the patients’ initial hospital admission were collected, including detailed clinical characteristics, routine laboratory tests and DR status.
Participants were excluded from the study based on the following criteria: (1) diagnosis of non-type 2 diabetes mellitus; (2) presence of other eye diseases or a history of eye surgery, including glaucoma, severe cataracts, or significant corneal opacity; (3) recent episodes (within the last 3 months) of diabetic ketoacidosis, hyperglycemic hyperosmolar state, or severe and recurrent hypoglycemic events; (4) pregnancy or breastfeeding; (5) comorbid psychiatric disorders, cancer, severe cardiovascular disease, severe renal dysfunction or hepatic diseases, autoimmune disease, acute or chronic infection; (6) patients with incomplete information.12,21,22
Information Collection and Clinical Definitions
The data were extracted directly from electronic medical records and included various variables such as clinical characteristics, routine laboratory tests, and DR status. The clinical characteristics consisted of gender, age, T2DM duration, body mass index (BMI), systolic blood pressure (SBP), and diastolic blood pressure (DBP). Routine laboratory tests included the following 11 items: FBG, blood urea nitrogen (BUN), creatinine (Cr), albumin (ALB), hypersensitivity C-reactive protein (hsCRP), lipoprotein a (LP(a)), triglycerides (TG), total cholesterol (TC), high-density lipoprotein cholesterol (HDL-C), low-density lipoprotein cholesterol (LDL-C) and HbA1c.
In addition, fundus examination results of DR were collected for all patients. The diagnostic criteria for DR followed the International Clinical Diabetic Retinopathy Severity Scale:23 (1) no diabetic retinopathic changes (NDR); (2) mild non-proliferative diabetic retinopathy (NPDR); (3) moderate NPDR; (4) severe NPDR; and (5) proliferative diabetic retinopathy (PDR). Diagnosis was based on macula-centered 45° fundus photography and indirect ophthalmoscopy after pupil dilation. A double-blind assessment was conducted by two experienced ophthalmologists from Beijing Tongren Hospital, with a third ophthalmologist consulted in case of disagreement. DR was diagnosed in individuals exhibiting any of the following lesions on fundus images: (1) microaneurysms; (2) hemorrhages; (3) hard exudates; (4) cotton wool spots; (5) retinal vein beading; (6) microvascular abnormalities in the retina; and/or (7) neovascularization.20,23,24 In this study, patients presenting these DR-related lesions were classified into the DR group, while those without such lesions were assigned to the Non-DR group.
BMI was calculated by dividing weight in kilograms by height in meters squared (kg/m²).11 The TyG index was calculated using the following formula: TyG = Ln [fasting triglycerides (TG) (mg/dL) × fasting blood glucose (FBG) (mg/dL)/2].25 Additionally, TyG index was categorized into quartiles: TyG Q1 (TyG<8.67), TyG Q2 (8.67≤TyG<9.13), TyG Q3 (9.13≤TyG<9.63), TyG Q4 (TyG≥9.63). According to the latest American Diabetes Association guideline,26 patients were categorized by glycemic control status: controlled glycemia (HbA1c <7%) and uncontrolled glycemia (HbA1c ≥7%). The latter group was further stratified into HbA1c 7–9% and >9% subgroups for more detailed analysis.
Statistical Analysis
All data were analyzed using IBM SPSS Statistics version 27.0 (Chicago, IL, USA) and R language 4.1.3 software. Continuous variables that followed a normal distribution are presented as mean ± standard deviation (mean±SD), while non-normally distributed data are expressed as median (interquartile range [IQR]). The Kolmogorov–Smirnov test was used to assess the distribution pattern of the data. Differences in the characteristics between groups were analyzed using the Student’s t-test, Mann–Whitney U-test, Kruskal–Wallis H-test, Chi-square test, or Fisher’s exact test, as appropriate. Pearson or Spearman correlation analyses were conducted to evaluate the relationship between the TyG index and other parameters. DR proportion trends across multiple groups were analyzed by Cochran-Armitage trend test.
Both univariable and multivariable logistic regression analyses were employed to calculate the odds ratio (OR) and 95% confidence interval (CI). The restricted cubic spline (RCS) analysis was applied to explore potential nonlinear correlations between the TyG index and DR risk. A hierarchical logistic regression model was used to perform an exploratory analysis across different subgroups, determining whether interactions occurred. The relationship between the TyG index and DR risk was examined, with stratification by gender and age. Subsequently, the association among glycemic control status, TyG index quartiles, and DR risk was assessed to explore the potential influence of the TyG index on this relationship. All statistical tests were two-sided, with a P<0.05 considered statistically significant.21,22
Results
The Characteristics of the Included T2DM Patients Stratified by DR Status and Glycemic Control
A total of 4,372 patients with T2DM were included in the study, consisting of 2,506 men and 1,866 women, with a mean age of 57.10±12.04 years. Among these patients, 47.26% (2,066/4,372) were diagnosed with DR, which included 1,161 men and 905 women. Patients were stratified based on DR status and glycemic control levels, with the corresponding clinical characteristics detailed in Table 1. The results demonstrated that in the DR group, age, T2DM duration, SBP, DBP, FBG, BUN, Cr, LP(a), TC, HDL-C, LDL-C, HbA1c and TyG index levels all increased. In contrast, ALB and hsCRP levels were significantly lower in the DR group (P <0.05). No significant differences in TG levels were observed between the DR and Non-DR groups (P >0.05).
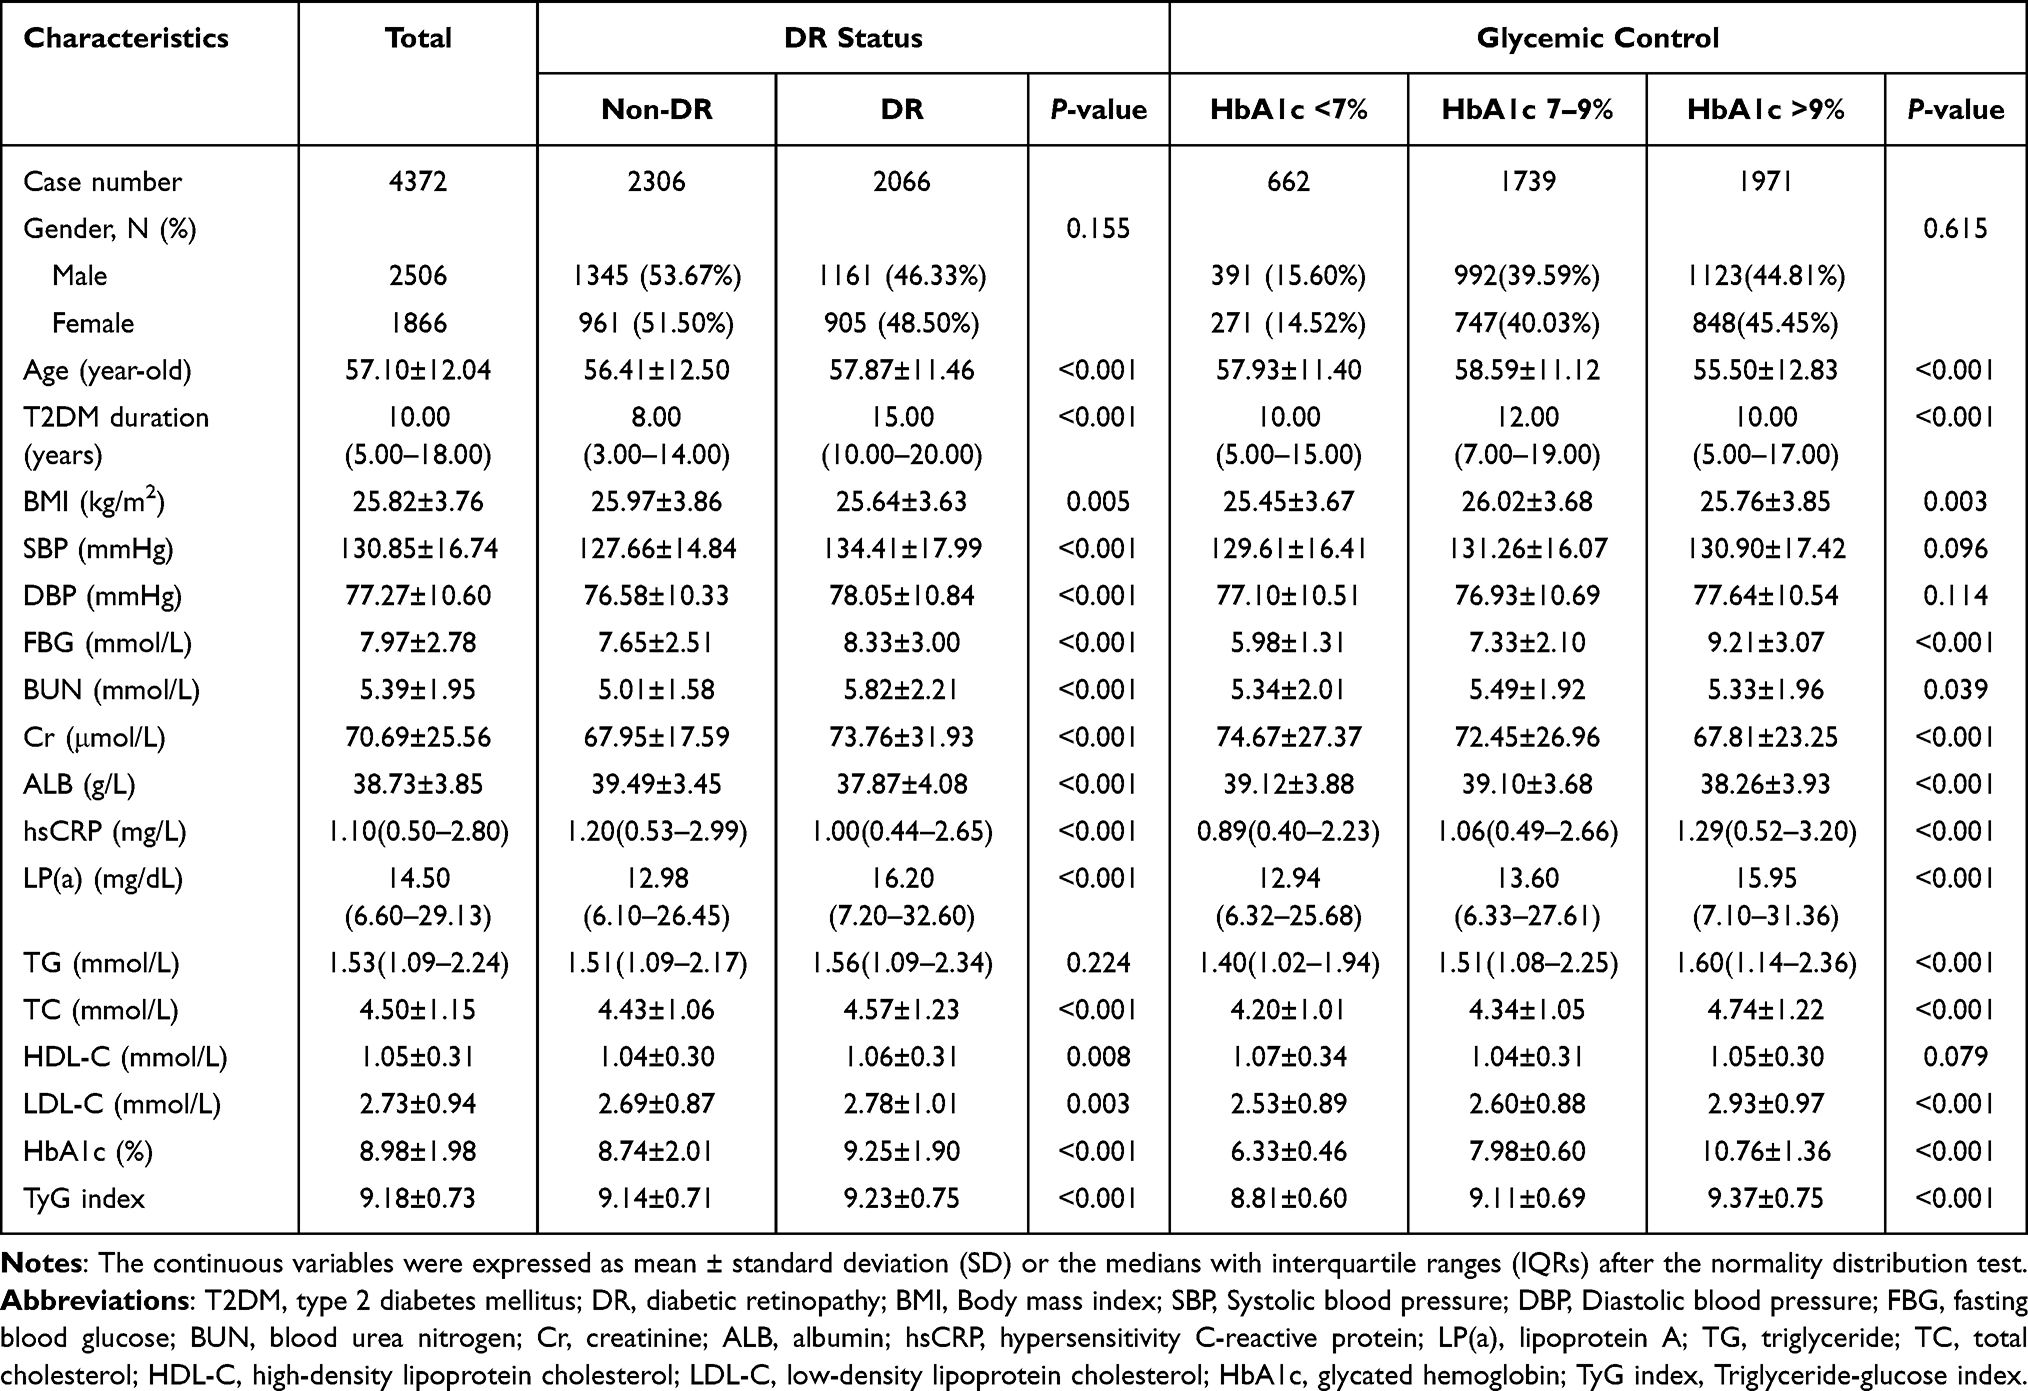 |
Table 1 Characteristics of the Included T2DM Patients Stratified by Diabetic Retinopathy Status and Glycemic Control Level |
Based on glycemic control status, the study cohort comprised 662 cases with HbA1c <7% and 3,710 cases with HbA1c ≥7%. The characteristics of included T2DM patients stratified by HbA1c <7% and HbA1c ≥7% groups were showed in Table S1. Patients with HbA1c ≥7% exhibited a longer T2DM duration, as well as higher levels of HbA1c, TyG index, BMI, SBP, FBG, hsCRP, LP(a), TG, TC and LDL-C levels. Meanwhile, ALB and HDL-C levels were significantly lower in the HbA1c ≥7% group (P <0.05) (Table S1). No significant differences were found in age, DBP and BUN levels between the HbA1c <7% and HbA1c ≥7% groups (P >0.05).
Furthermore, in the HbA1c ≥7% group, there were 1,739 cases with HbA1c 7–9% and 1,971 cases with HbA1c >9%. The comparison of clinical characteristics among the three groups stratified by HbA1c levels (HbA1c <7%, HbA1c 7–9%, and HbA1c >9%) was also presented in Table 1. There were significant differences in terms of age, T2DM duration, BMI, FBG, BUN, Cr, ALB, hsCRP, LP(a), TG, TC, LDL-C, HbA1c and TyG index among the three HbA1c levels.
Based on TyG index quartiles, all participants were categorized into four groups: TyG Q1 (TyG<8.67), TyG Q2 (8.67≤TyG<9.13), TyG Q3 (9.13≤TyG<9.63), TyG Q4 (TyG≥9.63). The characteristics of included T2DM patients stratified by TyG index quartiles were presented in Table 2. The results indicated that patients in the highest TyG quartile (TyG Q4) tended to be younger and consistently had higher levels of BMI, FBG, TG, TC, LDL-C and HbA1c (P <0.05). Additionally, TyG Q4 patients had lower HDL-C levels compared to those in TyG Q1, TyG Q2, and TyG Q3 (all P <0.05) (Table 2).
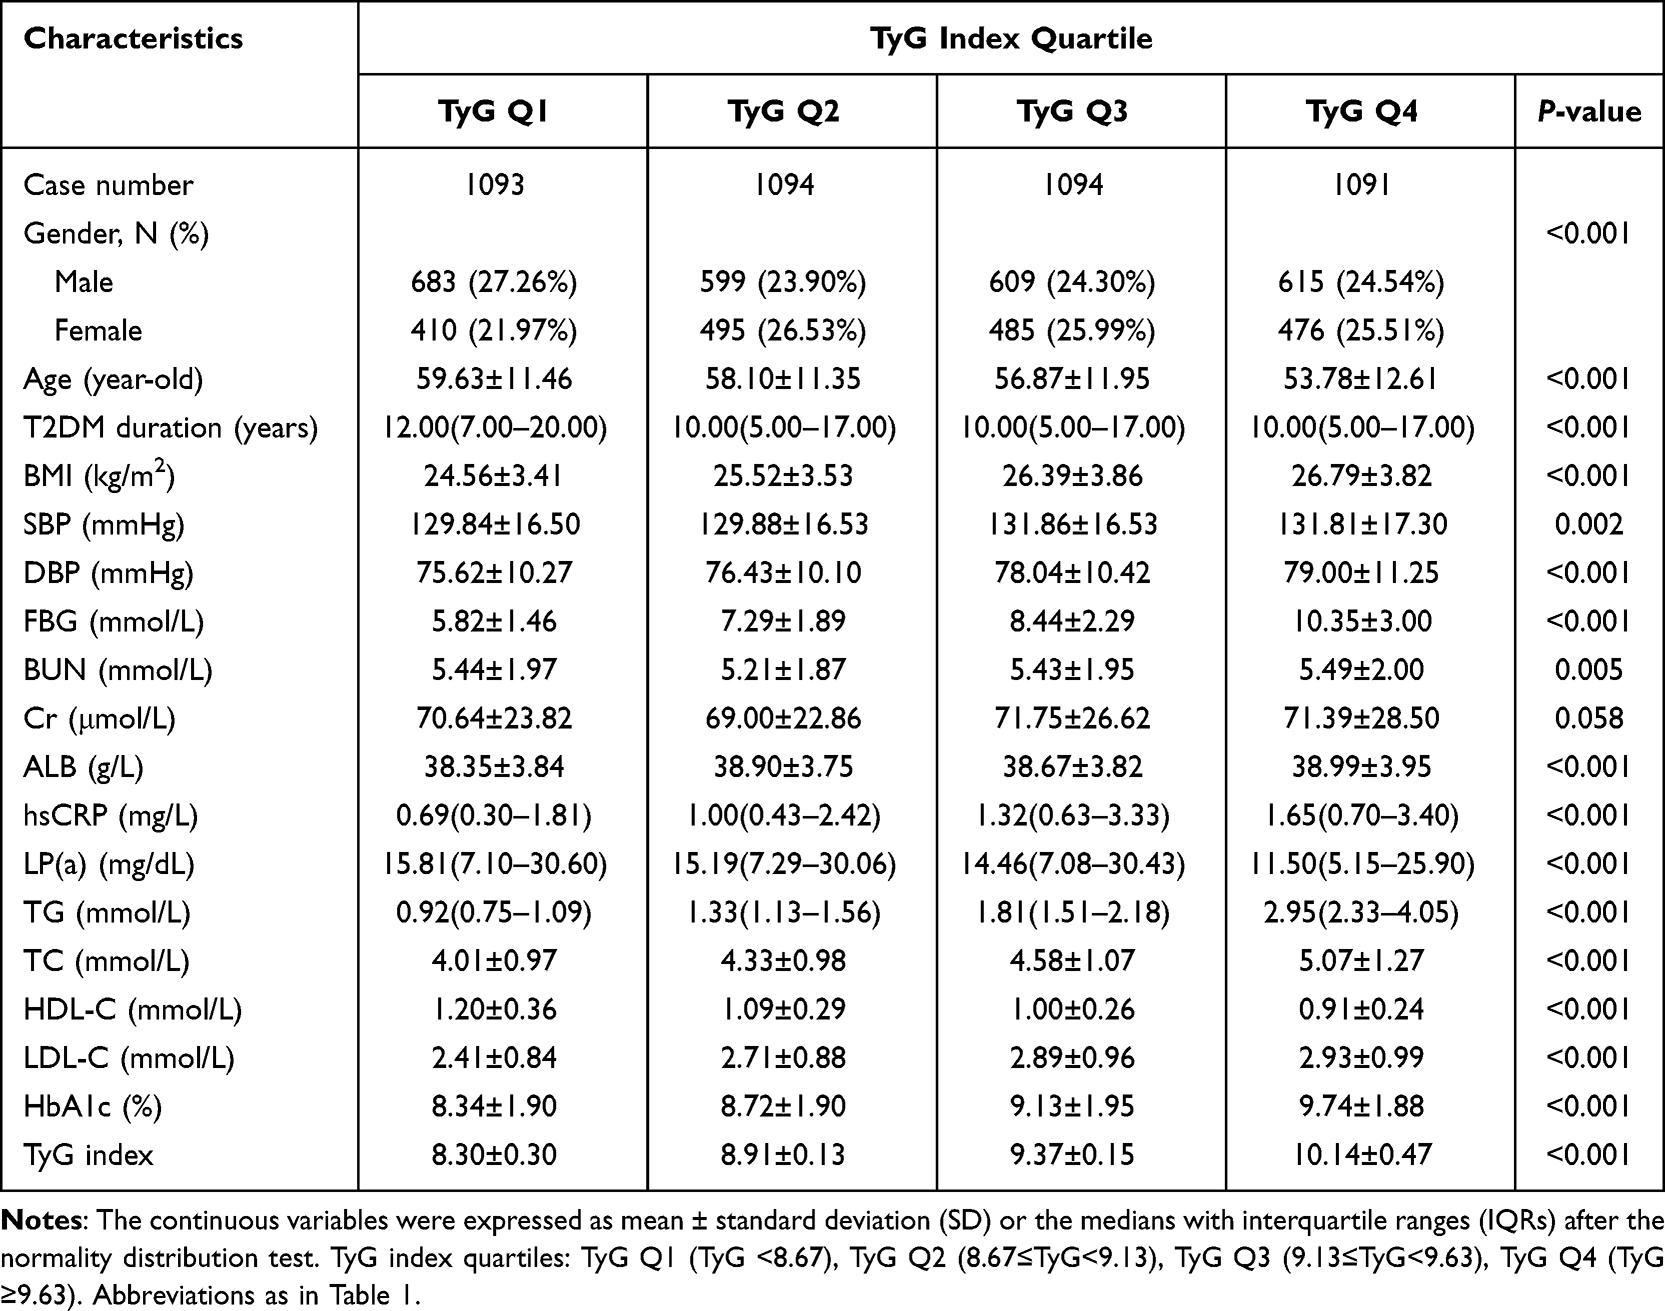 |
Table 2 Characteristics of Included T2DM Patients Stratified by TyG Index Quartiles |
Correlation Between the TyG Index and Other Clinical Parameters
As shown in Figure 1, Pearson or Spearman correlation analyses were used to evaluate the relationship between the TyG index and other clinical parameters in T2DM patients. The results showed that continuous TyG index was positively correlated with TG, FBG, TC, HbA1c, BMI, hsCRP, LDL-C, DBP, ALB, SBP (P <0.05). Conversely, it was negatively correlated with LP(a), age and HDL-C (P <0.05). No significant correlations were observed between the TyG index and BUN or Cr (P >0.05).
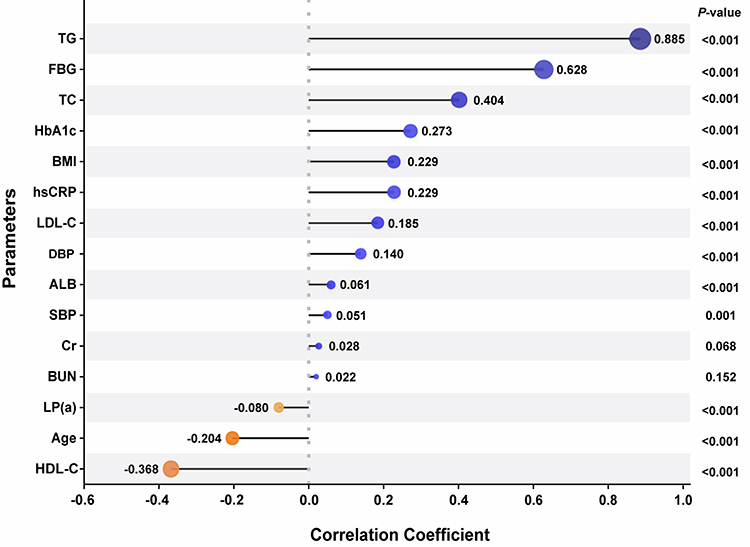 |
Figure 1 Correlation between the TyG index and other clinical parameters. Abbreviations as in Table 1. |
Association Between the TyG Index and DR Risk
The association between the TyG index and DR risk was assessed using logistic regression models and RCS analyses. As presented in Table 3, in the unadjusted (crude) model, the TyG index (as continuous variable) (OR 1.189, 95% CI 1.096–1.290, P <0.001) and TyG Q4 (OR 1.346, 95% CI 1.138–1.593, P =0.001) were identified as significant risk factors for DR. In model 1, after adjusting for gender and age, the ORs were 1.242 (95% CI 1.142–1.350, P <0.001) for the TyG index (as continuous variable) and 1.448 (95% CI 1.219–1.720, P <0.001) for TyG Q4, respectively.
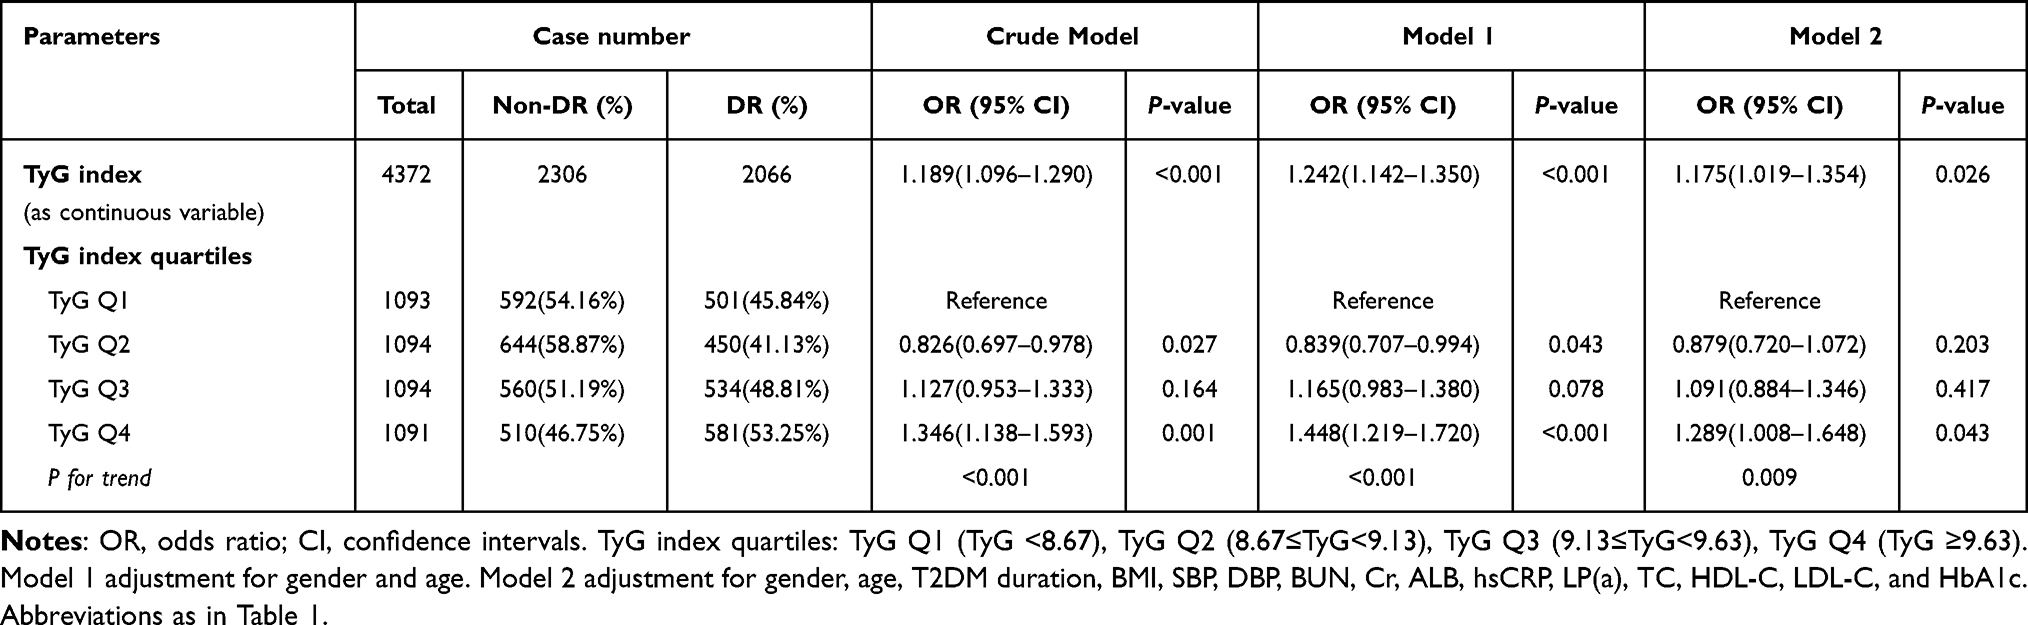 |
Table 3 The Logistic Regression Analysis for the Relationship Between TyG Index and Risk of Diabetic Retinopathy in Different Models |
Model 2 incorporated the following potential confounding variables: gender, age, T2DM duration, BMI, SBP, DBP, BUN, Cr, ALB, hsCRP, LP(a), TC, HDL-C, LDL-C, and HbA1c. After adjusting for all confounding variables in model 2, the ORs of TyG index (as continuous variable) for DR were 1.175 (95% CI: 1.019–1.354, P =0.026). As shown in Table 3, there was a strong association between higher TyG index levels and an elevated risk of DR (P for trend =0.009) in the model 2. Those in TyG Q4 level had 1.289 (95% CI: 1.008–1.648, P =0.043) times risk of DR relative to those in TyG Q1 level.
The RCS analyses with four knots demonstrated a significant association between the TyG index and DR risk (Figure 2). The relationship between the TyG index and DR risk adjusts for gender, age, T2DM duration, BMI, SBP, DBP, BUN, Cr, ALB, hsCRP, LP(a), TC, HDL-C, LDL-C, and HbA1c was showed Figure 2B. In the crude model (Figure 2A), a significant nonlinear relationship was observed between the TyG index and DR risk (P-nonlinear <0.001). The fully adjusted model (Figure 2B) revealed a persistent upward trend (P-overall <0.001), although the relationship no longer demonstrated nonlinear characteristics (P-nonlinear =0.233). As depicted in Figure 2B, a significant positive correlation was observed between higher TyG index levels and increased DR risk beyond the threshold value of 8.61 (P-overall <0.001). The findings suggest a complex relationship between the TyG index and DR risk, characterized by a marked acceleration in risk beyond the TyG index value of 8.61.
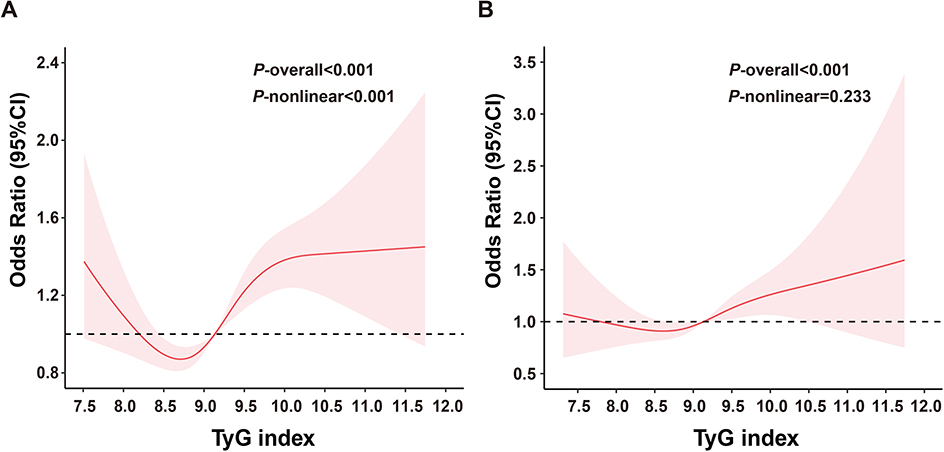 |
Figure 2 The relationship between the TyG index and the risk of diabetic retinopathy using restricted cubic spline (RCS). The odds ratios for DR (solid line) and 95% confidence intervals (shaded portion) are presented. (A) The nonlinear relationship between the TyG index and risk of DR in the crude model. (B) The relationship between the TyG index and DR adjusts for gender, age, T2DM duration, BMI, SBP, DBP, BUN, Cr, ALB, hsCRP, LP(a), TC, HDL-C, LDL-C, and HbA1c. Notes: P-overall<0.05 indicates a significant association between the TyG index and DR. The P-nonlinear <0.05 in the crude model (Figure 2A) suggests a nonlinear relationship between the TyG index and DR is significant. Abbreviations as in Table 1. |
As showed in Table S2, multivariable analyses were also conducted to evaluate the association between the TyG index and the risk of DR, both with and without adjustment for T2DM duration as a confounding variable. In the multivariable analysis without adjustment for T2DM duration (model B), the TyG index (as a continuous variable) was significantly associated with an increased risk of DR (OR:1.269, 95% CI: 1.109–1.451, P =0.001). A strong relationship was observed between higher TyG index levels and an elevated risk of DR (P for trend < 0.001). Specifically, participants in the TyG Q4 group had a 1.449-fold risk of DR (95% CI: 1.149–1.827, P =0.002) compared to those in the TyG Q1 group.
Subgroups Analysis of the Correlation Between the TyG Index and DR Risk
To further examine the effect heterogeneity of the TyG index on the risk of DR, subgroups analysis was conducted based on gender, age, BMI, SBP, DBP, HbA1c, LP(a), TC, HDL-C, LDL-C, respectively (Figure 3). The results indicated no significant differences in the TyG index across most subgroups of DR participants. However, significant interactions were found for gender (P for interaction =0.009), age (P for interaction =0.018), and HbA1c (P for interaction =0.031). The association of TyG index with DR risk was more significant among female, elders (≥59 years of age) and those with uncontrolled glycemia (HbA1c ≥7) compared to their counterparts.
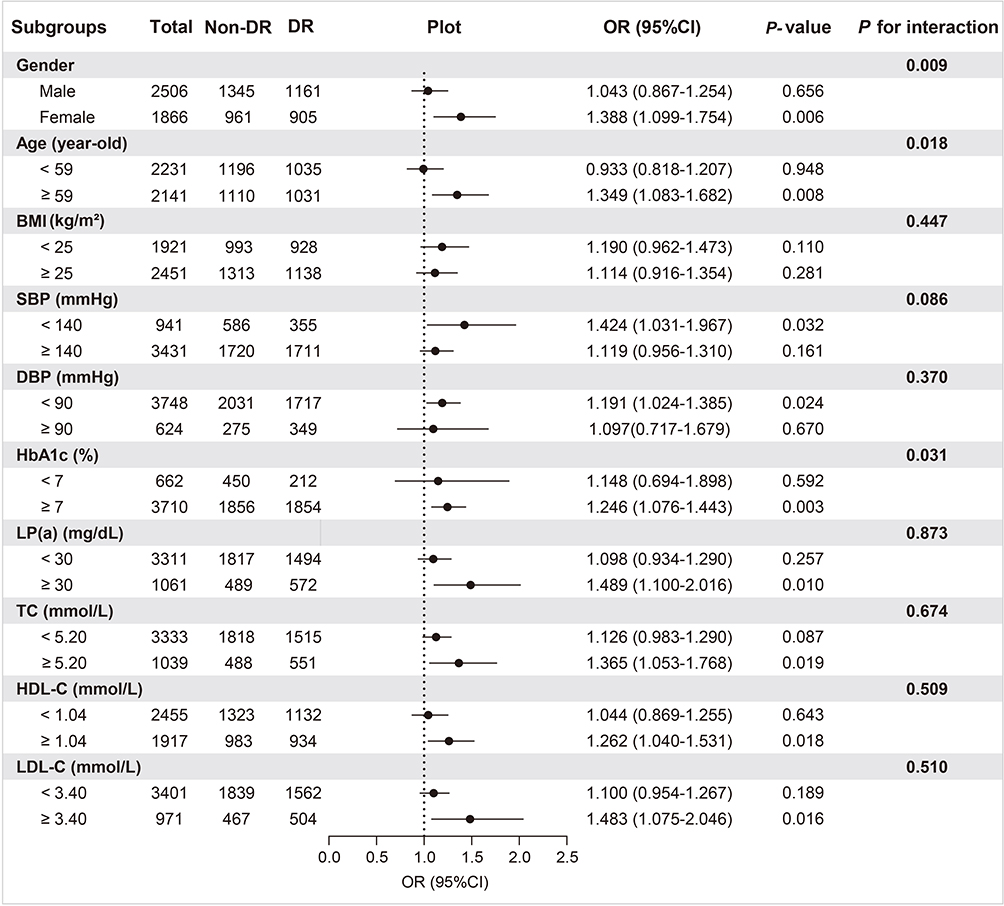 |
Figure 3 Subgroups analysis of the association between the TyG index and diabetic retinopathy. Abbreviations as in Table 1. |
The Relationship Between the TyG Index and DR Risk Stratified by Gender and Age
The relationship between the TyG index and DR risk, stratified by gender, is presented in Table 4. For the female group, utilizing TyG Q1 as the reference, the OR for DR risk in TyG Q4 was 1.652 (95% CI: 1.109–2.460, P =0.013), indicating a significant ascending trend in DR risk with increasing TyG index levels (P for trend =0.008). When TyG Q2 was designated as reference, the ORs for DR risk were 1.421 (95% CI: 1.045–1.934, P =0.025) for TyG Q3 and 1.873 (95% CI: 1.304–2.690, P =0.001) for TyG Q4, respectively, with the trend analysis further corroborating a significant escalation in DR risk (P for trend =0.003). Conversely, as delineated in Table 4, within the male cohort, irrespective of whether TyG Q1 or TyG Q2 served as the reference, the DR risk associated with TyG Q3 and TyG Q4 did not reach statistical significance, nor was a significant trend of increasing risk observed.
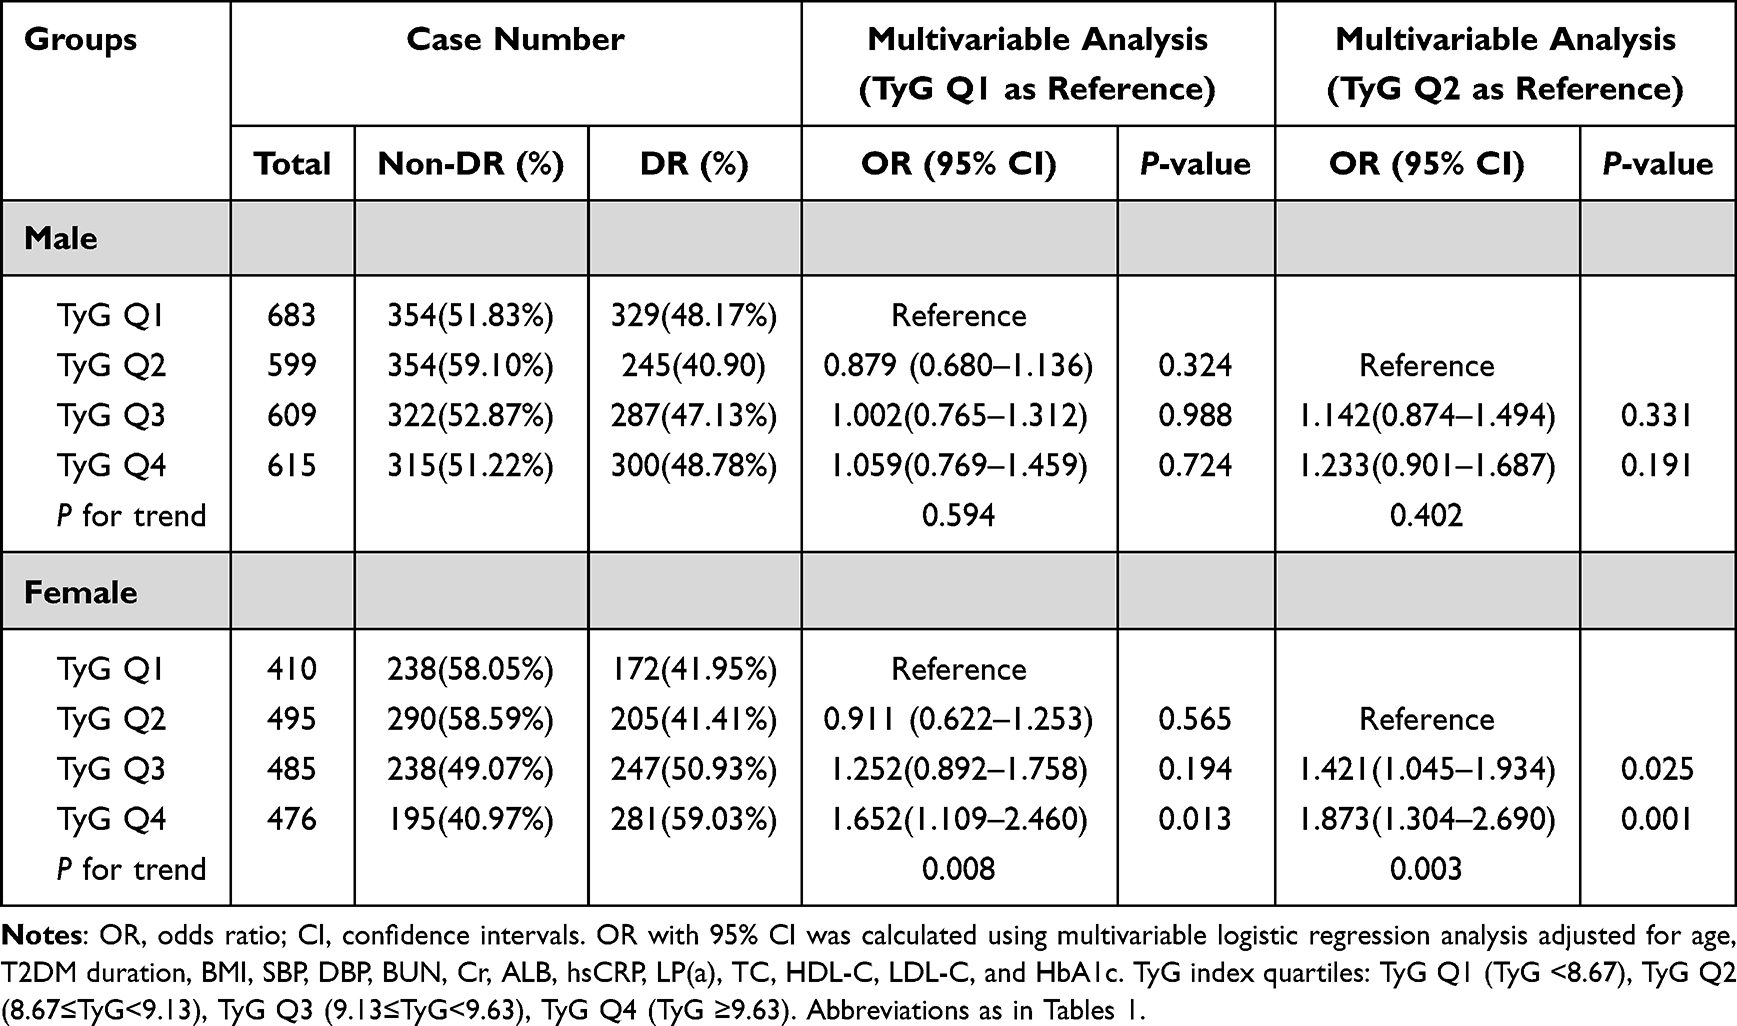 |
Table 4 Relationship Between TyG Index and Diabetic Retinopathy Risk Stratified by Gender |
The relationship between the TyG index and DR risk, stratified by age, was detailed in Table 5. In the age ≥59 group, when TyG Q1 was used as the reference group, the ORs for DR risk were 1.401 (95% CI: 1.049–1.871, P =0.022) for TyG Q3 and 1.618 (95% CI: 1.110–2.359, P =0.012) for TyG Q4, respectively, with a significant upward trend in DR risk observed as the TyG index increased (P for trend =0.012). Similarly, when TyG Q2 was used as the reference group, the ORs were 1.428 (95% CI: 1.084–1.879, P =0.011) for TyG Q3 and 1.618 (95% CI: 1.134–2.308, P =0.008) for TyG Q4, respectively, and the risk of DR incidence continued to exhibit a significant increasing trend (P for trend =0.011). These findings suggest a consistent and significant relationship between higher TyG index levels and elevated DR risk in patients of age ≥59 group.
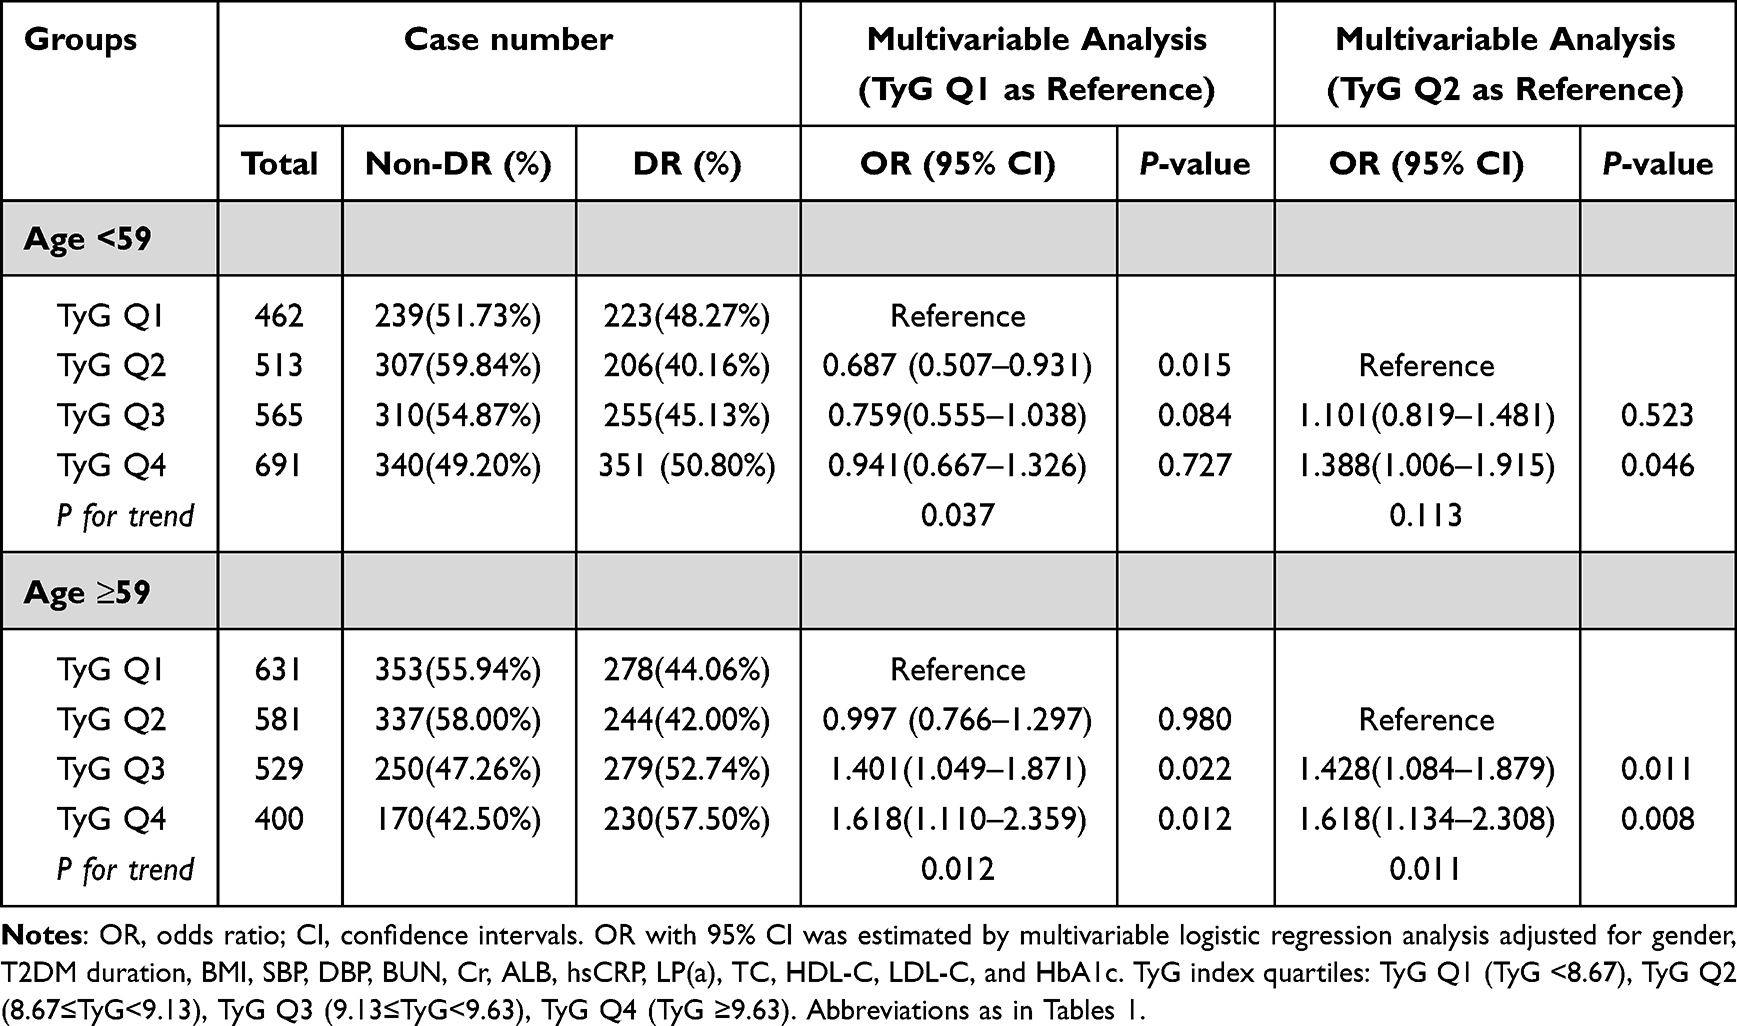 |
Table 5 Relationship Between TyG Index and Diabetic Retinopathy Risk Stratified by Age |
Association Between Glycemic Control and DR Risk Stratified by TyG Index Quartiles
The association between glycemic control and DR was evaluated, stratified by TyG index quartiles. First, we assessed the proportion of DR across TyG index quartiles within two glycemic control groups: HbA1c <7% and HbA1c ≥7% (Figure S1). In the group with HbA1c ≥7%, the proportion of DR across TyG quartiles (Q1-Q4) was 50.31%, 43.93%, 50.57%, and 54.35%, respectively. These proportions with HbA1c ≥7% were significantly higher than those in the group with HbA1c <7%, where the corresponding DR proportions were 32.73%, 28.92%, 34.96%, and 33.33% (all P<0.05) (Figure S1).
Multivariate logistic regression analysis (Figure S2) further elucidated the association between glycemic control and DR risk. Within the TyG Q1 group, individuals with HbA1c ≥7% had a 1.801-fold risk of DR (95% CI: 1.311–2.475, P <0.001) compared to those with HbA1c <7%. A similar pattern was observed in the TyG Q2 group, where the risk of DR was 1.640 times (95% CI: 1.125–2.393, P =0.010) among individuals with HbA1c ≥7%. However, this significant difference in DR risk was not observed in the TyG Q3 and TyG Q4 groups.
Patients was further stratified into three HbA1c groups: HbA1c <7%, HbA1c 7–9%, and HbA1c >9%. As shown in Figure 4, DR proportion significantly differed across HbA1c subgroups within each TyG index quartile (all P <0.05), with the highest proportion consistently observed in the HbA1c >9% subgroup (55.23% in TyG Q1, 47.66% in TyG Q2, 55.36% in TyG Q3, and 57.72% in TyG Q4).
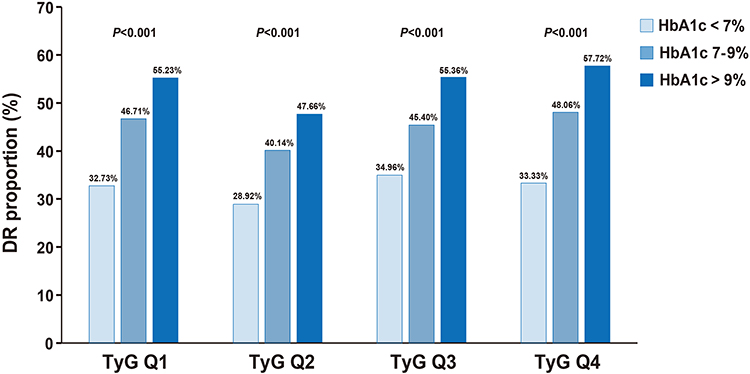 |
Figure 4 The proportion of diabetic retinopathy in HbA1c <7%, HbA1c 7–9%, and HbA1c >9% groups, stratified by TyG index quartiles. P<0.05 indicated a significant difference in the proportion of DR among the different HbA1c groups. TyG index quartiles: TyG Q1 (TyG <8.67), TyG Q2 (8.67≤TyG<9.13), TyG Q3 (9.13≤TyG<9.63), TyG Q4 (TyG ≥9.63). Abbreviations as in Table 1. |
As showed in Table 6, multivariate logistic regression analysis revealed a significant upward trend in the risk of DR with increasing HbA1c levels across each TyG index quartile (all P for trend <0.05), using HbA1c <7% as the reference. In TyG Q1, individuals with HbA1c >9% exhibited a 2.397-fold risk of DR (95% CI: 1.654–3.474, P <0.001) compared to the reference group. Similar trends for patients with HbA1c >9% were observed in TyG Q2 (OR: 1.897, 95% CI: 1.260–2.856, P =0.002) and TyG Q3 (OR: 1.964, 95% CI: 1.190–3.241, P =0.008) compared to those with HbA1c <7%. However, in TyG Q4, no significant differences in DR risk were observed between the HbA1c 7–9% and HbA1c >9% subgroups compared to HbA1c <7% group, respectively.
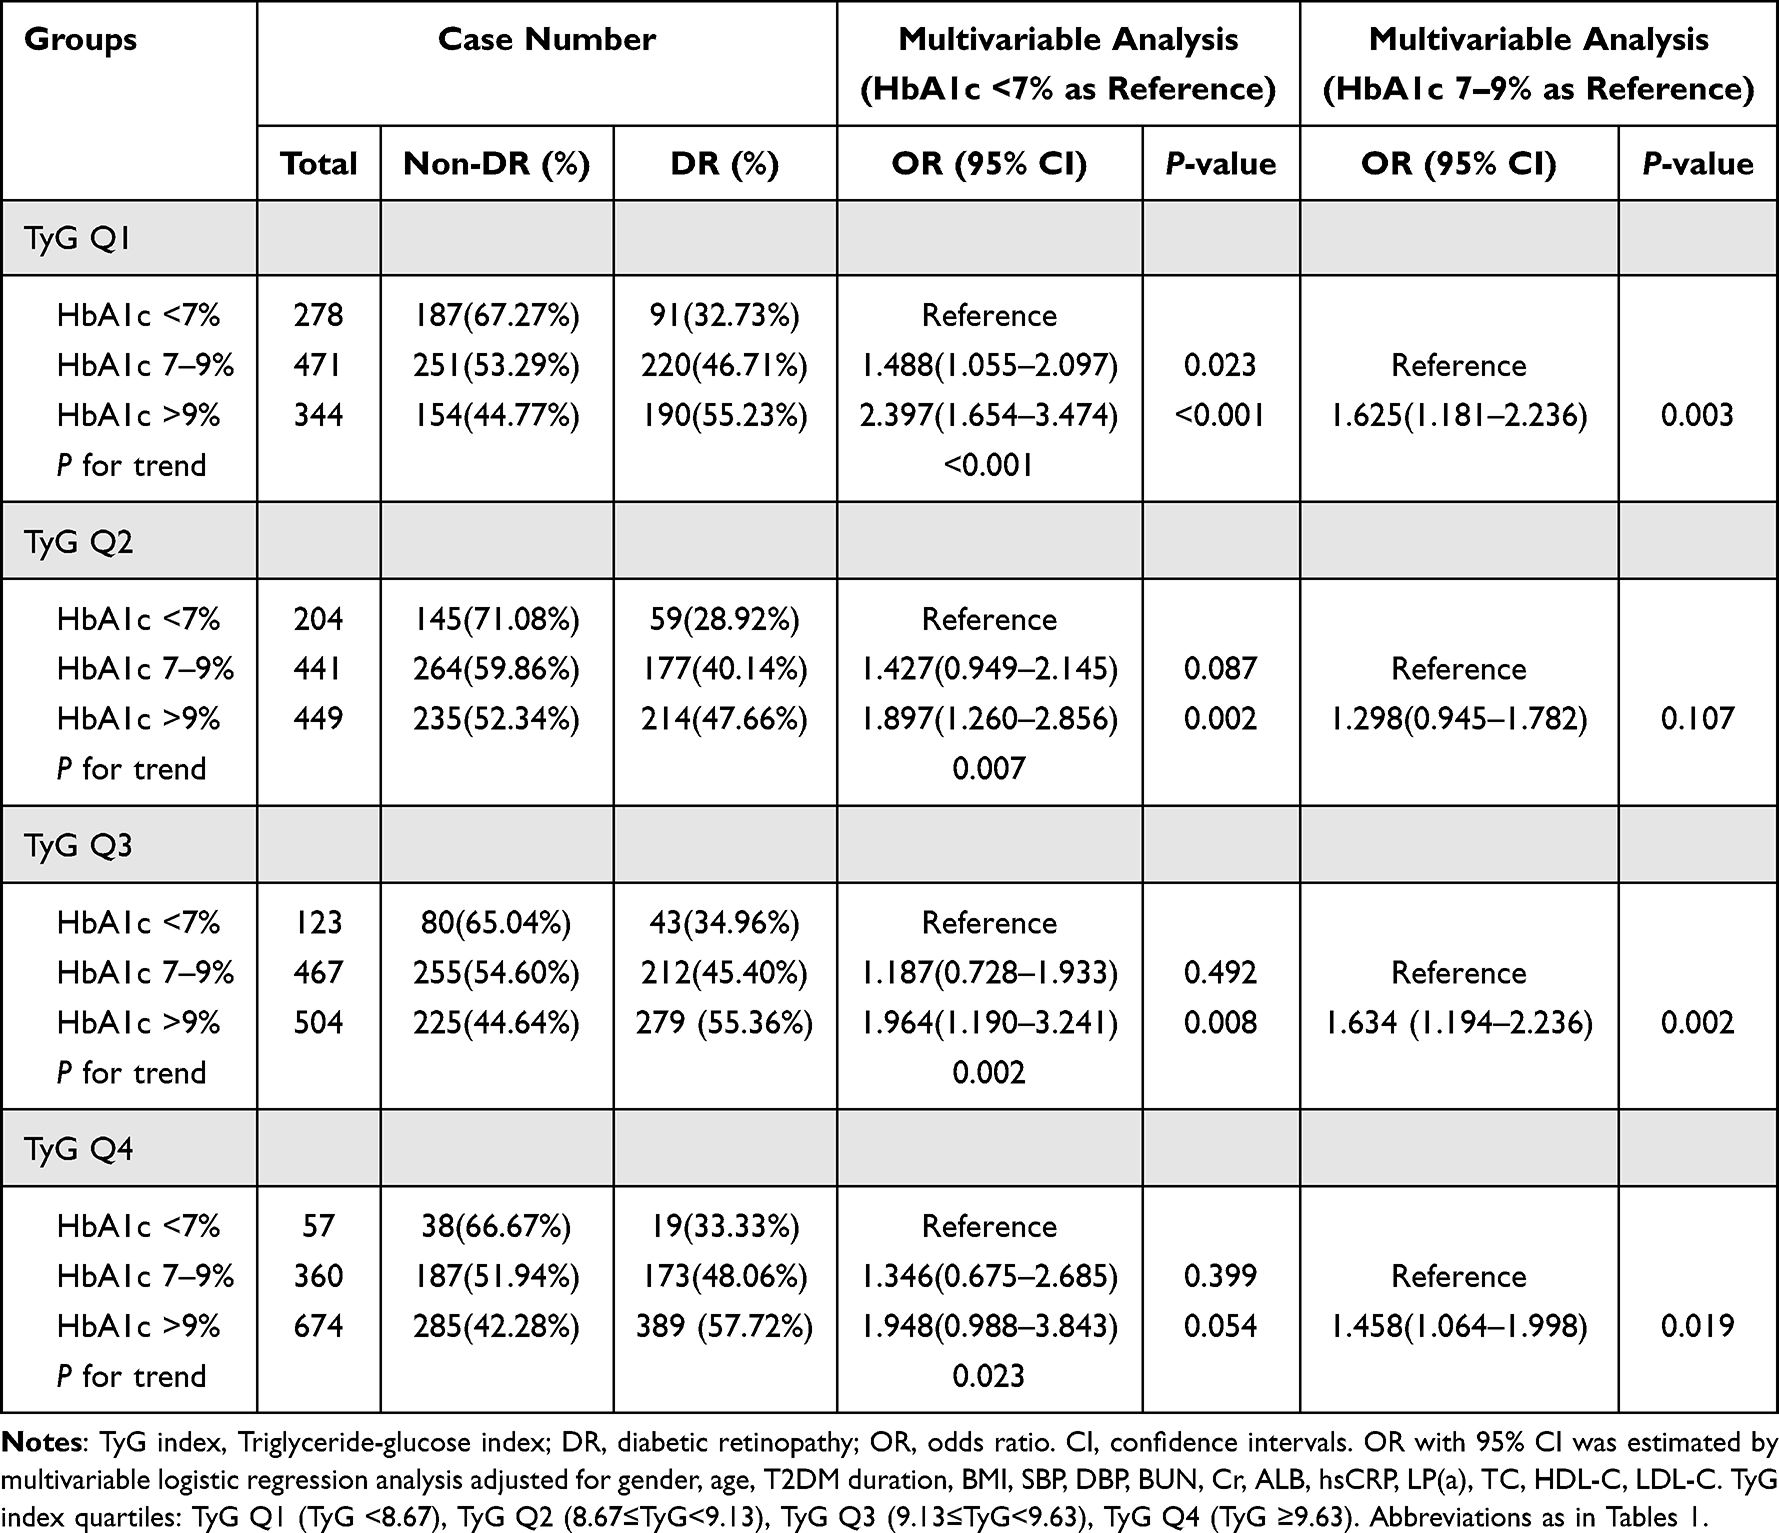 |
Table 6 Glycemic Control in Relation to the Risk of Diabetic Retinopathy According to TyG Index Quartiles |
Furthermore, within the TyG Q3 and TyG Q4 groups, individuals with HbA1c >9% had a 1.634-fold (95% CI: 1.194–2.236, P =0.002) and 1.458-fold (95% CI: 1.064–1.998, P =0.019) risk of DR, respectively, compared to those with HbA1c 7–9% (Table 6). A similar pattern was observed in the TyG Q1 group (OR: 1.625, 95% CI: 1.181–2.236, P =0.003). However, no significant difference in DR risk between HbA1c 7–9% and HbA1c >9% was observed in the TyG Q2 group.
Association Between TyG Index Quartiles and DR Risk Stratified by Glycemic Control
As shown in Figure S3, within the HbA1c ≥7% group, a significant difference in DR proportion was observed across TyG index quartiles (P <0.001). The DR proportions in TyG Q2, TyG Q3, and TyG Q4 were 43.93%, 50.57%, and 54.35%, respectively, demonstrating a significant upward trend (P <0.05). Notably, within the HbA1c ≥7% group, the DR proportion in TyG Q2 was significantly lower than that in TyG Q1 (50.31%, P =0.008), TyG Q3 (P =0.004), and TyG Q4 (P <0.001).
As detailed in Table S3, multivariate logistic regression analysis revealed that in the HbA1c ≥7% group, when TyG Q1 was used as the reference, the OR for DR risk was 1.344 (95% CI: 1.039–1.738, P =0.024) for TyG Q4, with a significant upward trend in DR risk as the TyG index increased (P for trend =0.005). Similarly, when TyG Q2 was used as the reference, the ORs were 1.260 (95% CI: 1.015–1.564, P =0.036) for TyG Q3 and 1.570 (95% CI: 1.232–1.999, P <0.001) for TyG Q4, respectively, with the risk of DR incidence continuing to show a significant increasing trend (P for trend =0.001). In contrast, within the HbA1c <7% group, no significant differences were observed in either DR proportion or DR risk evaluation across TyG quartiles.
Furthermore, when the HbA1c ≥7% group was subdivided into HbA1c 7–9% and >9% (Figure 5), significant differences in DR proportion across TyG quartiles were observed only in the HbA1c >9% subgroup (P =0.009), with no such differences in the HbA1c 7–9% subgroup. As shown in Figure 5, within the HbA1c >9% subgroup, DR proportions in TyG Q1, Q2, Q3, and Q4 were 55.23%, 47.66%, 55.36%, and 57.72%, respectively. Notably, DR proportion in TyG Q2 was significantly lower than in TyG Q4 (P <0.001).
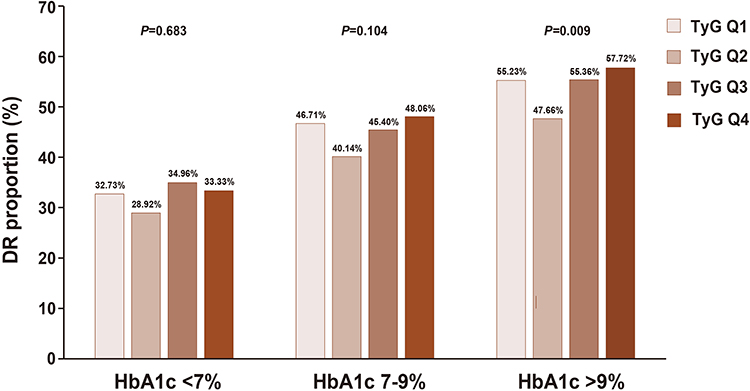 |
Figure 5 The proportion of diabetic retinopathy in TyG index quartiles, stratified by HbA1c<7%, HbA1c 7–9%, and HbA1c >9% groups. P<0.05 indicated a significant difference in the proportion of DR among TyG index quartiles. TyG index quartiles: TyG Q1 (TyG <8.67), TyG Q2 (8.67≤TyG<9.13), TyG Q3 (9.13≤TyG<9.63), TyG Q4 (TyG ≥9.63). Abbreviations as in Table 1. |
As demonstrated in Table 7, multivariate logistic regression analysis revealed that in the HbA1c >9% group, using TyG Q2 as the reference, the ORs for DR risk were 1.462 (95% CI: 1.077–1.984, P =0.015) for TyG Q3 and 1.635 (95% CI: 1.187–2.251, P =0.003) for TyG Q4, with a significant upward trend in DR risk as the TyG index increased (P for trend =0.007). In contrast, no significant differences in DR risk were observed across TyG quartiles in the HbA1c 7–9% subgroup.
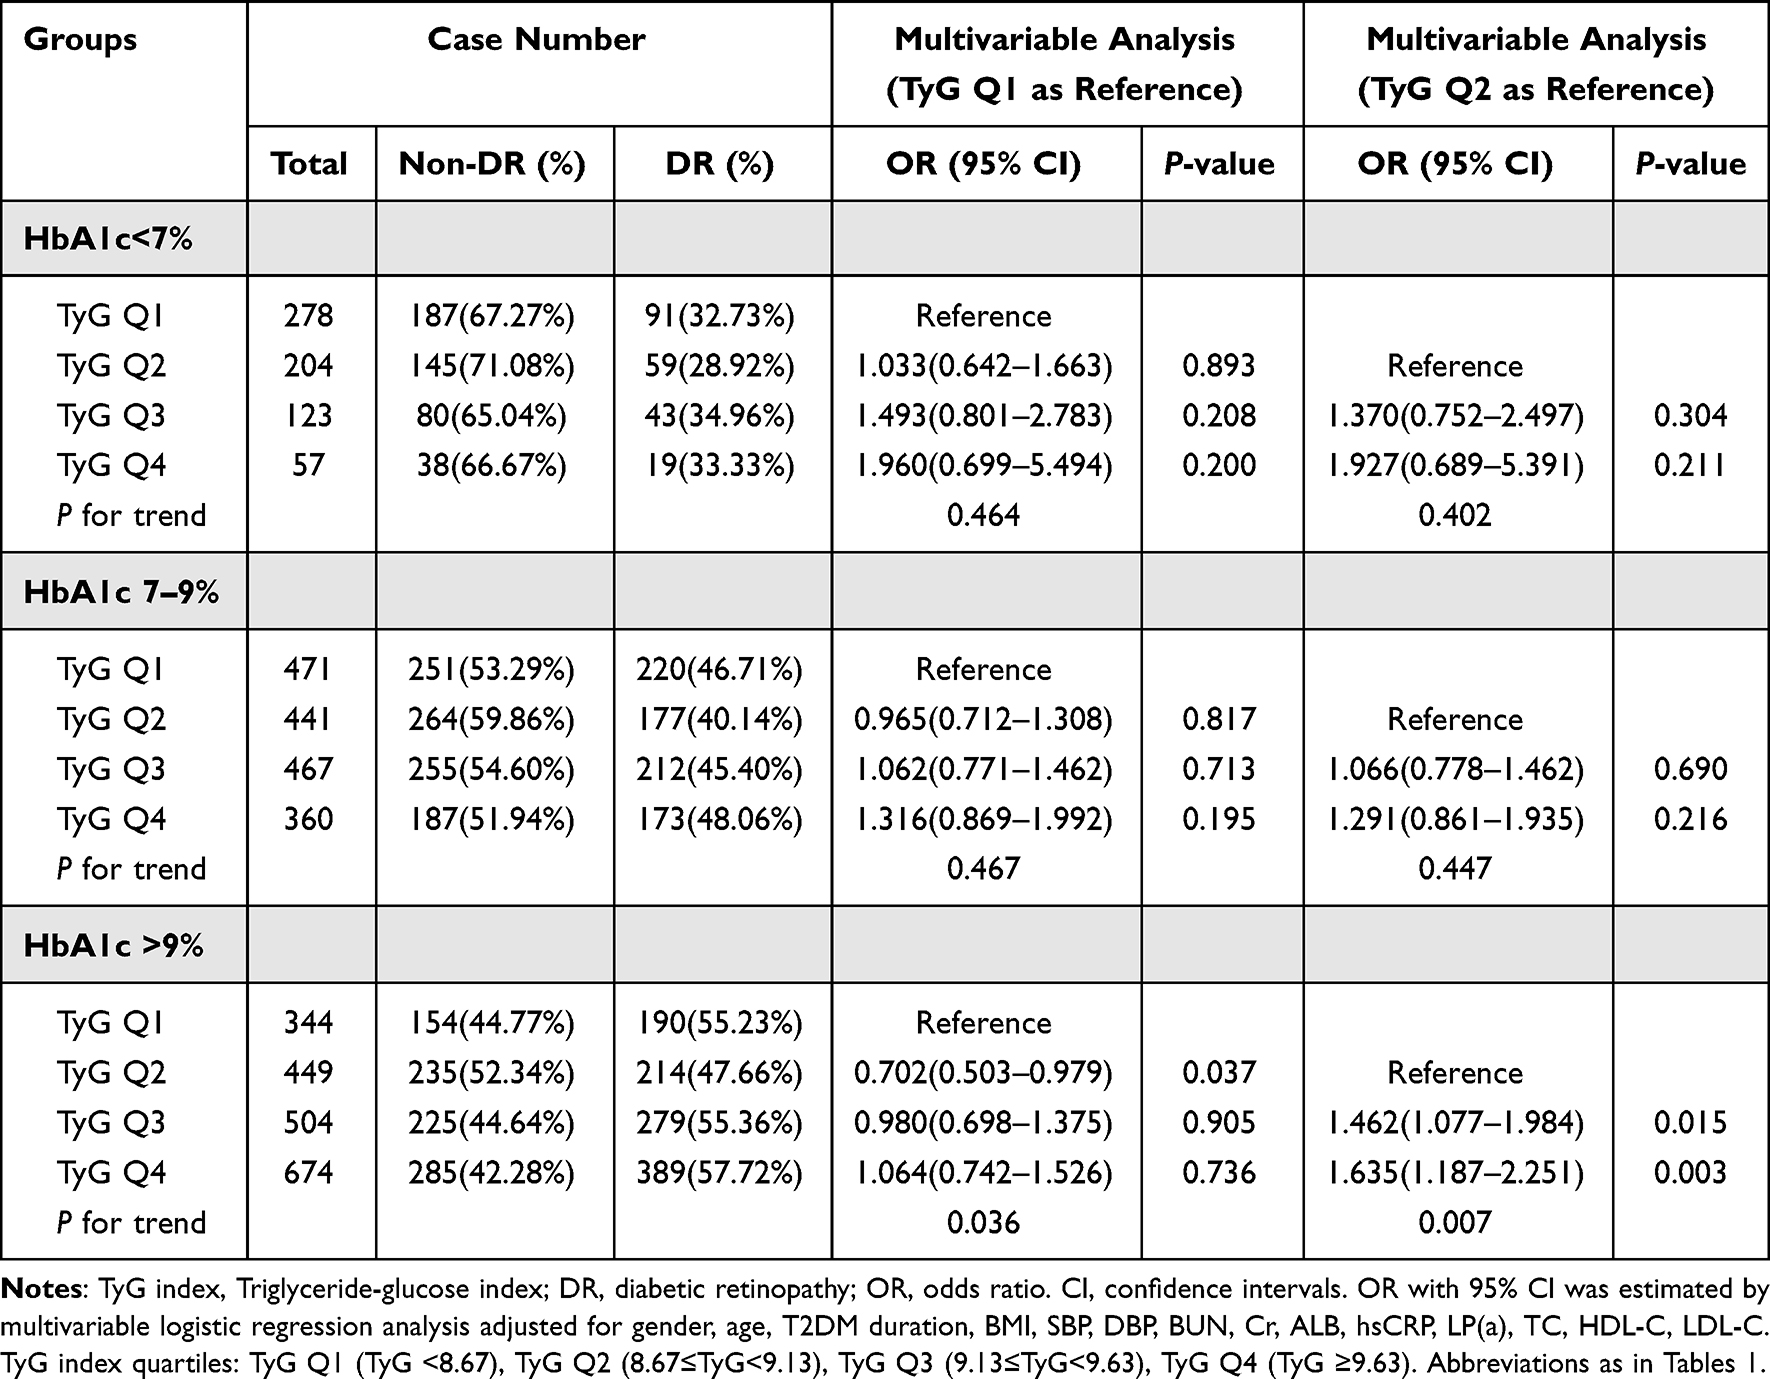 |
Table 7 The Logistic Regression Analysis for the Risk of Diabetic Retinopathy According to Glycemic Control and TyG Index Quartiles |
Discussion
Recently, the TyG index has gained recognition as a more practical and reliable predictor of IR.27 Numerous studies have been performed to evaluate the associations between TyG index and the risk assessment of diseases such as T2DM and cardiovascular disease.28–30 Some studies have also explored the relationship between TyG index and the occurrence and progression of DR.5,6,11,21 However, there is limited research on the interrelationships between TyG index, glucose control, and DR risk.
A number of risk variables, such as gender, age, prolonged diabetes duration, inadequate glycemic management, hypertension, dyslipidemia, obesity, and genetic factors, have been linked to the onset and progression of DR.31,32 In the study, the TyG index is significantly associated with the risk of DR, and this association varies by gender and age. The association of TyG index with DR risk was more significant among female and elders (≥59 years of age) patients.
In this study, the association among TyG index, glycemic control, and the risk of DR in T2DM patients was evaluated. Overall, the TyG index demonstrated a significant positive association with DR risk. Patients with T2DM and uncontrolled glycemia exhibited higher TyG index levels and an elevated risk of DR compared to those with controlled glycemia. The RCS results revealed that when the TyG index exceeded 8.61, the risk of DR increased significantly with further elevation of the TyG index. In this study, the positive association between TyG index levels and DR risk was particularly evident in patients with HbA1c >9%. Among these individuals, the TyG index levels for TyG Q2-Q4 were all ≥8.67, with corresponding DR proportions of 47.66%, 55.36%, and 57.72%, respectively. Multivariate regression analysis demonstrated that the DR risk in the TyG Q3 and TyG Q4 groups was significantly higher than that in the TyG Q2 group, indicating a clear positive association between rising TyG levels and increased DR risk. These findings suggest that the TyG index may serve as a valuable tool for DR risk stratification and glycemic control management in patients with T2DM.
At present, HbA1c is the metric used to date in clinical trials demonstrating the benefits of improved glycemic control. HbA1c reflects average glycemia over approximately 3 months. HbA1c is the primary tool for assessing glycemic control and has a strong predictive value for diabetes complications.26,33,34 Achieving optimal glycemic control remains a cornerstone in the prevention of DR.5 The relationship between glycemic control and DR is complex and multifaceted.17,30 Studies have shown that patients with diabetes who experience intermittent spikes in plasma glucose levels are at a higher risk of adverse outcomes than those with consistently elevated plasma glucose levels.35 Prolonged or uncontrolled hyperglycemia, recognized as the most consistent risk factor for DR,36 initiates a pro-inflammatory response that contributes to the breakdown of the blood-retinal barrier (BRB).37,38 This process results in a reduction of tight junction proteins, loss of pericytes and increased vascular permeability.39–41 Maintaining good metabolic control and achieving near-normal plasma glucose levels are essential for managing diabetes mellitus. This strategy has proven effective in preventing microvascular complications, including vision loss associated with DR.42 Although excess plasma glucose is thought to drive DR, hyperglycemia accounts for only 11% of variability in its risk. Even when patients with diabetes maintain similar levels of glycemic control, the progression of complications can vary significantly.43–45 This suggests that factors beyond glycemic control may play a crucial role in the development and progression of complications in people with diabetes.
Hyperglycemia is not the only factor contributing to retinal damage. Insulin therapy in T1DM and hyperinsulinemia in T2DM have also been implicated in both the onset and progression of retinopathy. In a representative sample of the US population aged 40 years and older, incident retinopathy was observed in 9.4% of patients without diabetes.46 These lesions were directly associated with HOMA-IR and were independent of HbA1c levels. Patients classified in the highest category of IR were 64% more likely to have retinopathy compared to those in the lowest category. Research has shown that the retina is intrinsically responsive to insulin, and IR in diabetes is linked to increased retinal inflammation.47,48 IR plays a crucial role in the pathophysiology of metabolic disturbances and endothelial dysfunction. DR has recently been identified as a neurovascular coupling impairment, encompassing both retinal neurodegeneration and vasculopathy. While hyperglycemia has traditionally been considered the primary driver of diabetic complications, impaired insulin signaling is also believed to contribute to retinal pathology. DR affects the retinal vasculature and can result in vision loss. It has been suggested that IR exacerbates DR and may serve as an independent predictor of its progression.49,50
The TyG index is an emerging marker of IR and is recognized as a composite biochemical indicator that reflects the combined effects of glucose and lipids. Recent studies have shown a strong association between IR and DR.5,6,11,51 A study by Neelam K et al5 showed that the TyG index is a valuable marker for optimizing risk stratification for DR among 1,339 Singaporean patients with T2DM. The findings suggest that considering the TyG index as a secondary treatment target could be beneficial for patients with well-controlled HbA1c levels. A meta-analysis revealed that individuals with a higher TyG index are more likely to have an increased risk of DR compared to those with a lower TyG index.6 A nested case-control study conducted by Yao et al51 on Chinese T2DM inpatients demonstrated a strong correlation between the TyG index and the severity of DR. Additionally, Zhou et al11 identified a U-shaped correlation between the TyG index and the risk of DR, highlighting its potential predictive value in assessing this condition. However, a study by Chiu et al14 found that an increase in the TyG index was strongly associated with microalbuminuria and the risk of cerebrovascular disease, yet it did not establish a significant link between the TyG index and DR. Some research indicates that the dysregulation of intraretinal lipid transport may play a more critical role in the pathogenesis of DR than the levels of plasma lipids The blood-retinal barrier shields the retina from potential damage caused by plasma lipoproteins.52 However, apolipoprotein B can harm retinal capillaries, leading to extravasation, and its levels have been associated with the severity of DR in patients with DM.53 Additionally, numerous confounding variables influence the relationship between the TyG index and DR risk. The variables adjusted for in different studies were not consistent, which may have affected the outcomes. Furthermore, variations in research designs, sample sizes, and statistical methods may also contribute to discrepancies in study findings.
Our study has several strengths. First, to our knowledge, it is the first research to investigate the role of the TyG index in relation to the risk of DR while considering glycemic control in patients with T2DM. We specifically identified that uncontrolled glycemia, especially HbA1c >9%, was associated with an increased risk of DR among individuals with a high TyG index. Second, we analyzed the TyG index both as a continuous and categorical variable to assess trends, which enhances the reliability of our findings. Third, we conducted subgroup analyses and interaction tests, identifying potential interactions with other variables, thereby further strengthening the credibility of our results.21
However, this study has several limitations. First, the TyG index may have been influenced by the use of hypoglycemic and lipid-lowering medications. As a single-center and cross-sectional study, it is limited in its capacity to establish the direction of the association or to infer causality. Prospective cohort studies are needed to evaluate the association between the TyG index and DR risk. Second, we did not include the comorbidity information as confounding factors, as obtaining this data accurately can be challenging, potentially introducing bias in the assessment of DR. And most data on the duration of T2DM come from the patient’s statement, rather than reliable follow-up data. In fact, accurately determining the actual duration of T2DM is difficult. The confounding variables in our study primarily consisted of clinical characteristics and routine biochemical test results, which are readily available in clinical practice but may still lead to some analytical biases. Finally, while the TyG index is a reliable and convenient surrogate marker for IR, this study did not directly compare the TyG index with the gold standard for measuring IR, limiting our ability to thoroughly elucidate the direct relationship between insulin resistance and DR.6,11,12
In summary, our study has found a stronger association between glycemic control status and the risk of DR in patients with T2DM who exhibit elevated TyG index levels. Additional research is necessary to validate specific glycemic control strategies and HbA1c targets, facilitated by the TyG index, in larger prospective studies. Furthermore, future prospective and longitudinal studies should explore the effects and mechanisms of glucose control and improved insulin resistance on DR risk in T2DM patients.
Conclusion
In this study, we demonstrated that the relationship between high TyG index and the risk of DR was more pronounced in patients with uncontrolled glycemia, especially HbA1c >9%. This finding indicates that the TyG index could be a valuable tool for risk stratification in managing glycemic control among patients with T2DM.
Abbreviations
T2DM, type 2 diabetes mellitus; DR, diabetic retinopathy; BMI, Body mass index; SBP, Systolic blood pressure; DBP, Diastolic blood pressure; FBG, fasting blood glucose; BUN, blood urea nitrogen; Cr, creatinine; ALB, albumin; hsCRP, hypersensitivity C-reactive protein; LP(a), lipoprotein A; TG, triglyceride; TC, total cholesterol; HDL-C, high-density lipoprotein cholesterol; LDL-C, low-density lipoprotein cholesterol; HbA1c, glycated hemoglobin A1c; TyG index, Triglyceride-glucose index; OR, odds ratio; CI, confidence intervals.
Data Sharing Statement
The datasets generated and/or analyzed during the current study are available from the corresponding author upon reasonable request.
Ethical Approval
The study was approved by the Ethics Committee of Beijing Tongren Hospital, Capital Medical University (approval number TREC2024-KY040).
Consent for Publication
The authors declare that the details of this study can be published and that the person (s) providing consent have been shown in the article content to be published.
Acknowledgment
Special acknowledgement to Prof. Biao Song for his support.
Author Contributions
All authors made a significant contribution to the work reported, whether that is in the conception, study design, execution, acquisition of data, analysis and interpretation, or in all these areas; took part in drafting, revising or critically reviewing the article; gave final approval of the version to be published; have agreed on the journal to which the article has been submitted; and agree to be accountable for all aspects of the work.
Funding
This study was supported by the Capital’s Funds for Health Improvement and Research [No.2024-3-1181] and the National Natural Science Foundation of China [No.82372304].
Disclosure
The authors declare that the study has no conflicts of interest in this work.
References
1. Teo ZL, Tham YC, Yu M. et al. Global prevalence of diabetic retinopathy and projection of burden through 2045: systematic review and meta-analysis. Ophthalmology. 2021;128(11):1580–1591. doi:10.1016/j.ophtha.2021.04.027
2. Saeedi P, Petersohn I, Salpea P, et al. Global and regional diabetes prevalence estimates for 2019 and projections for 2030 and 2045: results from the international diabetes federation diabetes atlas. 9th Edition Diabetes Res Clin Pract. 2019;157:107843. doi:10.1016/j.diabres.2019.107843
3. Alharbi AMD, Alhazmi AMS. Prevalence, risk factors, and patient awareness of diabetic retinopathy in Saudi Arabia: a review of the literature. Cureus. 2020;12(12):e11991. doi:10.7759/cureus.11991
4. Kropp M, Golubnitschaja O, Mazurakova A, et al. Diabetic retinopathy as the leading cause of blindness and early predictor of cascading complications-risks and mitigation. EPMA J. 2023;14(1):21–42. doi:10.1007/s13167-023-00314-8
5. Neelam K, Aung KCY, Ang K, Tavintharan S, Sum CF, Lim SC. Association of triglyceride glucose index with prevalence and incidence of diabetic retinopathy in a Singaporean population. Clin Ophthalmol. 2023;17:445–454. doi:10.2147/OPTH.S382336
6. Zhou J, Zhu L, Li Y. Association between the triglyceride glucose index and diabetic retinopathy in type 2 diabetes: a meta-analysis. Front Endocrinol. 2023;14:1302127. doi:10.3389/fendo.2023.1302127
7. Busik JV. Lipid metabolism dysregulation in diabetic retinopathy. J Lipid Res. 2021;62:100017. doi:10.1194/jlr.TR120000981
8. Yue T, Shi Y, Luo S, Weng J, Wu Y, Zheng X. The role of inflammation in immune system of diabetic retinopathy: molecular mechanisms, pathogenetic role and therapeutic implications. Front Immunol. 2022;13:1055087. doi:10.3389/fimmu.2022.1055087
9. DeFronzo RA, Tobin JD, Andres R. Glucose clamp technique: a method for quantifying insulin secretion and resistance. Am J Physiol. 1979;237(3):E214–223. doi:10.1152/ajpendo.1979.237.3.E214
10. Matthews DR, Hosker JP, Rudenski AS, Naylor BA, Treacher DF, Turner RC. Homeostasis model assessment: insulin resistance and beta-cell function from fasting plasma glucose and insulin concentrations in man. Diabetologia. 1985;28(7):412–419. doi:10.1007/BF00280883
11. Zhou Y, Lu Q, Zhang M, Yang L, Shen X. The U-shape relationship between triglyceride-glucose index and the risk of diabetic retinopathy among the US population. J Pers Med. 2023;13(3):495. doi:10.3390/jpm13030495
12. Pan Y, Zhong S, Zhou K, et al. Association between diabetes complications and the triglyceride-glucose index in hospitalized patients with type 2 diabetes. J Diabetes Res. 2021;2021:8757996. doi:10.1155/2021/8757996
13. Nayak SS, Kuriyakose D, Polisetty LD, et al. Diagnostic and prognostic value of triglyceride glucose index: a comprehensive evaluation of meta-analysis. Cardiovasc Diabetol. 2024;23(1):310. doi:10.1186/s12933-024-02392-y
14. Chiu H, Tsai HJ, Huang JC, et al. Associations between triglyceride-glucose index and micro- and macro-angiopathies in type 2 diabetes mellitus. Nutrients. 2020;12(2):328. doi:10.3390/nu12020328
15. Montaser E, Shah VN. Prediction of incident diabetic retinopathy in adults with type 1 diabetes using machine learning approach: an exploratory study. J Diabetes Sci Technol. 2024;19322968241292369. doi:10.1177/19322968241292369
16. Semeraro F, Parrinello G, Cancarini A, et al. Predicting the risk of diabetic retinopathy in type 2 diabetic patients. J Diabetes Complications. 2011;25(5):292–297. doi:10.1016/j.jdiacomp.2010.12.002
17. Lee CC, Hsing SC, Lin YT, et al. The importance of close follow-up in patients with early-grade diabetic retinopathy: a Taiwan population-based study grading via deep learning model. Int J Environ Res Public Health. 2021;18(18):9768. doi:10.3390/ijerph18189768
18. Chrvala CA, Sherr D, Lipman RD. Diabetes self-management education for adults with type 2 diabetes mellitus: a systematic review of the effect on glycemic control. Patient Educ Couns. 2016;99(6):926–943. doi:10.1016/j.pec.2015.11.003
19. Alberti KG, Zimmet PZ. Definition, diagnosis and classification of diabetes mellitus and its complications. Part 1: diagnosis and classification of diabetes mellitus provisional report of a WHO consultation. Diabet Med. 1998;15(7):539–553. doi:10.1002/(SICI)1096-9136(199807)15:7<539::AID-DIA668>3.0.CO;2-S
20. Jia W, Weng J, Zhu D, et al. Standards of medical care for type 2 diabetes in China 2019. Diabetes Metab Res Rev. 2019;35(6):e3158. doi:10.1002/dmrr.3158
21. Xu YX, Pu SD, Zhang YT, et al. Insulin resistance is associated with the presence and severity of retinopathy in patients with type 2 diabetes. Clin Exp Ophthalmol. 2024;52(1):63–77. doi:10.1111/ceo.14344
22. Huang D, Ma R, Zhong X, et al. Positive association between different triglyceride glucose index-related indicators and psoriasis: evidence from NHANES. Front Immunol. 2023;14:1325557. doi:10.3389/fimmu.2023.1325557
23. Wilkinson CP, Ferris FL 3rd, Klein RE, et al. Proposed international clinical diabetic retinopathy and diabetic macular edema disease severity scales. Ophthalmology. 2003;110(9):1677–1682. doi:10.1016/S0161-6420(03)00475-5
24. Gao L, Zhao W, Yang JK, Qin MZ. Proliferative diabetic retinopathy in patients with type 2 diabetes correlates with the presence of atherosclerosis cardiovascular disease. Diabetol Metab Syndr. 2021;13(1):48. doi:10.1186/s13098-021-00666-z
25. Liu XC, He GD, Lo K, Huang YQ, Feng YQ. The triglyceride-glucose index, an insulin resistance marker, was non-linear associated with all-cause and cardiovascular mortality in the general population. Front Cardiovasc Med. 2021;7:628109. doi:10.3389/fcvm.2020.628109
26. ElSayed NA, Aleppo G, Aroda VR, et al. 6. Glycemic targets: standards of care in diabetes-2023. Diabetes Care. 2023;46(Suppl 1):S97–S110. doi:10.2337/dc23-S006
27. Lee SH, Park SY, Choi CS. Insulin resistance: from mechanisms to therapeutic strategies. Diabetes Metab J. 2022;46(1):15–37. doi:10.4093/dmj.2021.0280
28. Zimmet P, Alberti KG, Shaw J. Global and societal implications of the diabetes epidemic. Nature. 2001;414(6865):782–787. doi:10.1038/414782a
29. Yin JL, Yang J, Song XJ, et al. Triglyceride-glucose index and health outcomes: an umbrella review of systematic reviews with meta-analyses of observational studies. Cardiovasc Diabetol. 2024;23(1):177. doi:10.1186/s12933-024-02241-y
30. Akil H, Burgess J, Nevitt S, Harding SP, Alam U, Burgess P. Early worsening of retinopathy in type 1 and type 2 diabetes after rapid improvement in glycaemic control: a systematic review. Diabetes Ther. 2022;13(1):1–23. doi:10.1007/s13300-021-01190-z
31. Mishra S, Vishwakarma PK, Tripathi M, Ojha S, Tripathi SM. Diabetic retinopathy: clinical features, risk factors, and treatment options. Curr Diabetes Rev. 2024;20(7):e271023222871. doi:10.2174/0115733998252551231018080419
32. Song P, Yu J, Chan KY, Theodoratou E, Rudan I. Prevalence, risk factors and burden of diabetic retinopathy in China: a systematic review and meta-analysis. J Glob Health. 2018;8(1):010803. doi:10.7189/jogh.08.010803
33. Laiteerapong N, Ham SA, Gao Y, et al. The legacy effect in type 2 diabetes: impact of early glycemic control on future complications (the diabetes & aging study). Diabetes Care. 2019;42(3):416–426. doi:10.2337/dc17-1144
34. Stratton IM, Adler AI, Neil HA, et al. Association of glycaemia with macrovascular and microvascular complications of type 2 diabetes (UKPDS 35): prospective observational study. BMJ. 2000;321(7258):405–412. doi:10.1136/bmj.321.7258.405
35. UK Prospective Diabetes Study (UKPDS) Group. Effect of intensive blood-glucose control with metformin on complications in overweight patients with type 2 diabetes (UKPDS 34). Lancet. 1998;352(9131):854–865. doi:10.1016/S0140-6736(98)07037-8
36. Solomon SD, Chew E, Duh EJ, et al. Diabetic retinopathy: a position statement by the American diabetes association. Diabetes Care. 2017;40(3):412–418. doi:10.2337/dc16-2641
37. Clarkson-Townsend DA, Douglass AJ, Singh A, Allen RS, Uwaifo IN, Pardue MT. Impacts of high fat diet on ocular outcomes in rodent models of visual disease. Exp Eye Res. 2021;204:108440. doi:10.1016/j.exer.2021.108440
38. Kowluru RA. Retinopathy in a diet-induced type 2 diabetic rat model and role of epigenetic modifications. Diabetes. 2020;69(4):689–698. doi:10.2337/db19-1009
39. Chao AC, Lee TC, Juo SH, Yang DI. Hyperglycemia increases the production of amyloid beta-peptide leading to decreased endothelial tight junction. CNS Neurosci Ther. 2016;22(4):291–297. doi:10.1111/cns.12503
40. Song J, Yoon SR, Kim OY, Khanna S. miR-Let7A controls the cell death and tight junction density of brain endothelial cells under high glucose condition. Oxid Med Cell Longev. 2017;2017(1):6051874. doi:10.1155/2017/6051874
41. Hammes HP, Lin J, Wagner P, et al. Angiopoietin-2 causes pericyte dropout in the normal retina: evidence for involvement in diabetic retinopathy. Diabetes. 2004;53(4):1104–1110. doi:10.2337/diabetes.53.4.1104
42. Aiello LP, DCCT/EDIC Research Group. Diabetic retinopathy and other ocular findings in the diabetes control and complications trial/epidemiology of diabetes interventions and complications study. Diabetes Care. 2014;37(1):17–23. doi:10.2337/dc13-2251
43. The Diabetes Control and Complications Trial Research Group. The relationship of glycemic exposure (HbA1c) to the risk of development and progression of retinopathy in the diabetes control and complications trial. Diabetes. 1995;44(8):968–983. doi:10.2337/diab.44.8.968
44. Gómez-Peralta F, Pinés-Corrales PJ, Santos E, Cuesta M, González-Albarrán O, Azriel S, On Behalf The Agora Diabetes Collaborative Group. Diabetes management based on the phenotype and stage of the disease: an expert proposal from the AGORA diabetes collaborative group. J Clin Med. 2024;13(16):4839. doi:10.3390/jcm13164839
45. Aroda VR, Eckel RH. Reconsidering the role of glycaemic control in cardiovascular disease risk in type 2 diabetes: a 21st century assessment. Diabetes Obes Metab. 2022;24(12):2297–2308. doi:10.1111/dom.14830
46. Bao YK, Yan Y, Wilson B, Gordon MO, Semenkovich CF, Rajagopal R. Association of retinopathy and insulin resistance: NHANES 2005-2008. Curr Eye Res. 2020;45(2):173–176. doi:10.1080/02713683.2019.1659977
47. Lee JJ, Wang PW, Yang IH, et al. High-fat diet induces toll-like receptor 4-dependent macrophage/microglial cell activation and retinal impairment. Invest Ophthalmol Vis Sci. 2015;56(5):3041–3050. doi:10.1167/iovs.15-16504
48. Jiang Y, Thakran S, Bheemreddy R, et al. Pioglitazone normalizes insulin signaling in the diabetic rat retina through reduction in tumor necrosis factor α and suppressor of cytokine signaling 3. J Biol Chem. 2014;289(38):26395–26405. doi:10.1074/jbc.M114.583880
49. Jeong Y, Lee BJ, Hur W, Lee M, Han SH. Associations of insulin resistance and high-sensitivity c-reactive protein with metabolic abnormalities in Korean Patients with type 2 diabetes mellitus: a preliminary study. Metabolites. 2024;14(7):371. doi:10.3390/metabo14070371
50. Zheng Z, Yu X. Insulin resistance in the retina: possible implications for certain ocular diseases. Front Endocrinol. 2024;15:1415521. doi:10.3389/fendo.2024.1415521
51. Yao L, Wang X, Zhong Y, et al. The triglyceride-glucose index is associated with diabetic retinopathy in Chinese patients with type 2 diabetes: a hospital-based, nested, case-control study. Diabetes Metab Syndr Obes. 2021;14:1547–1555. doi:10.2147/DMSO.S294408
52. Simó R, García-Ramírez M, Higuera M, Hernández C. Apolipoprotein A1 is overexpressed in the retina of diabetic patients. Am J Ophthalmol. 2009;147(2):319–325.e1. doi:10.1016/j.ajo.2008.08.009
53. Wu M, Chen Y, Wilson K, et al. Intraretinal leakage and oxidation of LDL in diabetic retinopathy. Invest Ophthalmol Vis Sci. 2008;49(6):2679–2685. doi:10.1167/iovs.07-1440
 © 2025 The Author(s). This work is published and licensed by Dove Medical Press Limited. The
full terms of this license are available at https://www.dovepress.com/terms
and incorporate the Creative Commons Attribution
- Non Commercial (unported, 3.0) License.
By accessing the work you hereby accept the Terms. Non-commercial uses of the work are permitted
without any further permission from Dove Medical Press Limited, provided the work is properly
attributed. For permission for commercial use of this work, please see paragraphs 4.2 and 5 of our Terms.
© 2025 The Author(s). This work is published and licensed by Dove Medical Press Limited. The
full terms of this license are available at https://www.dovepress.com/terms
and incorporate the Creative Commons Attribution
- Non Commercial (unported, 3.0) License.
By accessing the work you hereby accept the Terms. Non-commercial uses of the work are permitted
without any further permission from Dove Medical Press Limited, provided the work is properly
attributed. For permission for commercial use of this work, please see paragraphs 4.2 and 5 of our Terms.