Back to Journals » Neuropsychiatric Disease and Treatment » Volume 18
Elevated Red Blood Cell Distribution Width Levels at Admission Predicts Depression After Acute Ischemic Stroke: A 3-Month Follow-Up Study
Authors Li Y, Zhang M ![]() , Dong C, Xue M, Li J, Wu G
, Dong C, Xue M, Li J, Wu G
Received 29 November 2021
Accepted for publication 17 March 2022
Published 31 March 2022 Volume 2022:18 Pages 695—704
DOI https://doi.org/10.2147/NDT.S351136
Checked for plagiarism Yes
Review by Single anonymous peer review
Peer reviewer comments 2
Editor who approved publication: Dr Yu-Ping Ning
Yaqiang Li,1,2 Mei Zhang,1 Chunhui Dong,3 Min Xue,1 Jing Li,1 Guixiang Wu2
1Department of Neurology, First Affiliated Hospital of Anhui University of Science and Technology, First People’s Hospital of Huainan, Huainan, 232001, Anhui, People’s Republic of China; 2Department of Neurology, People’s Hospital of Lixin County, Lixin, 236700, Anhui, People’s Republic of China; 3School of Medicine, Anhui University of Science and Technology, Huainan, 232001, Anhui, People’s Republic of China
Correspondence: Mei Zhang; Min Xue, Department of Neurology, First Affiliated Hospital of Anhui University of Science and Technology, First People’s Hospital of Huainan, 203 Huaibin Road, Huainan, 232007, Anhui Province, People’s Republic of China, Tel +86 13955466855 ; +86 13866336522, Email [email protected]; [email protected]
Purpose: Red blood cell distribution width (RDW) is closely related to inflammatory-related disease markers. The present study aimed to investigate the association between the red blood cell distribution width (RDW) and post-stroke depression (PSD).
Patients and Methods: A total of 414 patients with acute ischemic stroke (AIS) admitted to our hospital from June 2018 to July 2021 were consecutively enrolled and received 3 months’ follow-up. According to the 17-item Hamilton Depression Scale (HAMD) assessment, they were divided into PSD group and non-PSD group. Diagnosis of PSD was made in accordance with DSM-IV. RDW was recorded within 24 hours of admission.
Results: Among the included 414 patients, 95 (22.95%) patients were diagnosed as having PSD at 3 months after stroke. The results showed significantly higher level of RDW in patients with depression (13.69 (IQR13.24– 13.88) vs. 13.56 (IQR 12.67– 13.77), P< 0.001) at admission than patients without depression. After adjustment for potential confounding factors, the odds ratio of PSD was 5.707 (95% CI, 2.717– 11.989) for the highest tertile of RDW compared with the lowest tertile. Moreover, based on the receiver operating characteristic (ROC) curve, the optimal cutoff of RDW levels as an indicator for the prediction of PSD was projected as 13.01, which yielded a sensitivity of 83% and a specificity of 41.0%, with an area under the curve (AUC) of 0.643 (95% CI, 0.585– 0.701; P = 0.012).
Conclusion: Higher RDW levels at admission were found to be correlated with PSD 3 months after stroke.
Keywords: inflammation, red blood cell distribution width, depression, stroke
Introduction
Post-stroke depression (PSD) is a frequent complication of acute ischemic stroke (AIS), which can occur in the acute and recovery phases of stroke, with prevalence ranging from 8% to 46%.1 The appearance of PSD has been related to negative impact on neurological function and cognitive function, delayed the recovery process, increased the risk of stroke recurrence and mortality, and affected the prognosis of patients.2–4 Nevertheless, the underlying neurobiological mechanisms of PSD have not yet been completely explored. Here, the early diagnosis and rational treatment of PSD is vital for the reduction of stroke complications and mortality, as well as for better functional rehabilitation.
Many research findings have demonstrated that proinflammatory factors are of vital importance in the development of stroke and psychosomatic disorders.5,6 For instance, previous extensive numerous studies had documented that patients with a poor prognosis after stroke had a significant increase in inflammatory markers including pentraxin 3, interleukin-18 (IL-18), interleukin-6, interleukin-8, and high-sensitivity C-reactive protein (hs-CRP).7–9 Many studies have shown that higher levels of inducible nitric oxide synthase (iNOS), systemic immune-inflammation index, macrophage inflammatory protein 1α (MIP-1α), and hs-CRP are positively associated with increased risk for PSD.10–12 In another study, IL-18 has also been shown to be correlated with PSD and plays an important role in the development of depression-like behaviors through the IL-18 receptor/NKCC1 signaling pathway.13,14 In the final analysis, it is considered that the above proinflammatory mediators could contribute to foundation of PSD diagnosis.
Recently, the red blood cell distribution width (RDW), an easily available marker of inflammatory-related disease, has been reported to be associated with various diseases, including cardiovascular disease, but the detailed mechanisms have not been completely explored.15 Besides, a large number of studies have appeared a near affiliation between poor clinical outcomes and high RDW levels in the intense stage of maladies such as stroke, and hemorrhagic transformation in acute ischemic stroke patients who have experienced intravenous thrombolysis.16,17 Similarly, Kim et al found that higher RDW levels at admission were related to a 3-month poor functional prognosis in patients with AIS treated with intravenous thrombolysis.18 Additionally, a close association has been shown between depression and RDW. Shafiee and Demircan et al found that RDW levels were essentially higher in depressive patients.19,20 Therefore, given the involvement of RDW in depression and the higher RDW levels may contribute to poor functional outcomes among stroke patients, whether RDW is correlated with the advancement of PSD at 3 months after stroke was investigated.
Materials and Methods
Patients and Study Design
Patients with AIS were enrolled consecutively from the First Affiliated Hospital of Anhui University of Science and Technology between June 2018 and July 2021. The exclusion criteria were as follows for the participants: (1) patients with a history of depression or other psychiatric disorders; (2) patients with serious dysarthria or aphasia; (3) patients taking antidepressant drugs prior to stroke onset; (4) patients with a history of dementia; (5) patients with a history of tumors; (6) patients with severe hepatic or renal disease; (7) patients with an active infection history 2 weeks before stroke onset; (8) patients with other central nervous system diseases; (9) patients diagnosed with transient ischemic attacks (TIA); (10) patients with blood system diseases; and (11) patients with extreme stroke condition that they might not follow up in 3 months.
The participants who were accepted for consideration met the following criteria: (1) age greater than 18 years and less than 80 years; (2) the ability and eagerness to provide informed consent; and (3) verified from computed tomography or magnetic resonance imaging of 1.5-T or 3.0-T framework reports performed inside 24 h after admission. Ultimately, 414 patients with AIS were included in this study (Figure 1). This study was approved by the Ethics Committee of the First Affiliated Hospital of Anhui University of Science and Technology, and all participants signed an informed consent form before participation, according to the Helsinki Declaration of 1975.
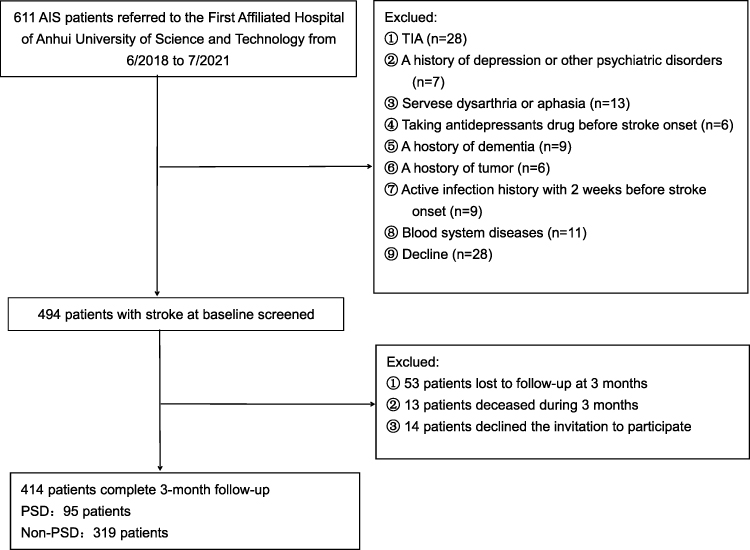 |
Figure 1 Study recruitment profile. Abbreviations: PSD, post-stroke depression; AIS, acute ischemic stroke; TIA, transient ischemic attack. |
Data Collection
At baseline, demographic data (gender, age), marital status (married or single), level of education, and vascular risk factor (hypertension, diabetes mellitus, coronary heart disease, atrial fibrillation, current smoking, alcohol consumption, prior stroke) were collected from standardized surveys, which were given in face-to-face interviews by professionally trained physicians. AIS severity was assessed by certified neurologist using the National Institutes of Health Stroke Scale (NIHSS) on the first day (time 1) and on day 90 (time 2) after admission.21 The Barthel index (BI), modified Rankin Scale (mRS) and the Mini-Mental State Exam (MMSE) were used to evaluate functional outcome and cognitive functions, respectively, at 3 months after stroke.22–24
Neuropsychiatric Assessment
All participants were interviewed or telephone interviews for depressive symptoms using the 17-item Hamilton Depression Scale at 3 months, unless they died or were lost.25 Patients with a HAMD score ≥8 were considered to be diagnosed corresponding to the Structured Clinical Interview for the Diagnostic and Statistical Manual of Mental Disorders, 4th edition (DSM-IV). Evaluations were conducted by professional researchers to whom the patients’ laboratories were completely unknown.
Blood Collection and Laboratory Test
The 3 mL venous blood of patients was collected into the EDTA containing tube (Becton, Dickinson and Company, USA) from the antecubital vein within 24 h after admission. Routine blood examination (hemoglobin, white blood cell count, platelet count, and RDW) were measured using a Sysmex XE-2100 Hematology Automated Analyzer (Sysmex, Kobe, Japan) at our hospital’s laboratory by investigators blinded to the clinical outcomes and neuroimaging findings. Biochemical measurements (Glucose, TG, TC, HDL-C, LDL-C, ApoA, ApoB, Hcy) were performed using standard laboratory methods at admission. All methods and procedures used in this study followed the relevant instructions strictly.
Statistical Analysis
The data was processed and analyzed by SPSS22.0 statistical software (SPSS, Inc., Chicago, IL, USA). Continuous variables were exhibited as mean ± SD or median and interquartile range [M (p25, p75)]. When the continuous variables were tested for abnormal distribution, the Kolmogorov-Smirnov test and Mann-Whitney U-test were used to assess differences in three-group and two-group comparisons, respectively. The continuous variables of normal distribution were analyzed with Student’s t-test or one-way analysis of variance. Proportions were compared using the Chi-square test or Fisher exact test for as appropriate. Pearson or Spearman rank correlation analyses were used to evaluate the linear correlations between HAMD scores and other factors (NIHSS1 score, NIHSS2 scores, mRS score, BI score). Multivariable regression analyses were exhibited using 3 models to recognize the predictive factors of PSD, among which model 1 was adjusted for age and sex, model 2 was adjusted for model 1 and vascular risk factors (hypertension, diabetes mellitus, coronary heart disease, atrial fibrillation, current smoking, alcohol consumption, prior stroke), and model 3 was further adjusted for variables with P<0.05 upon univariate analysis (basal ganglia lesions, baseline NIHSS score, NIHSS2 scores, mRS score, BI score). The results were expressed as adjusted odds ratios (OR) with the corresponding 95% confidence intervals (CI). In addition, a receiver operating characteristic (ROC) curve analysis was used to identify the cutoff point on the RDW levels on admission with the greatest sensitivity and specificity to predict PSD at the 3-month follow-up. The area under the curve (AUC) of RDW levels was calculated as a measurement of the test’s accuracy. Statistical significance was considered as P<0.05.
Results
A total of 611 patients with AIS at the First Affiliated Hospital of Anhui University of Science and Technology between June 2018 and July 2021 were admitted in the study. Ultimately, 494 patients were eligible for the study, excluding 28 cases with a final diagnosis of TIA, 7 cases with pre-onset diagnosis of depression, 13 cases with severe aphasia who were unable to complete the examination, 6 cases who were taking antidepressants drug before stroke onset, 9 cases with history of dementia, 6 cases with history of tumors, 9 cases with active infection history 2 weeks before stroke onset, 11 cases with blood system diseases, and 28 cases with incomplete data due to missed visits or withdrawal.
By the time of follow-up, at 3 months after stroke, 2.63% (n=13) of patients had died, 2.83% (n=14) of patients declined the invitation to participate, and 10.73% (n=53) of patients were lost to follow-up, leaving 414 participants (Figure 1). Of all patients followed up, 179 (43.24%) were female, with a mean age of (66.23 ± 8.43) years. Overall, the number of patients who were diagnosed with depression at the 3-month follow-up was 95 (22.95%). The basic characteristics of the 414 patients with and without PSD were presented in Table 1. There were no significant difference in age, gender, educational level, marital status, vascular risk factors (hypertension, diabetes mellitus, coronary heart disease, atrial fibrillation, current smoking, alcohol consumption, prior stroke), stroke location (frontal lobe, parietal lobe, temporal lobe, occipital lobe, brainstem, cerebellum), laboratory index (white blood cell count, platelet, blood glucose, blood lipid, homocysteine) and neuropsychological function (MMSE score) between the two groups (P>0.05, Table 1). Compared with non-PSD, PSD patients had higher NIHSS1 scores (P<0.001), NIHSS2 scores (P<0.001), higher mRS scores (P<0.001), lower BI scores (P<0.001), and higher RDW levels (P<0.001). Moreover, among lesion locations, the basal ganglia (P=0.012, Table 1) demonstrated a notable association with the risk of PSD. Correlation analyses revealed that NIHISS1 scores on the first day after admission were positively correlated with the HAMD scores 90 days after admission in all patients (r=0.293, P <0.001), and NIHISS2 scores were also positively correlated with HAMD scores 90 days after admission in all patients (r=0.329, P<0.001).
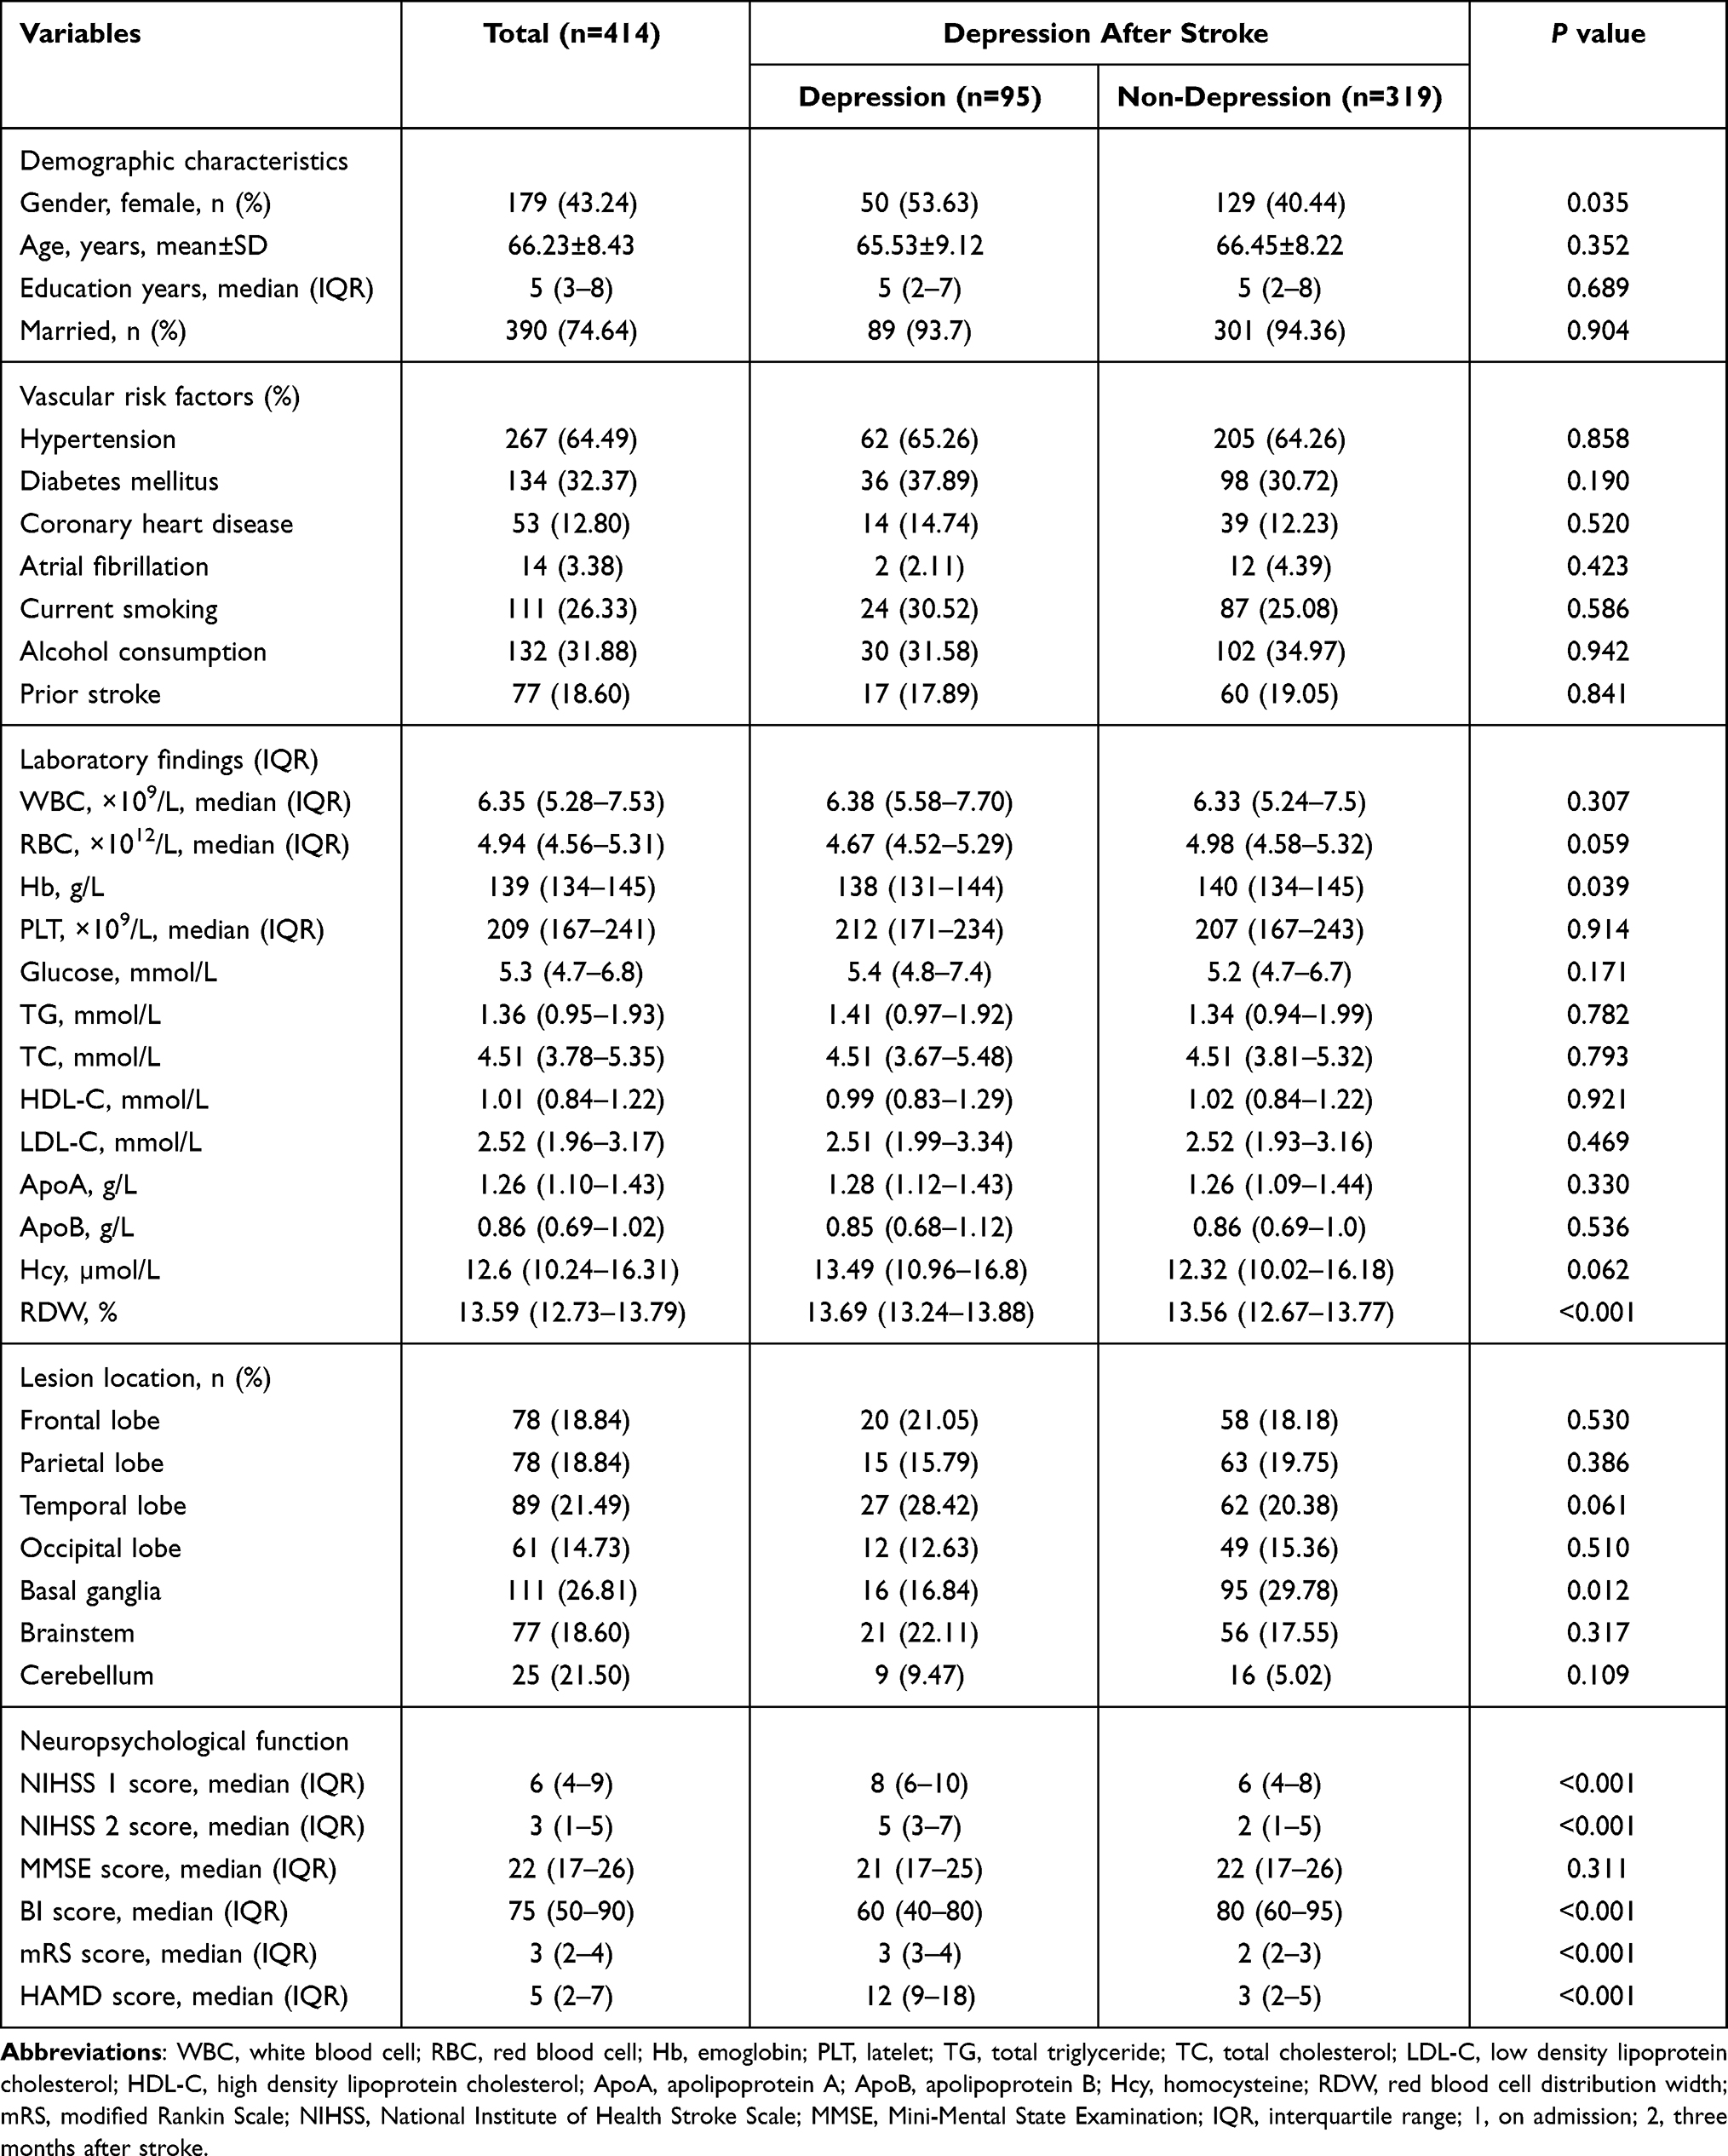 |
Table 1 Clinical and Demographic Characteristics of Patients with PSD and Non-PSD |
In addition, there was a significantly positive correlation between HAMD scores and mRS scores (r=0.258, P<0.0001). There was a negative correlation between HAMD scores and Bl scores (r=−0.247, P<0.0001).
Baseline clinical characteristics of the study population stratified by the RDW tertile were shown in Table 2. Ascending tertiles of RDW were associated with basal ganglia (P = 0.001), NIHSS1 score (P = 0.023), NIHSS2 score (P = 0.008), and mRS score (P=0.034). There were significant differences between the PSD and non-PSD groups in RDW tertiles of patients (χ2=23.47, P < 0.001). Indeed, the percentage of patients in the lowest tertile (10.96–12.70) was significantly lower in the PSD group, while the percentage of patients in the highest tertile (13.75–14.65) was notably higher in the PSD group. The numbers of patients with depression after stroke were 13 (13.68%), 36 (37.89%) and 46 (48.42%) in Tertile 1, Tertile 2 and Tertile 3, respectively (Table 3).
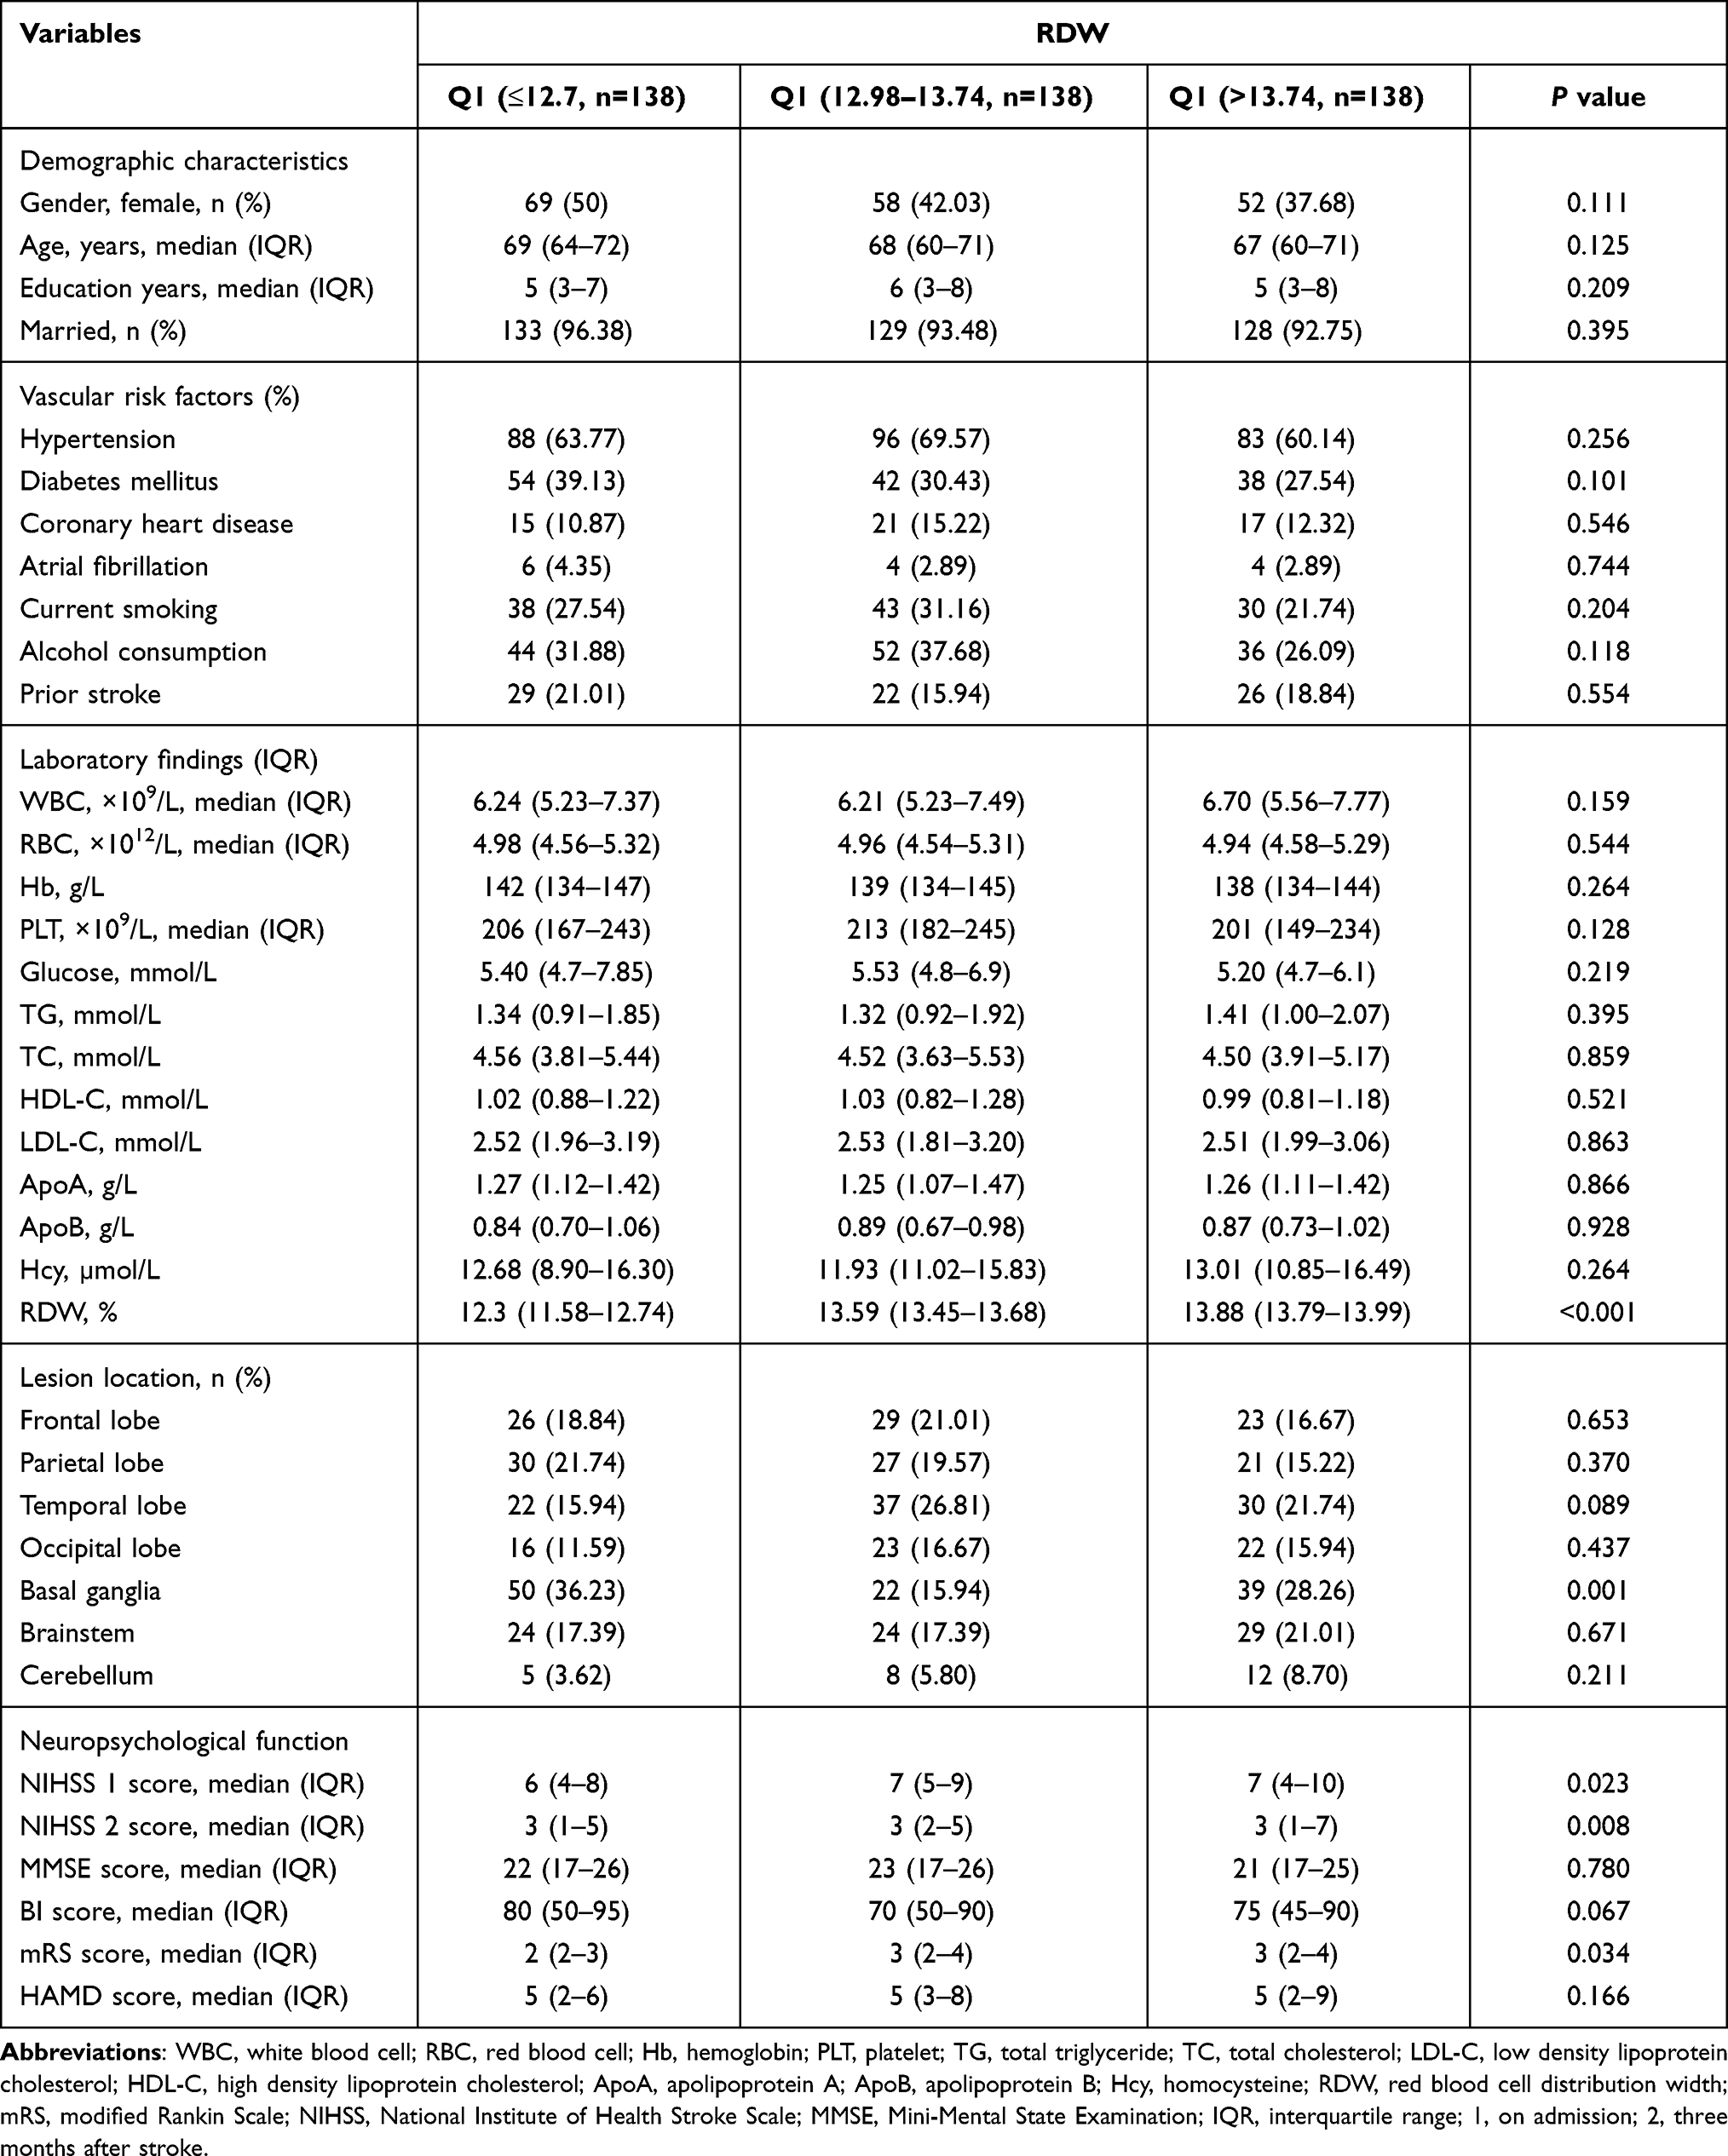 |
Table 2 Baseline Characteristics of Patients with Acute Ischemic Stroke According to RDW Tertiles |
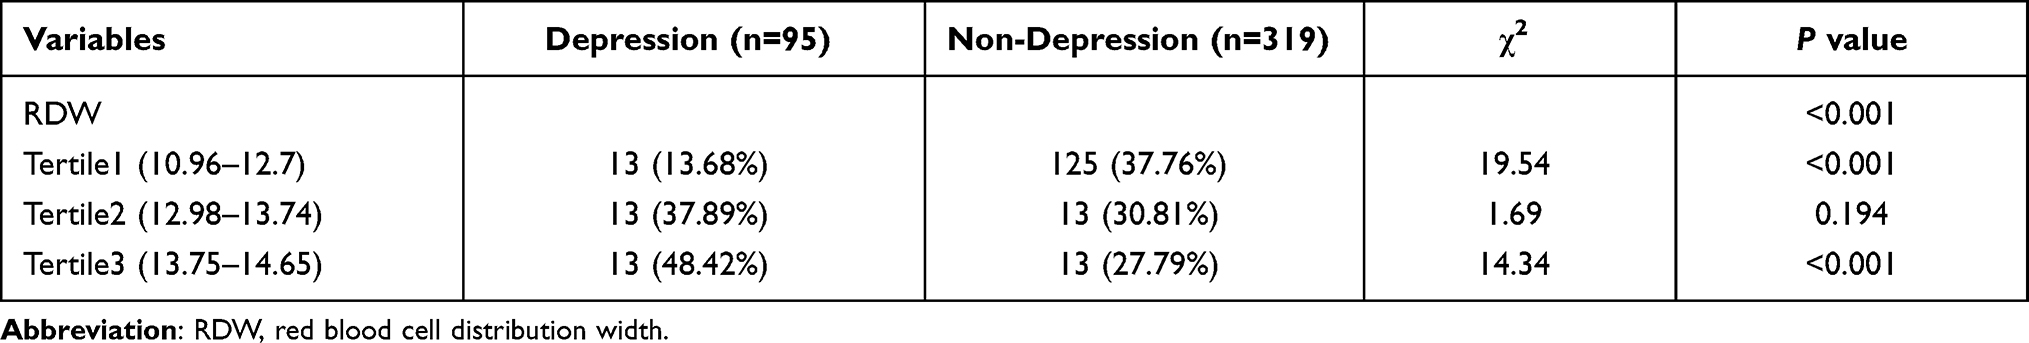 |
Table 3 RDW Tertiles of Patients |
In Table 4, all patients were considered as a whole, and the incidence of PSD was used as a dependent variable. In multivariate regression analysis, when RDW levels were categorized into tertiles, patients in the highest tertile had elevated risk of PSD compared to patients in the lower tertile (non-adjusted: OR 4.808, 95% CI 2.455–9.414, P < 0.001). And after adjusting for confounders including age, sex, education years, married, vascular risk factors (hypertension, diabetes mellitus, coronary heart disease, atrial fibrillation, current smoking, alcohol consumption, prior stroke), baseline NIHSS1 scores, BI score, NIHSS2 scores, basal ganglia lesions, and modified Rankin Scale scores, the highest tertile of RDW was independently associated with the prevalence of PSD (model 1: OR = 5.398, 95% CI =2.713–10.738, P < 0.001; model 2: OR = 6.069, 95% CI = 2.998–12.286, P < 0.001; model 3: OR = 5.707, 95% CI = 2.717–11.989, P < 0.001).
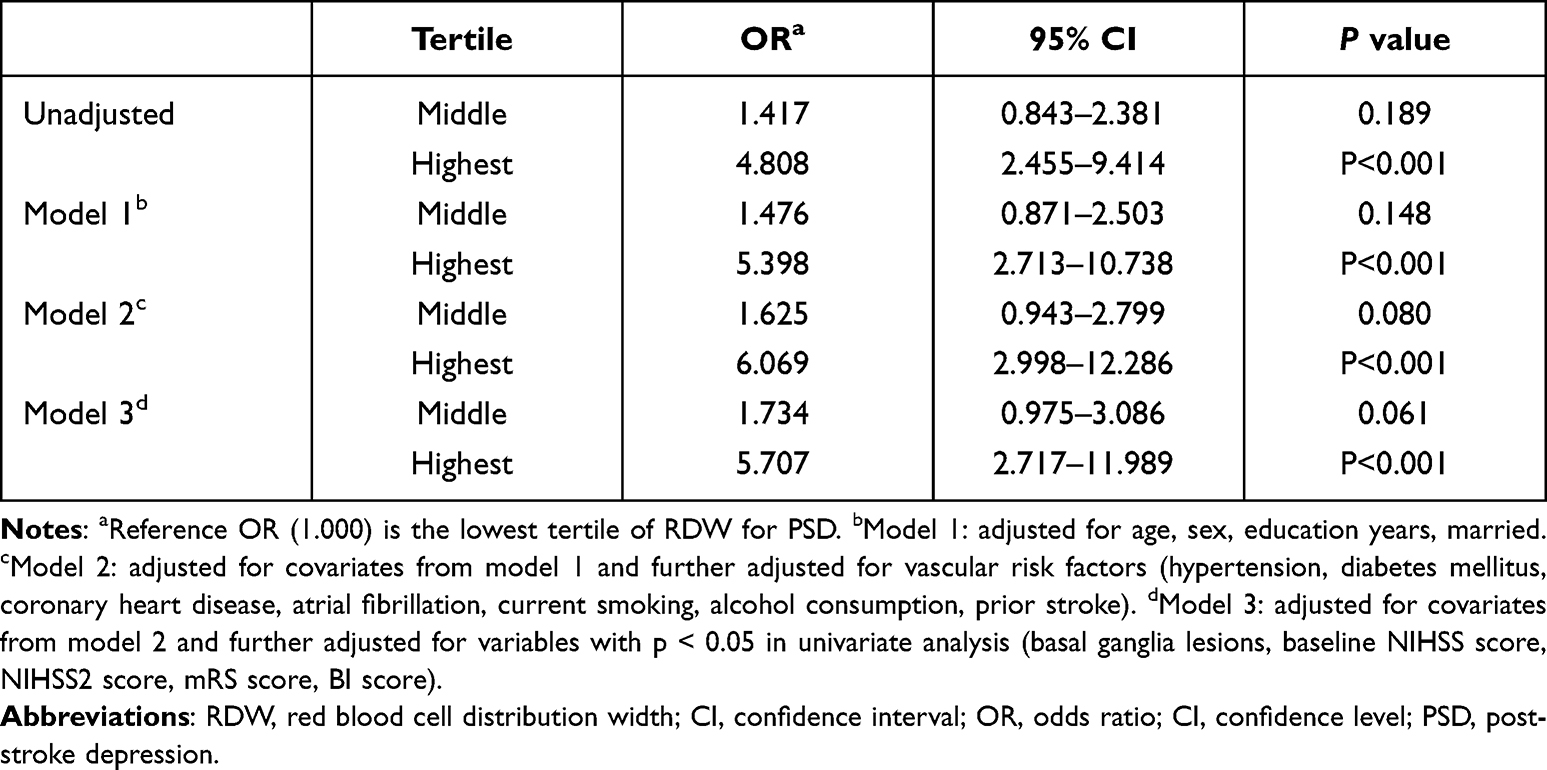 |
Table 4 Multivariate Logistic Regression Analysis Model of RDW and PSD |
According to the ROC curve, the optimal cutoff of RDW levels as an indicator for the prediction of PSD was projected to be 13.01, which yielded a sensitivity of 83% and a specificity of 41.0%, with an AUC of 0.643 (95% CI, 0.585–0.701; P = 0.012, Figure 2).
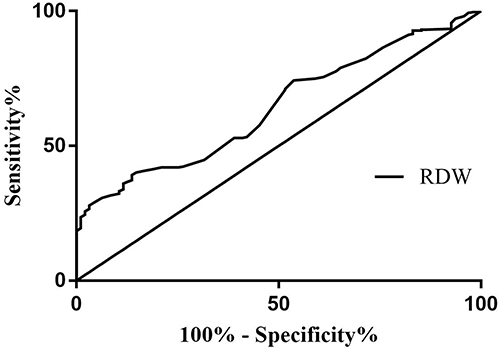 |
Figure 2 ROC curves for predicting of PSD. Receiver operator characteristic curve demonstrating sensitivity as a function of 100%–specificity% for predicting PSD within 3 months based on the RDW levels in stroke patients. Area under the curve 0.643 (95% CI, 0.585–0.701; P = 0.012) for RDW. Abbreviations: RDW, red blood cell distribution width; CI, confidence interval. |
Discussion
As far as we know, this is the first report exploring the prospective association between RDW levels and the development of PSD. Our results indicated high levels of RDW at admission were significantly correlated with depression at 3 months after stroke and documented a 5.707-fold higher risk of PSD among individuals with the highest tertiles of RDW compared with those with the lowest tertiles of RDW after adjustment for potential confounders. Therefore, our findings have shown that the RDW levels could provide the vital predictive information for patients with PSD.
During the current study, we found that 22.95% of patients developed depression 3 months after stroke, which was similar to previous studies.26,27 The diagnosis of PSD is a dynamic process, and different time points have a significant impact on the prevalence of PSD in different studies, which may be related to the timing of PSD determination, discrepancies in design, psychological assessment methods, and different criteria for evaluation. Our results also showed that stroke severity and functional outcome were risk factors for the development of PSD, which was broadly consistent with the previous studies.28,29
Several studies have found that the specific location of the lesion could influence the etiology of PSD: that is, PSD is more likely to occur when the lesions are adjacent basal nuclei or the located in the left frontal region.30 We documented the location of the basal ganglia lesions in relation to the presence of patients with PSD. Consistently, Farner and Gong et al had demonstrated a close relationship between basal ganglia lesions and affective symptoms, including depression.31,32 Although numerous studies have demonstrated a possible relationship between stroke localization and depression after stroke, the issue remains controversial.
Although the mechanisms for the association between RDW and PSD remained largely unclear, some possible explanations should be considered. First, the study by Montagnana et al demonstrated that oxidative stress and inflammation were important determinants of RDW.32 And Marinkovic and Li et al reported that oxidative stress and inflammation were strongly associated with decreased erythrocyte lifespan and inhibited erythropoiesis, respectively, which could increase RDW levels.33,34 Furthermore, the elevated RDW was associated with increased oxidative stress. Elevated RDW might reflect high oxidative stress and low antioxidant levels, and oxidative stress could contribute to erythrocyte membrane damage, increase in erythrocyte fragility, and decrease in the rate of erythroid maturation and the lifespan of erythroid.35
A second explanation was that oxidative stress had a significant role in the etiology of atherosclerosis and could lead to increased RDW by affecting the lifespan of hematopoietic stem cells and red blood cells.36 The overproduction of reactive oxygen could contribute to oxidative stress in the brain and neurons after stroke, which eventually may lead to oxidative damage to lipid peroxidation and DNA, as well as nitrosative damage to proteins.37 In specific brain regions (such as the limbic system), mitochondrial dysfunction and mitochondrial DNA damage could be disrupted by oxidative stress, which is one of the pathological mechanisms of major depression.38,39 The study by May et al reported an association between an elevated level of RDW and a subsequent diagnosis of depression, although this association persisted after adjustment for risk factors, medications, and other indicators of disease status.40
Last but not the least, the inflammatory response is known to play a significant role in ischemic stroke. Once AIS occurs, the organism induces a systemic inflammatory response and increases the levels of RDW and CRP in AIS patients.41 Previous reports have investigated the correlation between high RDW and elevated indices of inflammation, such as C-reactive protein (CRP).42 Kowalska et al found that higher levels of CRP are associated with greater depressive symptoms after stroke.43 A meta-analysis of previous prospective and retrospective studies showed that higher level of CRP in the acute phase of stroke suggested an increased risk for PSD.11 Inflammation is conducive to dysfunction of synaptic plasticity and ultimately depression by mediating alterations in neurotransmitters, particularly the synthesis and metabolism of 5-hydroxytryptamine and glutamine.44 RDW not only reflects the inflammatory state after stroke but also suggests a causal factor for the development of depression. Therefore, increasing RDW may be considered a high level of inflammation that most likely contributes to the occurrence of depression after stroke.
This study had several limitations regarding interpretation of its results. First, the RDW levels were only detected within 24 hours of admission, which restricted dynamic investigation of the relationship between the variation of RDW levels over time after stroke with PSD. Second, patients with severe aphasia, severe stroke conditions, and other central nervous system diseases were removed, which may have resulted in underestimation of the actual prevalence of PSD and contributed some bias to the results. Finally, this is a single-center–based prospective study. Although a relatively large sample size may reduce selection bias, future large-scale multicenter studies are necessary to support our findings and contribute to generalizability.
Conclusion
Our study reveals a significant association between higher RDW levels within 24 hours of admission and development of PSD at 3 months after stroke. RDW measured within 24 hours of admission can be used as a potential diagnostic biomarker for the prediction of PSD. Further prospective studies are essential to explore whether the treatment to reduce RDW offers a potential preventive or therapeutic target for PSD.
Funding
This work was supported by the Huainan Key Scientific Research Project (2018A369) and Natural Science Foundation of Bengbu Medical College (BYKY2019316ZD).
Disclosure
The authors report no conflicts of interest in this work.
References
1. Benjamin Emelia J, Muntner P, Alonso A, et al. Heart disease and stroke statistics-2019 update: a report from the American Heart Association. Circulation. 2019;139:e56–e528. doi:10.1161/CIR.0000000000000659
2. Das J, Rajanikant GK. Post stroke depression: the sequelae of cerebral stroke. Neurosci Biobehav Rev. 2018;90:104–114. doi:10.1016/j.neubiorev.2018.04.005
3. Bartoli F, Di Brita C, Crocamo C, et al. Early post-stroke depression and mortality: meta-analysis and meta-regression. Front Psychiatry. 2018;9:530. doi:10.3389/fpsyt.2018.00530
4. Ayerbe L, Ayis S, Wolfe Charles DA, et al. Natural history, predictors and outcomes of depression after stroke: systematic review and meta-analysis. Br J Psychiatry. 2013;202:14–21. doi:10.1192/bjp.bp.111.107664
5. Villa RF, Federica F, Moretti A, et al. Post-stroke depression: mechanisms and pharmacological treatment. Pharmacol Ther. 2018;184:131–144. doi:10.1016/j.pharmthera.2017.11.005
6. Liegey JS, Sagnier S, Debruxelles S, et al. Influence of inflammatory status in the acute phase of stroke on post-stroke depression. Rev Neurol. 2021;177:941–946. doi:10.1016/j.neurol.2020.11.005
7. Zhang Y, Haijie H, Liu C, et al. Serum pentraxin 3 as a biomarker for prognosis of acute minor stroke due to large artery atherosclerosis. Brain Behav. 2021;11:e01956. doi:10.1002/brb3.1956
8. Hao Y, Ding J, Hong R, et al. Increased interleukin-18 level contributes to the development and severity of ischemic stroke. Aging. 2019;11:7457–7472. doi:10.18632/aging.102253
9. Coveney S, Murphy S, Belton O, et al. Inflammatory cytokines, high-sensitivity C-reactive protein, and risk of one-year vascular events, death, and poor functional outcome after stroke and transient ischemic attack. Int J Stroke. 2021;17(2):163–171. doi:10.1177/1747493021995595
10. Wang X, Fang C, Liu X, et al. High serum levels of iNOS and MIP-1α are associated with post-stroke depression. Neuropsychiatr Dis Treat. 2021;17:2481–2487. doi:10.2147/NDT.S320072
11. Yu Y, Zhu L, Zhang B, et al. Higher levels of C-reactive protein in the acute phase of stroke indicate an increased risk for post-stroke depression: a systematic review and meta-analysis. Neurosci Biobehav Rev. 2021;134:104309. doi:10.1016/j.neubiorev.2021.08.018
12. Hu J, Wang L, Fan K, et al. The association between systemic inflammatory markers and post-stroke depression: a prospective stroke cohort. Clin Interv Aging. 2021;16:1231–1239. doi:10.2147/CIA.S314131
13. Yang L, Zhang Z, Sun D, et al. The serum interleukin-18 is a potential marker for development of post-stroke depression. Neurol Res. 2010;32:340–346. doi:10.1179/016164110X12656393665080
14. Wu D, Zhang G, Zhao C, et al. Interleukin-18 from neurons and microglia mediates depressive behaviors in mice with post-stroke depression. Brain Behav Immun. 2020;88:411–420. doi:10.1016/j.bbi.2020.04.004
15. Ferreira JP, Lamiral Z, Bakris G, et al. Red cell distribution width in patients with diabetes and myocardial infarction: an analysis from the EXAMINE trial. Diabetes Obes Metab. 2021;23:1580–1587. doi:10.1111/dom.14371
16. Fan H, Liu X, Li S, et al. High red blood cell distribution width levels could increase the risk of hemorrhagic transformation after intravenous thrombolysis in acute ischemic stroke patients. Aging. 2021;13:20762–20773. doi:10.18632/aging.203465
17. Kim J, Dae KY, Song T-J, et al. Red blood cell distribution width is associated with poor clinical outcome in acute cerebral infarction. Thromb Haemost. 2012;108:349–356. doi:10.1160/TH12-03-0165
18. Kim DY, Hong DY, Kim SY, et al. Prognostic value of red blood cell distribution width in predicting 3-month functional outcome of patients undergoing thrombolysis treatment for acute ischemic stroke. Medicine. 2021;100:e27255. doi:10.1097/MD.0000000000027255
19. Shafiee M, Tayefi M, Hassanian SM, et al. and anxiety symptoms are associated with white blood cell count and red cell distribution width: a sex-stratified analysis in a population-based study. Psychoneuroendocrinology. 2017;84:101–108. doi:10.1016/j.psyneuen.2017.06.021
20. Demircan F, Gözel N, Kılınç F, et al. The impact of red blood cell distribution width and neutrophil/lymphocyte ratio on the diagnosis of major depressive disorder. Neurol Ther. 2016;5:27–33. doi:10.1007/s40120-015-0039-8
21. Brott T, Adams HP, Olinger CP, et al. Measurements of acute cerebral infarction: a clinical examination scale. Stroke. 1989;20:864–870. doi:10.1161/01.STR.20.7.864
22. Bonita R, Beaglehole R. Modification of Rankin scale: recovery of motor function after stroke. Stroke. 1989;19:1497–1500. doi:10.1161/01.STR.19.12.1497
23. Mahorney F. Functional evaluation: the Barthel index. Md State Med J. 1965;14:61–65.
24. Ridha B, Rossor M. The mini mental state examination. Pract Neurol. 2010;5:298–303. doi:10.1111/j.1474-7766.2005.00333.x
25. Hamilton M. A rating scale for depression. J Neurol Neurosurg Psychiatry. 1960;23:56–62. doi:10.1136/jnnp.23.1.56
26. Hu J, Zhou W, Zhiming Z, et al. miR-22 and cerebral microbleeds in brainstem and deep area are associated with depression one month after ischemic stroke. Braz J Med Biol Res. 2020;53:e9162. doi:10.1590/1414-431x20209162
27. Zhao H, Menghui M, Miao C, et al. Association of serum biomarker neurofilament light concentration with post-stroke depression: a preliminary study. Gen Hosp Psychiatry. 2020;64:17–25. doi:10.1016/j.genhosppsych.2020.01.006
28. Lu X, Duan J, Cheng Q, et al. The association between serum growth differentiation factor-15 and 3-month depression after acute ischemic stroke. J Affect Disord. 2020;260:695–702. doi:10.1016/j.jad.2019.09.037
29. Huang G, Chen H, Wang Q, et al. High platelet-to-lymphocyte ratio are associated with post-stroke depression. J Affect Disord. 2019;246:105–111. doi:10.1016/j.jad.2018.12.012
30. Farner L, Wagle J, Engedal K, et al. Depressive symptoms in stroke patients: a 13 month follow-up study of patients referred to a rehabilitation unit. J Affect Disord. 2010;127:211–218. doi:10.1016/j.jad.2010.05.025
31. Gong X, Lu Z, Feng X, et al. Elevated neutrophil-to-lymphocyte ratio predicts depression after intracerebral hemorrhage. Neuropsychiatr Dis Treat. 2020;16:2153–2159. doi:10.2147/NDT.S269210
32. Montagnana M, Cervellin G, Meschi T, et al. The role of red blood cell distribution width in cardiovascular and thrombotic disorders. Clin Chem Lab Med. 2011;50:635–641. doi:10.1515/cclm.2011.831
33. Li N, Zhou H, Tang Q, et al. Red blood cell distribution width: a novel predictive indicator for cardiovascular and cerebrovascular diseases. Dis Markers. 2017;2017:7089493. doi:10.1155/2017/7089493
34. Marinkovic D, Zhang X, Yalcin S, et al. Foxo3 is required for the regulation of oxidative stress in erythropoiesis. J Clin Invest. 2007;117:2133–2144. doi:10.1172/JCI31807
35. Semba Richard D, Patel Kushang V, Ferrucci L, et al. Serum antioxidants and inflammation predict red cell distribution width in older women: the Women’s Health and Aging Study I. Clin Nutr. 2010;29:600–604. doi:10.1016/j.clnu.2010.03.001
36. Da Silva Garrote-Filho M, Bernardino-Neto M, Penha-Silva N, et al. Influence of erythrocyte membrane stability in atherosclerosis. Curr Atheroscler Rep. 2017;19:17. doi:10.1007/s11883-017-0653-2
37. Maes M, Galecki P, Chang Yong S, et al. A review on the oxidative and nitrosative stress (O&NS) pathways in major depression and their possible contribution to the (neuro) degenerative processes in that illness. Prog Neuropsychopharmacol Biol Psychiatry. 2011;35:676–692.
38. Nabavi SF, Dean Olivia M, Turner A, Sureda A, Daglia M, Nabavi SM. Oxidative stress and post-stroke depression: possible therapeutic role of polyphenols? Curr Med Chem. 2015;22:343–351.
39. Bensimon K, Herrmann N, Swardfager W, et al. Kynurenine and depressive symptoms in a poststroke population. Neuropsychiatr Dis Treat. 2014;10:1827–1835. doi:10.2147/NDT.S65740
40. May HT, Anderson JL, Muhlestein JB, et al. Red cell distribution width and depression among patients undergoing angiography. Circulation. 2013;128:A11979–A11979.
41. Pinho J, Marques SA, Freitas E, et al. Red cell distribution width as a predictor of 1-year survival in ischemic stroke patients treated with intravenous thrombolysis. Thromb Res. 2018;164:4–8. doi:10.1016/j.thromres.2018.02.002
42. Förhécz Z, Gombos T, Borgulya G, et al. Red cell distribution width in heart failure: prediction of clinical events and relationship with markers of ineffective erythropoiesis, inflammation, renal function, and nutritional state. Am Heart J. 2009;158:659–666. doi:10.1016/j.ahj.2009.07.024
43. Kowalska K, Pasinska P, Klimiec-Moskal E, et al. C-reactive protein and post-stroke depressive symptoms. Sci Rep. 2020;10:1431. doi:10.1038/s41598-020-58478-6
44. Müller N, Schwarz MJ. The immune-mediated alteration of serotonin and glutamate: towards an integrated view of depression. Mol Psychiatry. 2007;12:988–1000. doi:10.1038/sj.mp.4002006
 © 2022 The Author(s). This work is published and licensed by Dove Medical Press Limited. The
full terms of this license are available at https://www.dovepress.com/terms
and incorporate the Creative Commons Attribution
- Non Commercial (unported, 3.0) License.
By accessing the work you hereby accept the Terms. Non-commercial uses of the work are permitted
without any further permission from Dove Medical Press Limited, provided the work is properly
attributed. For permission for commercial use of this work, please see paragraphs 4.2 and 5 of our Terms.
© 2022 The Author(s). This work is published and licensed by Dove Medical Press Limited. The
full terms of this license are available at https://www.dovepress.com/terms
and incorporate the Creative Commons Attribution
- Non Commercial (unported, 3.0) License.
By accessing the work you hereby accept the Terms. Non-commercial uses of the work are permitted
without any further permission from Dove Medical Press Limited, provided the work is properly
attributed. For permission for commercial use of this work, please see paragraphs 4.2 and 5 of our Terms.