Back to Journals » Journal of Inflammation Research » Volume 18
Elevated ITGAV Expression in Seropositive Rheumatoid Arthritis: Diagnostic Potential and Immunopathological Insights
Authors Shan Y ![]() , Zhao J
, Zhao J ![]() , Li Y, Zheng Y, Shi Y, Zhao F
, Li Y, Zheng Y, Shi Y, Zhao F ![]() , Cheng Y, Song C, Chang C, Hu H, He D
, Cheng Y, Song C, Chang C, Hu H, He D
Received 18 May 2025
Accepted for publication 9 November 2025
Published 19 November 2025 Volume 2025:18 Pages 16111—16121
DOI https://doi.org/10.2147/JIR.S540469
Checked for plagiarism Yes
Review by Single anonymous peer review
Peer reviewer comments 2
Editor who approved publication: Dr Ujjwol Risal
Yu Shan,1– 3,* Jianan Zhao,1– 3,* Yunshen Li,1– 3,* Yixin Zheng,1– 3 Yiming Shi,1– 3 Fuyu Zhao,1– 3 Yaxin Cheng,1– 3 ChenYang Song,1– 3 Cen Chang,1– 3 Hongliang Hu,1 Dongyi He1– 3
1Department of Rheumatology, Guanghua Hospital Affiliated to Shanghai University of Traditional Chinese Medicine, Shanghai, People’s Republic of China; 2Guanghua Clinical Medical College, Shanghai University of Traditional Chinese Medicine, Shanghai, People’s Republic of China; 3The Research Institute for Joint Diseases, Shanghai Academy of Traditional Chinese Medicine, Shanghai, People’s Republic of China
*These authors contributed equally to this work
Correspondence: Dongyi He, Department of Rheumatology Guanghua Hospital Affiliated to Shanghai University of Traditional Chinese Medicine, Shanghai, People’s Republic of China, Email [email protected] Hongliang Hu, Department of Rheumatology Guanghua Hospital Affiliated to Shanghai University of Traditional Chinese Medicine, Shanghai, People’s Republic of China, Email [email protected]
Objective: Rheumatoid arthritis (RA) is a chronic autoimmune disease characterized by synovial inflammation and joint destruction. Despite advances in treatment, reliable biomarkers for early diagnosis remain elusive. This study investigates the expression of integrin alpha V (ITGAV) as a potential diagnostic biomarker in RA.
Methods: Peripheral blood samples were collected from patients with RA, osteoarthritis (OA), and healthy controls (HC). ITGAV expression was quantified by ELISA, and its correlation with clinical parameters—including serological markers, musculoskeletal ultrasound scores, and disease activity indices—was assessed. Transcriptomic datasets and single-cell RNA sequencing were analyzed to explore ITGAV expression in immune cell subsets. ROC curve analyses were conducted to evaluate its diagnostic performance.
Results: ITGAV levels were significantly elevated in the peripheral blood of RA patients, particularly in those seropositive for both rheumatoid factor (RF) and anti-cyclic citrullinated peptide (anti-CCP) antibodies. ITGAV expression correlated positively with RF and CCP titres but showed no significant association with erythrocyte sedimentation rate (ESR), C-reactive protein (CRP), tender joint count (TJC) or swollen joint count (SJC). Single-cell transcriptomic analyses revealed ITGAV enrichment in pro-inflammatory macrophages and T cells. Moreover, ITGAV levels were positively associated with ultrasound-assessed synovial thickness. ROC analyses demonstrated high diagnostic accuracy, with AUCs exceeding 0.96 after multivariate adjustment.
Conclusion: ITGAV is significantly upregulated in seropositive RA and exhibits potential as a non-invasive biomarker for disease diagnosis and stratification. Its preferential expression in inflammatory immune cell subsets and association with subclinical synovial inflammation highlight its promise as both a diagnostic and mechanistic target in RA. Future longitudinal and functional studies are warranted to validate its role in personalized disease management.
Keywords: ITGAV, rheumatoid arthritis, peripheral blood, macrophages, biomarker
Introduction
Rheumatoid arthritis (RA) is a chronic autoimmune disorder primarily characterized by persistent synovitis, progressive joint destruction, and systemic inflammation.1,2 Common clinical manifestations include joint swelling and tenderness, prolonged morning stiffness, fatigue, and subcutaneous rheumatoid nodules.3,4 The global prevalence of RA is estimated at 0.5%–1%, with women being affected two to three times more frequently than men.5,6 The pathogenesis of RA remains incompletely elucidated, characterized by a multifactorial interplay among genetic predisposition, environmental stimuli, and immune system perturbation.7,8 These interactions culminate in the overproduction of pro-inflammatory cytokines—including TNF-α, IL-6, and IL-17—the generation of autoantibodies such as rheumatoid factor (RF) and anti-cyclic citrullinated peptide (anti-CCP) antibodies, and pathological activation of synovial fibroblasts.9,10 Genetic predisposition is estimated to contribute approximately 50–60% to RA susceptibility, with specific HLA-DRB1 alleles—particularly the shared epitope (SE) haplotype—enhancing autoimmune reactivity via aberrant antigen presentation.11,12 Among environmental risk factors, cigarette smoking has been shown to induce protein citrullination, thereby promoting the generation of anti-CCP antibodies.13 Obesity and gut dysbiosis are associated with increased pro-inflammatory cytokine production, likely mediated by lipid metabolic disturbances and impaired mucosal immunity.14
Integrins constitute a family of transmembrane receptor proteins, composed of heterodimeric α and β subunits.15 They are capable of bidirectional transmembrane signal transduction, mediating adhesion-dependent signaling between cells and the extracellular matrix (ECM), as well as between adjacent cells.16 Integrins orchestrate key cellular processes including migration, proliferation, differentiation, and inflammatory signaling.17 Integrin alpha V (ITGAV), also referred to as CD51, is a protein-coding gene mapped to chromosome 2q31, and is abundantly expressed in macrophages, synovial fibroblasts, endothelial cells, and osteoclasts.18–20 Emerging evidence highlights the critical role of integrins in modulating inflammatory responses via the recruitment and retention of leukocytes.21 Elevated expression levels of integrins and their ligands have been documented across various autoimmune diseases.22 In RA, integrin-associated proteins engage with specific ligands to regulate immune processes such as neutrophil trafficking, macrophage phagocytosis, dendritic cell maturation, and T cell apoptosis, ultimately modulating immune responses and inflammation.23–25 By orchestrating interactions between the extracellular matrix and surface receptors, integrins regulate adhesion, motility, and tissue remodeling, thereby facilitating inflammatory cell infiltration and joint repair in RA.24,26
Multiple genetic association studies have indicated a potential correlation between ITGAV polymorphisms and susceptibility to RA, particularly among individuals of Caucasian ancestry.27,28 Emerging evidence suggests that single-nucleotide polymorphisms (SNPs) in ITGAV may correlate with disease severity and specific serological markers in patients with RA. Specifically, the rs3911238 G/C polymorphism has been shown to significantly affect anti-CCP antibody titers, levels of C-reactive protein (CRP), erythrocyte sedimentation rate (ESR), and overall disease activity in RA patients.19 While ITGAV expression is relatively low in most healthy tissues, it is markedly upregulated in osteoclasts, neutrophils, macrophages, and endothelial cells. These cell types are critically involved in bone resorption, inflammatory cascades, and angiogenesis—hallmark pathological features of RA.27,29 Elevated ITGAV expression has also been documented in inflamed synovial tissues from RA patients as well as in experimental arthritis models.20 Additionally, ITGAV ligand levels are upregulated in the synovial fluid of individuals with RA.30 The administration of ITGAV antagonists has been shown to suppress pathological angiogenesis and mitigate joint inflammation in preclinical models of arthritis.31
This study is the first to characterize the peripheral blood expression profile of ITGAV in RA patients and explore its association with clinical parameters. Quantitative assessment of plasma ITGAV concentrations was performed via ELISA in cohorts of RA patients, osteoarthritis patients, and healthy controls. Correlations between ITGAV levels and clinical indicators—such as RF, anti-CCP, ESR, CRP, and ultrasonographic scores—were analyzed, and receiver operating characteristic (ROC) curve analysis was employed to assess its diagnostic potential. This research aims to provide novel insights and potential therapeutic targets for early diagnosis, disease stratification, and personalized treatment of RA, from both molecular and immuno-pathological perspectives.
Materials and Methods
Participants and Information Collection
Participants were recruited from the Guanghua Hospital Precision Medicine Research Cohort (PMRC) at Shanghai University of Traditional Chinese Medicine, with clinical trial number ChiCTR2400083234. The participants in this study mainly comprised RA patients, osteoarthritis (OA) patients, and healthy controls (HC), with the healthy individuals being selected from those undergoing health examinations. The inclusion criteria for the diseases were based on the following standards: the 2010 American College of Rheumatology/European League Against Rheumatism (ACR/EULAR) criteria for RA diagnosis and the 1986 ACR criteria for knee OA diagnosis. Exclusion criteria included patients with two or more concurrent rheumatic diseases, cardiovascular diseases, severe liver or kidney impairment, or a history of malignant tumors. Whole blood samples were collected for subsequent ELISA detection and the basic information and clinical data of all participants were recorded, organized, and analyzed. The study was conducted over a period of 6 months, from May to November 2024, to ensure adequate recruitment and data collection. In addition, we also recorded detailed clinical data for all patients, including gender, age, laboratory test results and disease activity scores. All participants provided informed consent, and the study was approved by the Ethics Committee of Guanghua Hospital (approval number: 2018-K-12). This study adhered to the Declaration of Helsinki.
Enzyme-Linked Immunosorbent Assay (ELISA) Quantitative Detection
Peripheral blood was collected from RA patients, OA patients, and healthy individuals, followed by centrifugation at 3000 rpm for 10 minutes to obtain the upper plasma. The samples were categorized into different groups based on disease status and control groups, and the expression level of ITGAV was subsequently measured using ELISA. The ELISA kit was purchased from Shanghai Lian Biological Technology (catalog number: ml038435), and standard wells and sample wells were set up according to the experimental objectives. In an Excel spreadsheet, the standard concentrations were plotted on the x-axis and the corresponding optical density (OD) values on the y-axis, using the blank wells as the zero point. A linear regression curve for the standards was drawn, and the concentrations of each sample were calculated based on the curve equation.
Single Cell Data Analysis
This study performed single-cell RNA sequencing analysis on synovial tissue samples from 9 knee replacement patients, including 3 osteoarthritis (OA) cases, 3 RA cases double-positive for RF/CCP (RA-P: RF-IgM ≥20 IU/mL and ACCP ≥1600 RU/mL), and 3 RA cases double-negative for RF/CCP (RA-N: RF-IgM <20 IU/mL and ACCP <1600 RU/mL). Tissue samples were digested with collagenase, filtered, and processed using the 10x Genomics Chromium platform to construct single-cell libraries, capturing approximately 8,000 cells per library. Paired-end sequencing was conducted on the Illumina platform. Data analysis followed the Seurat pipeline, employing principal component analysis (PCA) and UMAP dimensionality reduction. Cells were clustered into 18 subpopulations using the first 20 principal components (resolution=0.1), annotated with canonical marker genes. Sertoli cell subpopulations were further subdivided into 8 clusters for deeper analysis. The study protocol was approved by the Ethics Committee of Shanghai Guanghua Hospital, with written informed consent from all participants (approval number: 2018-K-12). This work specifically highlighted the expression pattern of ITGAV across cell subpopulations (as illustrated in the Figure 1E).
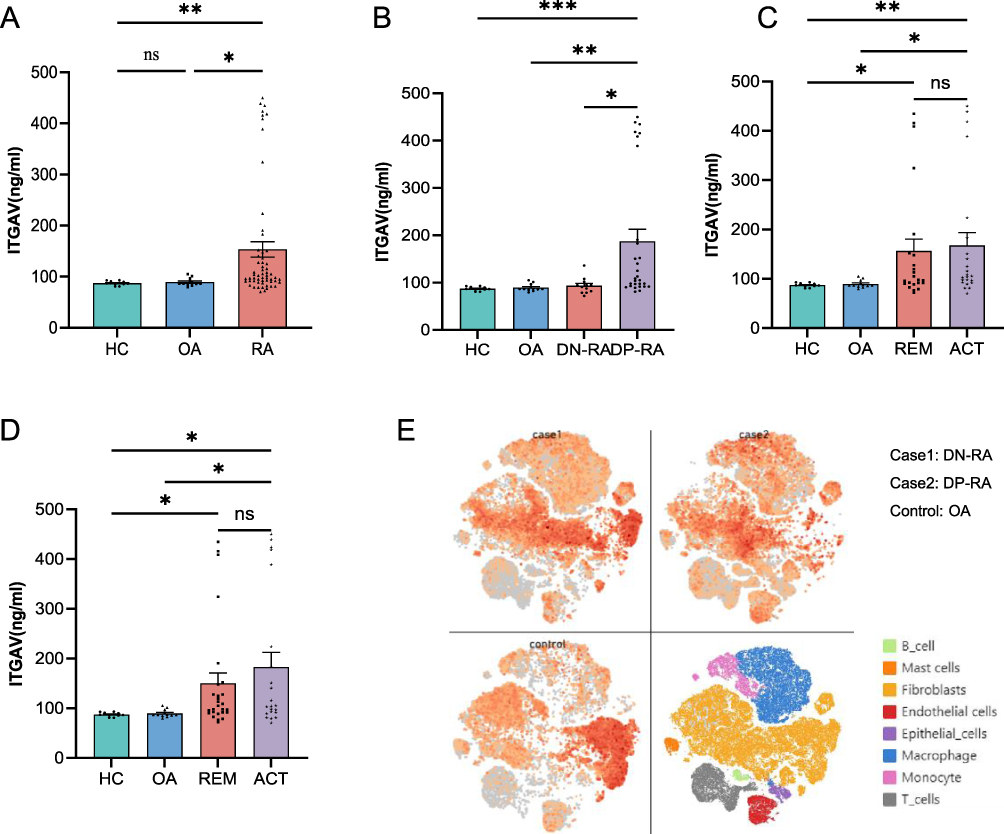 |
Figure 1 Elevated ITGAV expression in patients with RA (A) ITGAV concentrations in peripheral blood were significantly higher in RA patients compared to those with osteoarthritis (OA) and healthy controls (HC), with no significant difference between the OA and HC groups. (B) DP-RA exhibited markedly higher ITGAV levels than DN-RA, OA, and HC groups. (C and D) ITGAV levels were significantly elevated in both ACT and REM RA groups, stratified by DAS28-ESR/CRP, compared to OA and HC groups, with no significant differences observed between ACT and REM groups. (E) Single-cell RNA sequencing revealed higher ITGAV expression in synovial macrophages and T cells from RA patients compared to those from OA patients. (ns:p≥0.05, *p<0.05, **p<0.01, ***p<0.001). |
GEO Dataset Analysis
Transcriptomic datasets (GSE93272, GSE223325, GSE221012) were downloaded from the Gene Expression Omnibus (GEO) using the GEOquery R package. Raw expression data underwent preprocessing as follows: Missing values were imputed via the impute package (k-nearest neighbors algorithm); Batch normalization was performed using the normalizeBetweenArrays function from the limma package to correct technical variability; Probe annotation refinement included removing probes mapping to multiple genes and retaining the probe with the highest signal intensity for genes with multiple probes (collapsed using the aggregate function). Visualize ITGAV gene expression using bar charts.
Statistical Analysis
The raw data was organized to correct any inconsistencies in data entry and formatted for analysis. Before performing statistical analyses, outliers were identified and removed to ensure the robustness of statistical inference. Outliers were defined as ELISA values that exceeded 1.5 times the interquartile range (IQR) above the third quartile or below the first quartile. Data following a normal distribution were expressed as mean±standard deviation and analyzed using Analysis of Variance (ANOVA) for group comparisons. Data not following a normal distribution were presented as medians (Q1, Q3) and compared using the Kruskal–Wallis rank-sum test, with Dunn’s testing for multiple comparisons. The correlation between the levels of ITGAV in peripheral blood and common clinical indicators of RA was assessed using Pearson’s correlation method. The clinical relevance of the levels of ITGAV in peripheral blood was analyzed using Receiver Operating Characteristic (ROC) curves. Statistical significance was defined as P<0.05 or adjusted P<0.05, and results were visualized appropriately. All statistical analyses were conducted using IBM SPSS version 26.0, GraphPad Prism version 10.0, and Sangerbox tools.
Results
The Basic Information of Participants
In this study, a total of 84 participants were included, comprising 60 patients with RA, 12 patients with osteoarthritis (OA), and 12 healthy controls (Table 1). Among the RA patients, there were 4 males and 56 females; among the OA patients, 3 males and 9 females; and among the healthy controls, there were 6 males and 6 females. Since epidemiological studies indicate that the prevalence of RA is significantly higher in females than in males, it is acceptable that the study included more female RA patients than male patients, resulting in differences in the gender ratio among the three groups. Additionally, we collected data on participants’ age, height, weight, erythrocyte sedimentation rate (ESR), and C-reactive protein (CRP). For the primary subjects of the study, the RA patients, we also collected clinical information such as rheumatoid factor (RF), anti-cyclic citrullinated peptide (CCP), tender joint count (TJC), swollen joint count (SJC), disease activity score 28 based on ESR (DAS28-ESR), and disease activity score 28 based on CRP (DAS28-CRP).
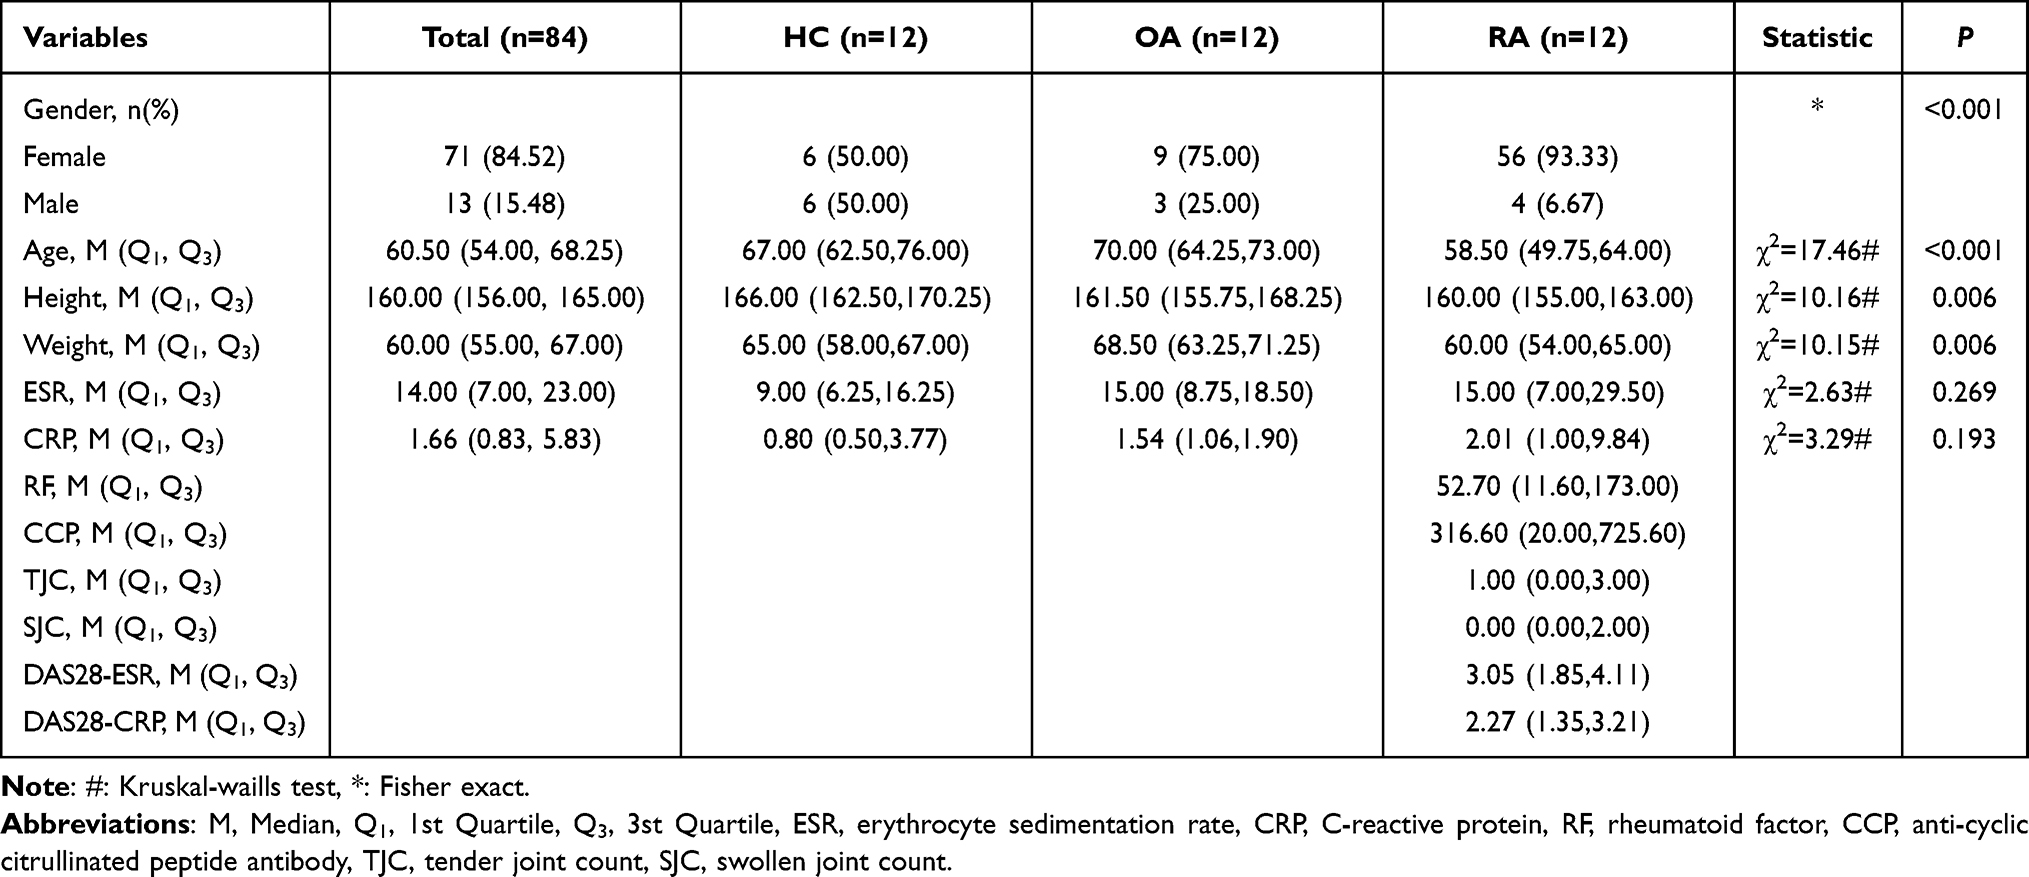 |
Table 1 Basic Clinical Information |
Increased Levels of ITGAV in Peripheral Blood of RA Patients
Analysis of ITGAV levels in peripheral blood revealed that RA patients exhibited significantly elevated ITGAV expression compared to both OA patients and healthy controls (P=0.006 and P=0.019, respectively), while no significant differences were observed between OA patients and healthy controls (P>0.05) (Figure 1A). Given that both OA and HC served as non-RA controls, they were combined into NC control group (n=24). Comparison with the RA group (n=60) revealed that ITGAV expression levels were significantly higher in the RA group (P=0.008). RA patients were subsequently stratified based on RF and CCP serostatus: double-positive RA (DP-RA) was defined by concurrent positivity for both RF and CCP, whereas double-negative RA (DN-RA) referred to patients negative for both markers. Notably, ITGAV expression in peripheral blood was significantly elevated in the DP-RA subgroup compared to DN-RA patients (P=0.026), and also significantly higher than that in both OA and HC groups (P=0.003 and P<0.001, respectively). No significant differences in ITGAV expression were observed among DN-RA, OA, and HC groups (P>0.05) (Figure 1B). These findings imply a potential association between elevated peripheral ITGAV levels and seropositivity for RF and CCP in RA patients.
To further explore the clinical relevance of ITGAV expression, RA patients were categorized into active (ACT; DAS28≥2.6) and remission (REM; DAS28<2.6) groups according to DAS28-ESR or DAS28-CRP scores. In the DAS28-ESR-based subgroup analysis, both ACT and REM groups exhibited significantly higher ITGAV expression compared to OA and HC groups (P<0.05); however, no significant difference was observed between ACT and REM groups (P>0.05) (Figure 1C). A similar trend was observed in the DAS28-CRP-based subgroup analysis, corroborating the consistency of these findings (Figure 1D).
Increased Levels of ITGAV in Macrophages of RA Patients
Preliminary single-cell RNA sequencing of synovial tissue from RA patients conducted by our group revealed significantly elevated ITGAV expression in macrophages and T cells compared to those from OA patients. Both DP-RA and DN-RA subgroups also exhibited higher ITGAV levels relative to OA patients (Figure 1E). Subsequently, we examined publicly available RA-related datasets from the R4RA (https://r4ra.hpc.qmul.ac.uk/) and PEAC (https://peac.hpc.qmul.ac.uk/) databases. In RA patients, ITGAV expression was positively correlated with CD3 (r=0.24, P=0.006) (Figure 2A) and CD68 expression (r=0.19, P=0.033) (Figure 2B). Furthermore, peripheral blood ITGAV levels were positively associated with US ST 12max (a musculoskeletal ultrasound index reflecting synovial thickness or inflammatory activity) in RA patients (r=0.37, P=0.021) (Figure 2C).
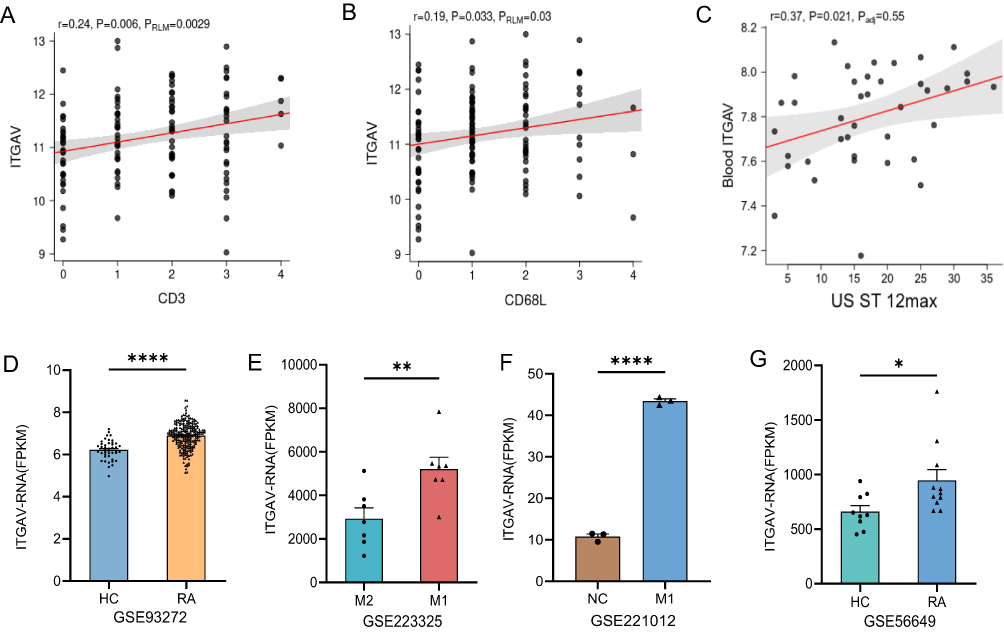 |
Figure 2 Expression characteristics of ITGAV in RA-related immune cell subsets (A and B) In peripheral blood of RA patients, ITGAV levels correlated positively with CD3⁺ T cells and CD68⁺ macrophage markers. (C) ITGAV concentration was positively associated with ultrasound-assessed synovial thickness (US ST 12max). (D–G) Public dataset analyses showed consistently elevated ITGAV mRNA expression: GSE93272 revealed higher ITGAV levels in peripheral blood of RA patients compared to HC; GSE223325 and GSE221012 demonstrated increased ITGAV expression in M1 macrophages; GSE56649 indicated upregulated ITGAV mRNA in CD4⁺ T cells of RA patients versus HC. (*p<0.05, **p<0.01, ****p<0.001). |
We further interrogated the GEO database (https://www.ncbi.nlm.nih.gov/geo/) and identified four datasets-GSE93272, GSE223325, GSE221012, and GSE56649-that are associated with ITGAV mRNA expression in patients with RA. Raw data were extracted from these datasets and subjected to differential expression analysis. In GSE93272, ITGAV mRNA expression in the peripheral blood of RA patients was significantly elevated compared with healthy controls (P<0.001), consistent with our prior findings (Figure 2D). GSE223325, which profiles M1 and M2 macrophages isolated from RA patients, revealed significantly higher ITGAV mRNA expression in M1 macrophages compared with M2 counterparts (P=0.009) (Figure 2E). GSE221012, derived from in vitro cell culture experiments, similarly demonstrated elevated ITGAV mRNA levels in M1 macrophages (P<0.001) (Figure 2F). Additionally, GSE56649, which investigates ITGAV expression in CD4⁺ T cells, showed significantly increased ITGAV mRNA levels in RA patients compared to healthy controls (P=0.029) (Figure 2G).
Correlation of Levels of ITGAV in Peripheral Blood with RA Clinical Indices
To further investigate the association between peripheral blood ITGAV levels and clinical parameters in patients with RA, we collected demographic characteristics (including sex, age, height, and weight) along with other clinical indicators, and conducted correlation analyses (Figure 3A). The results demonstrated that ITGAV levels were positively correlated with sex and age in RA patients (r=0.26, P<0.05; r=0.41, P<0.001, respectively) (Figure 3D). Furthermore, ITGAV levels were significantly positively associated with anti-CCP antibodies and RF (r=0.29, P<0.05; r=0.32, P<0.05, respectively), in agreement with our initial hypothesis (Figure 3B and 3C). However, no significant correlations were observed between ITGAV levels and ESR, CRP, TJC or SJC. Moreover, comorbidity data on interstitial lung disease (ILD) and osteoporosis were collected, yet no significant associations were observed between ITGAV expression and these clinical complications.
 |
Figure 3 Correlation Between ITGAV and Clinical Indices in RA and ROC Curve (A) Correlation Between ITGAV and Clinical Indices in RA. (B–D) Negative correlations between ITGAV with CCP, RF and age. (E and F) ROC curves for diagnostic performance of ITGAV combined with clinical factors (multivariate AUC: 0.968 for RA vs HC; 0.972 for RA vs OA). (*p<0.05, **p<0.01, ***p<0.001, ****p<0.001). |
The Levels of ITGAV in Peripheral Blood Aids in RA Diagnosis
Univariate and multivariate logistic regression analyses were conducted to assess the diagnostic specificity and accuracy of ITGAV levels in RA. In the univariate analysis comparing RA patients with HC, the area under the curve (AUC) was 0.801 (95% CI: 0.701–0.901). In the subsequent multivariate analysis, after adjusting for covariates such as sex, age, height, weight, ESR, CRP, RF, and CCP, the AUC for the RA group increased to 0.968 (95% CI: 0.931–1.000) (Figure 3E). When comparing RA patients with those diagnosed with OA, the univariate analysis yielded an AUC of 0.749 (95% CI: 0.628–0.869). In the multivariate model, the AUC further increased markedly to 0.972 (95% CI: 0.936–1.000) (Figure 3F).
Discussion
Integrins mediate key processes such as leukocyte adhesion and migration, fibroblast activation, and angiogenesis, all of which are crucial for the progression of rheumatoid arthritis. For example, α11β1 integrin has been shown to mediate the adhesion and migration of synovial fibroblasts under inflammatory conditions.32,33 Previous studies have reported that integrin expression is upregulated in RA synovium, promoting immune cell infiltration, destructive signaling, and cytokine secretion.24,34 Our study presents compelling evidence that the expression of ITGAV (also known as CD51) in peripheral blood is markedly elevated in patients with RA, relative to individuals with OA or HCs. Notably, the upregulation of ITGAV is particularly pronounced in rheumatoid arthritis patients who are double-positive for both RF and anti-CCP antibodies. Since RF and anti-CCP are specific markers of RA and are commonly used as diagnostic indicators, this observation is significant. Moreover, patients with double-positive serology tend to exhibit higher disease activity and greater severity.35 This suggests that ITGAV may play an important role in the autoantibody-driven pathogenesis of RA and that its marked upregulation could represent a potential risk factor for the disease. Our data further substantiate this association by demonstrating a positive correlation between peripheral ITGAV expression and serum RF and CCP titres. The elevation of ITGAV in DP-RA patients, relative to DN-RA and OA cohorts, further underscores its potential specificity to the seropositive RA phenotype. This finding is in line with the prevailing notion that RF⁺/CCP⁺ RA represents a more aggressive disease phenotype characterized by heightened inflammatory burden and increased risk of joint destruction.36,37 However, no statistically significant associations were observed between ITGAV levels and markers such as ESR, CRP, TJ or SJC, indicating that ITGAV may serve as a surrogate for immune activation rather than a direct measure of inflammatory burden.
ITGAV expression positively correlates with both age and sex, consistent with prior studies identifying age and sex as established non-modifiable risk factors for rheumatoid arthritis. This further suggests that demographic factors may modulate integrin-associated immune pathways in rheumatoid arthritis.38 This observation warrants further mechanistic investigation to elucidate how hormonal milieu and age-associated immune remodeling may influence ITGAV expression and function. At the single-cell level, integrative analysis of RA-related transcriptomic datasets revealed that ITGAV is predominantly expressed in macrophages and T cells—two pivotal effector cell types orchestrating synovial inflammation. This observation is consistent with previous transcriptomic analyses, which revealed elevated ITGAV expression in synovial tissues and immune cells of patients with rheumatoid arthritis. In RA, integrins such as α4β1 and α5β1 mediate the recruitment of macrophages to the synovium by binding to ECM ligands like fibronectin and VCAM-1.39 This interaction enables macrophages to adhere to endothelial cells and migrate into inflamed tissues. Integrins further activate macrophages, promoting the release of inflammatory cytokines such as TNF-α.40 Studies have shown that in RA synovial fluid, DCs exhibit significantly reduced expression of CD11a (aβ2 integrin subunit), while CD11b expression is markedly increased. This altered integrin expression pattern may affect DC clustering, adhesion, and T cell–activating functions, thereby promoting the inflammatory process.41 Further analyses of macrophage subsets have revealed that ITGAV is preferentially expressed in proinflammatory M1 macrophages. Notably, studies have shown that integrin αDβ2 expression is markedly upregulated on M1 macrophages, enhancing their adhesion to the three-dimensional extracellular matrix while simultaneously reducing migratory capacity.42 These cells also secrete elevated levels of proinflammatory cytokines such as TNF-α, IL-1β, and IL-6. Together, integrin-mediated adhesion and cytokine release contribute to sustained synovial inflammation and promote the progression of rheumatoid arthritis.43
In addition, the correlation between peripheral ITGAV levels and ultrasound-assessed synovial thickness (US ST 12max) further confirms its translational medical significance. Musculoskeletal ultrasound has gained increasing prominence as a non-invasive modality for monitoring disease activity and assessing therapeutic efficacy in RA.44 Studies have shown a significant correlation between ultrasound-assessed synovial thickening, pro-angiogenic gene expression, and vascular density, suggesting that ultrasound can reflect synovial tissue remodeling and immune cell infiltration.45,46 The positive association between ITGAV expression and ultrasound-detected synovial hypertrophy may reflect underlying tissue remodeling and immune cell infiltration, suggesting that ITGAV could serve as a non-invasive biomarker for identifying subclinical disease progression and joint damage risk in seropositive RA. In terms of diagnostic potential, ROC curve analysis demonstrated that ITGAV levels possess substantial discriminative power in distinguishing RA patients from HCs and individuals with OA. The AUC values from univariate analyses were 0.801 and 0.749, respectively, which improved markedly to 0.968 and 0.972 following multivariate adjustment—highlighting the excellent diagnostic performance of ITGAV. These findings underscore the potential of ITGAV as a biomarker, capable of complementing existing serological tests, particularly in the early diagnosis of rheumatoid arthritis or in cases where conventional markers yield negative results. However, several limitations should be noted. Firstly, the relatively small sample size, particularly in the osteoarthritis and healthy control groups, may limit the statistical power of the analysis. Additionally, the cross-sectional study design precludes the assessment of dynamic changes in ITGAV expression over time, as well as its predictive value in disease progression and treatment response. Finally, while a strong correlation with serological markers has been observed, the precise role of ITGAV in immune regulation and rheumatoid arthritis-related joint pathology warrants further elucidation through both in vivo and in vitro studies.
Conclusion
In summary, our findings reveal that ITGAV expression is significantly upregulated in RA patients, particularly within seropositive subgroups, and may serve as a clinically relevant biomarker for disease diagnosis and stratification. Its preferential expression in pro-inflammatory immune cell populations, alongside its correlation with key indicators of synovial inflammation, provides a mechanistic foundation for exploring ITGAV as a potential therapeutic target. Future longitudinal studies and mechanistic investigations are warranted to validate its utility in personalized disease monitoring and therapeutic decision-making in RA.
Data Sharing Statement
We support data sharing and have already uploaded the data to the cloud. The data will be shared upon reasonable request to the corresponding authors.
Author Contributions
All authors made a significant contribution to the work reported, whether that is in the conception, study design, execution, acquisition of data, analysis and interpretation, or in all these areas; took part in drafting, revising or critically reviewing the article; gave final approval of the version to be published; have agreed on the journal to which the article has been submitted; and agree to be accountable for all aspects of the work.
Consent to Participate
All the authors listed in this manuscript have participated in the whole writing process of the manuscript and have informed consent to the publication of the manuscript.
Funding
This work was supported by the National Key R&D Program of China (Grant No. 2024YFC3506203), the National Natural Science Foundation of China (82074234 and 82405068), State Administration of Traditional Chinese Medicine, Shanghai Municipal Health Commission, East China Region-based Chinese and Western Medicine Joint Disease Specialist Alliance, and Shanghai He Dongyi Famous Chinese Medicine Studio Construction Project (SHGZS-202220), Shanghai Municipal Health Commission (202340274), 1. Changning District Health Committee youth project(2022QN09), Shanghai Medical Association Pujiang rheumatism plan(SPROG2203), 3. Shanghai Municipal Health Commission youth project(20234Y0273), Shanghai Sailing Program(23YF1436300).
Disclosure
The authors declare that the research was conducted in the absence of any commercial or financial relationships that could be construed as a potential conflict of interest.
References
1. Guo Q, Wang Y, Xu D, Nossent J, Pavlos NJ, Xu J. Rheumatoid arthritis: pathological mechanisms and modern pharmacologic therapies. Bone Res. 2018;6:15. doi:10.1038/s41413-018-0016-9
2. Firestein GS, McInnes IB. Immunopathogenesis of Rheumatoid Arthritis. Immunity. 2017;46(2):183–196. doi:10.1016/j.immuni.2017.02.006
3. Figus FA, Piga M, Azzolin I, McConnell R, Iagnocco A. Rheumatoid arthritis: extra-articular manifestations and comorbidities. Autoimmunity Rev. 2021;20(4):102776. doi:10.1016/j.autrev.2021.102776
4. Conforti A, Di Cola I, Pavlych V, et al. Beyond the joints, the extra-articular manifestations in rheumatoid arthritis. Autoimmunity Rev. 2021;20(2):102735. doi:10.1016/j.autrev.2020.102735
5. Finckh A, Gilbert B, Hodkinson B, et al. Global epidemiology of rheumatoid arthritis. Nat Rev Rheumatol. 2022;18(10):591–602. doi:10.1038/s41584-022-00827-y
6. Almutairi KB, Nossent JC, Preen DB, Keen HI, Inderjeeth CA. The prevalence of rheumatoid arthritis: a systematic review of population-based studies. J Rheumatol. 2021;48(5):669–676. doi:10.3899/jrheum.200367
7. Kronzer VL, Davis JM. 3rd. etiologies of rheumatoid arthritis: update on mucosal, genetic, and cellular pathogenesis. Curr Rheumatol Rep. 2021;23(4):21. doi:10.1007/s11926-021-00993-0
8. Firestein GS. Pathogenesis of rheumatoid arthritis: the intersection of genetics and epigenetics. rans. Am. Clin. Climatol. Assoc. 2018;129:171–182.
9. Kondo N, Kuroda T, Kobayashi D. Cytokine networks in the pathogenesis of rheumatoid arthritis. Int J Mol Sci. 2021;22(20):10922. doi:10.3390/ijms222010922
10. McInnes IB, Schett G. Cytokines in the pathogenesis of rheumatoid arthritis. Nat Rev Immunol. 2007;7(6):429–442. doi:10.1038/nri2094
11. Eyrich NW, Potts CR, Robinson MH, Maximov V, Kenney AM. Reactive oxygen species signaling promotes hypoxia-inducible factor 1α stabilization in sonic hedgehog-driven cerebellar progenitor cell proliferation. Mol Cell Biol. 2019;39(8). doi:10.1128/mcb.00268-18
12. Grossman JM, Gordon R, Ranganath VK, et al. American College of Rheumatology 2010 recommendations for the prevention and treatment of glucocorticoid-induced osteoporosis. Arthritis Care Res. 2010;62(11):1515–1526. doi:10.1002/acr.20295
13. Alsalahy MM, Nasser HS, Hashem MM, Elsayed SM. Effect of tobacco smoking on tissue protein citrullination and disease progression in patients with rheumatoid arthritis. Saudi Pharmaceutical J. 2010;18(2):75–80. doi:10.1016/j.jsps.2010.02.002
14. Gérard P. Gut microbiota and obesity. Cell Mol Life Sci. 2016;73(1):147–162. doi:10.1007/s00018-015-2061-5
15. Pang X, He X, Qiu Z, et al. Targeting integrin pathways: mechanisms and advances in therapy. Signal Transduct. Target. Ther. 2023;8(1):1. doi:10.1038/s41392-022-01259-6
16. Li S, Piao C, Piao C, Liu HL, Liu H-X. Integrin signaling in cancer: bidirectional mechanisms and therapeutic opportunities. Cell Commun. Signal. 2023;21(1):266. doi:10.1186/s12964-023-01264-4
17. Di X, Gao X, Peng L, et al. Cellular mechanotransduction in health and diseases: from molecular mechanism to therapeutic targets. Signal Transduct. Target. Ther. 2023;8(1):282. doi:10.1038/s41392-023-01501-9
18. Loeser H, Scholz M, Fuchs H, et al. Integrin alpha V (ITGAV) expression in esophageal adenocarcinoma is associated with shortened overall-survival. Sci Rep. 2020;10(1):18411. doi:10.1038/s41598-020-75085-7
19. Shakiba E, Tavilani H, Goodarzi MT, Kiani A, Pourmotabbed T, Vaisi-Raygani A. The ITGAV-rs3911238 polymorphism is associated with disease activity in rheumatoid arthritis. Iran J Allergy Asthma Immunol. 2014;13(5):356–363.
20. Zheng L, Gu M, Li X, et al. ITGA5(+) synovial fibroblasts orchestrate proinflammatory niche formation by remodelling the local immune microenvironment in rheumatoid arthritis. Ann Rheumat Dis. 2025;84(2):232–252. doi:10.1136/ard-2024-225778
21. Kourtzelis I, Mitroulis I, von Renesse J, Hajishengallis G, Chavakis T. From leukocyte recruitment to resolution of inflammation: the cardinal role of integrins. J. Leukoc. Biol. 2017;102(3):677–683. doi:10.1189/jlb.3MR0117-024R
22. Mitroulis I, VI A, Kourtzelis I, Ziogas A, Hajishengallis G, Chavakis T. Leukocyte integrins: role in leukocyte recruitment and as therapeutic targets in inflammatory disease. Pharmacol Ther. 2015;147:123–135. doi:10.1016/j.pharmthera.2014.11.008
23. Newbrough SA, Mocsai A, Clemens RA, et al. SLP-76 regulates Fcgamma receptor and integrin signaling in neutrophils. Immunity. 2003;19(5):761–769. doi:10.1016/s1074-7613(03)00305-4
24. Lowin T, Straub RH. Integrins and their ligands in rheumatoid arthritis. Arthritis Res Therapy. 2011;13(5):244. doi:10.1186/ar3464
25. Zhang Y, Wang H. Integrin signalling and function in immune cells. Immunology. 2012;135(4):268–275. doi:10.1111/j.1365-2567.2011.03549.x
26. Chang SK, Gu Z, Brenner MB. Fibroblast-like synoviocytes in inflammatory arthritis pathology: the emerging role of cadherin-11. Immunol Rev. 2010;233(1):256–266. doi:10.1111/j.0105-2896.2009.00854.x
27. Huang JM, Pang ZY, Qi GB, Wang Z, Lv ZT. Association of ITGAV polymorphisms and risk of rheumatoid arthritis: evidence from a meta-analysis. Expert Rev Clin Immunol. 2020;16(6):631–640. doi:10.1080/1744666x.2020.1777098
28. Hollis-Moffatt JE, Rowley KA, Phipps-Green AJ, et al. The ITGAV rs3738919 variant and susceptibility to rheumatoid arthritis in four Caucasian sample sets. Arthritis Res Therapy. 2009;11(5):R152. doi:10.1186/ar2828
29. Ahnert P, Kirsten H. Association of ITGAV supports a role of angiogenesis in rheumatoid arthritis. Arthritis Res Therapy. 2007;9(5):108. doi:10.1186/ar2313
30. Wilder RL. Integrin alpha V beta 3 as a target for treatment of rheumatoid arthritis and related rheumatic diseases. Ann Rheumat Dis. 2002;61(Suppl 2):ii96–9. doi:10.1136/ard.61.suppl_2.ii96
31. Pandya NM, Dhalla NS, Santani DD. Angiogenesis--a new target for future therapy. Vasc. Pharmacol. 2006;44(5):265–274. doi:10.1016/j.vph.2006.01.005
32. Wen L, Moser M, Ley K. Molecular mechanisms of leukocyte β2 integrin activation. Blood. 2022;139(24):3480–3492. doi:10.1182/blood.2021013500
33. Rinaldi N, Schwarz-Eywill M, Weis D, et al. Increased expression of integrins on fibroblast-like synoviocytes from rheumatoid arthritis in vitro correlates with enhanced binding to extracellular matrix proteins. Ann Rheumat Dis. 1997;56(1):45–51. doi:10.1136/ard.56.1.45
34. Asano T, Iwasaki N, Kon S, et al. α9β1 integrin acts as a critical intrinsic regulator of human rheumatoid arthritis. Rheumatology. 2014;53(3):415–424. doi:10.1093/rheumatology/ket371
35. Hammam N, El-Husseiny PN, Al-Adle SS, et al. Clinical implications of seropositive and seronegative autoantibody status in rheumatoid arthritis patients: a comparative multicentre observational study. Rheumatol. Immunol. Res. 2024;5(1):57–65. doi:10.1515/rir-2024-0007
36. Alten R, Tony HP, Bannert B, et al. Subcutaneous Abatacept for the treatment of rheumatoid arthritis in routine clinical practice in Germany, Austria, and Switzerland: 2-year retention and efficacy by treatment line and serostatus. Clin Rheumatol. 2023;42(9):2321–2334. doi:10.1007/s10067-023-06649-x
37. Takeuchi T, Miyasaka N, Inui T, et al. High titers of both rheumatoid factor and anti-CCP antibodies at baseline in patients with rheumatoid arthritis are associated with increased circulating baseline TNF level, low drug levels, and reduced clinical responses: a post hoc analysis of the RISING study. Arthritis Res Therapy. 2017;19(1):194. doi:10.1186/s13075-017-1401-2
38. Nilsson J, Andersson MLE, Hafström I, et al. Influence of age and sex on disease course and treatment in rheumatoid arthritis. Open Access Rheumatol. 2021;13:123–138. doi:10.2147/oarrr.S306378
39. Humphries MJ, Sheridan J, Mould AP, Newham P. Mechanisms of VCAM-1 and fibronectin binding to integrin alpha 4 beta 1: implications for integrin function and rational drug design. Ciba Found Symp. 1995;189:177–191. doi:10.1002/9780470514719.ch13
40. Siouti E, Andreakos E. The many facets of macrophages in rheumatoid arthritis. Biochem. Pharmacol. 2019;165:152–169. doi:10.1016/j.bcp.2019.03.029
41. Schittenhelm L, Robertson J, Pratt AG, Hilkens CM, Morrison VL. Dendritic cell integrin expression patterns regulate inflammation in the rheumatoid arthritis joint. Rheumatology. 2021;60(3):1533–1542. doi:10.1093/rheumatology/keaa686
42. Cui K, Ardell CL, Podolnikova NP, Yakubenko VP. Distinct Migratory Properties of M1, M2, and resident macrophages are regulated by α(D)β(2) and α(M)β(2) integrin-mediated adhesion. Front Immunol. 2018;9:2650. doi:10.3389/fimmu.2018.02650
43. Luo M, Zhao F, Cheng H, Su M, Wang Y. Macrophage polarization: an important role in inflammatory diseases. Front Immunol. 2024;15:1352946. doi:10.3389/fimmu.2024.1352946
44. Smolen JS, Landewé RBM, Bijlsma JWJ, et al. EULAR recommendations for the management of rheumatoid arthritis with synthetic and biological disease-modifying antirheumatic drugs: 2019 update. Ann Rheumatic Dis. 2020;79(6):685–699. doi:10.1136/annrheumdis-2019-216655
45. Kelly S, Bombardieri M, Humby F, et al. Angiogenic gene expression and vascular density are reflected in ultrasonographic features of synovitis in early Rheumatoid Arthritis: an observational study. Arthritis Res Therapy. 2015;17(1):58. doi:10.1186/s13075-015-0567-8
46. Asif Amin M, Fox DA, Ruth JH. Synovial cellular and molecular markers in rheumatoid arthritis. Semin Immunopathol. 2017;39(4):385–393. doi:10.1007/s00281-017-0631-3
 © 2025 The Author(s). This work is published and licensed by Dove Medical Press Limited. The
full terms of this license are available at https://www.dovepress.com/terms
and incorporate the Creative Commons Attribution
- Non Commercial (unported, 4.0) License.
By accessing the work you hereby accept the Terms. Non-commercial uses of the work are permitted
without any further permission from Dove Medical Press Limited, provided the work is properly
attributed. For permission for commercial use of this work, please see paragraphs 4.2 and 5 of our Terms.
© 2025 The Author(s). This work is published and licensed by Dove Medical Press Limited. The
full terms of this license are available at https://www.dovepress.com/terms
and incorporate the Creative Commons Attribution
- Non Commercial (unported, 4.0) License.
By accessing the work you hereby accept the Terms. Non-commercial uses of the work are permitted
without any further permission from Dove Medical Press Limited, provided the work is properly
attributed. For permission for commercial use of this work, please see paragraphs 4.2 and 5 of our Terms.
Recommended articles
Future Biomarkers for Infection and Inflammation in Rheumatoid Arthritis
Cui S, Qian J
Journal of Inflammation Research 2023, 16:2719-2726
Published Date: 29 June 2023
CD80 Antibody and MTX Co-Engineered Extracellular Vesicles Targets CD80+ Macrophages to Suppress Inflammation and Alleviate Chronic Inflammatory Diseases
Yang J, Zhang H, Wang W, Yin Q, He X, Tao D, Wang H, Liu W, Wang Y, Dong Z, Chen X, Li B
International Journal of Nanomedicine 2025, 20:6379-6398
Published Date: 21 May 2025
APOE and CCR2: Potential Macrophage-Specific Biomarkers in the Rheumatoid Arthritis Synovial Microenvironment Identified by Bioinformatics and Experimental Verification in Murine Models
Wang D, Lu L, Zhang Y, Shang W
Journal of Inflammation Research 2026, 19:587712
Published Date: 25 March 2026