")
Back to Journals » Diabetes, Metabolic Syndrome and Obesity » Volume 15
Elevated CTSL Gene Expression Correlated with Proinflammatory Cytokines in Omental Adipose Tissue of Patients with Obesity
Authors Zhou Q, Zhu Y , Li C, Li Z, Tang Z, Yuan B, Wang X, Zhang S, Wu X
Received 4 May 2022
Accepted for publication 18 July 2022
Published 30 July 2022 Volume 2022:15 Pages 2277—2285
DOI https://doi.org/10.2147/DMSO.S373203
Checked for plagiarism Yes
Review by Single anonymous peer review
Peer reviewer comments 3
Editor who approved publication: Prof. Dr. Juei-Tang Cheng
Qiong Zhou,1,2 Yankun Zhu,3 Chun Li,2 Zhiqiang Li,1 Zhe Tang,2 Baohong Yuan,3 Xiaodan Wang,4 Shengqingyu Zhang,1 Xinan Wu1
1School of Public Health, Kunming Medical University, Kunming, People’s Republic of China; 2Department of Endocrinology, Yan’an Hospital Affiliated to Kunming Medical University, Kunming, People’s Republic of China; 3Department of General Surgery, Yan’an Hospital Affiliated to Kunming Medical University, Kunming, People’s Republic of China; 4Key Laboratory of Tumor Immunological Prevention and Treatment of Yunnan Province, Yan’an Hospital Affiliated to Kunming Medical University, Kunming, People’s Republic of China
Correspondence: Xinan Wu, School of Public Health, Kunming Medical University, Kunming, 650500, People’s Republic of China, Tel +85-13888984762, Fax +86-871-65933614, Email [email protected]
Purpose: Cathepsin L (CTSL) and B (CTSB) were lysosomal proteases, and their expression and activity contribute to the progression of inflammation in obese rodents. Our aim was to investigate CTSB and CTSL expression in omental adipose tissue (AT) of patients with obesity and to correlate CTSB and CTSL expression with proinflammatory cytokines (CCL-2, IL-6 and IL-1β).
Patients and Methods: A total of 12 patients without obesity (NOB) and 51 patients with obesity (OB) were involved in this study. Omental AT was collected from all the participants for RNA extraction. Expressions of CTSB, CTSL and proinflammatory cytokines (CCL-2, IL-6 and IL-1β) were qualified with qRT-PCR. BMI (body mass index) and metabolic parameters were measured.
Results: The mRNA expression levels of both CTSB and CTSL were upregulated in the OB group (t = 2.693, P < 0.05; t = 2.849, P< 0.01) and were related to TC levels (Std.β=0.443, P< 0.05; Std.β=0.439, P< 0.05). However, only the CTSB level was related to BMI (Std.β=0.261, P< 0.05). In multiple regression analysis, CTSL was independently associated with CCL-2, IL-6 and IL-1β levels (Std.β=0.352– 0.462, P< 0.05).
Conclusion: CTSB and CTSL gene expressions were elevated in the omental AT of OB group. CTSL, but not CTSB, was positively correlated with proinflammatory cytokines independently, suggesting that the dysregulation of CTSL may play a significant role in the inflammatory process.
Keywords: adipose tissue, cathepsin, cytokines, obesity, inflammation
Introduction
The prevalence of obesity is high, and it has been rising rapidly in the past few decades. Thus, it has become a serious public health problem globally.1,2 Obesity has increased significantly in the past four decades in China, and the latest national prevalence estimates for 2015–19 were 34.3% for overweight and 16.4% for obesity in adults (≥18 years).3 Obesity-induced inflammation signaling pathways by increasing proinflammation factors,4 leading to insulin resistance.5–7 Beyond the storage of excessive energy, adipose tissue (AT) is implicated in the secretion of proinflammatory ccytokines, suchas interleukin-6 (IL-6), interleukin-1β (IL-1β), C-C motif chemokine 2(CCL-2)/monocyte chemoattractant protein-1 (MCP-1), resulting in persistent and continuous low-grade inflammation.6,8
Autophagy is a recycling system that acts to control intracellular homeostasis, and it is believed to be important for metabolic homeostasis.9 It also plays an important role in regulating the levels of inflammatory molecules, such as IL-1β, CCL-2 and IL-6(6). However, dysregulation of autophagy with lysosomal dysfunction has been reported in the adipose tissue of obese rodents.10 Lysosomal degradation is the final step of autophagy, and it depends on digestive enzymes contained in lysosomes,11 therefore lysosomal dysfunction may lead to autophagy defection and contribute to multiple pathogenesis related to obesity.12
Lysosomes contain more than 50 hydrolytic enzymes, such as proteases, lipases and nucleases, that are critical for autophagic degradation. CTSB (cathepsin B), CTSL (cathepsin L) and CTSD (cathepsin D) are the most abundant lysosomal proteases.13,14 CSTB activation was discovered in both cultured adipocytes exposed to saturated fatty acids in vitro and adipocytes from obese mice fed with high fat diet in vivo, and it was associated with increased inflammatory factors.15 In rodent studies, CTSL and CTSB protein levels were increased in epididymal fat depot but not in inguinal fat depot. Inhibiting CTSB or CTSL activity reduced the secretion of LPS-induced MCP-1 and IL-1β expression in macrophages.16 Recently, CTSB and CTSL expression in overweight/obesity human subcutaneous adipose tissue (SCAT) was reported. This finding indicates that CTSB expression is related to markers of insulin resistance independent of adiposity, and CTSL has been reported to be related to BMI and WHR (waist/hip ratio).17 Visceral adipose tissue is believed to play a key role in obesity-related inflammation,18,19 but few studies have focused on cathepsins expression.
In this study, we performed a cross-sectional analysis and focused on the expression of cathepsins in omental AT, which is a well-known type of visceral AT. We explored the expression of CSTB and CSTL in omental AT and assessed their relationships with inflammatory cytokines to understand the inflammatory process in adipose tissues of individuals with obesity and to provide a target for the prevention or treatment of obesity-related pathology.
Methods
Study Population
The study included 63 individuals who were divided into a group without obesity (NOB, n = 12) and a group with obesity (OB, n = 51) according to their body mass index (BMI, ratio of body weight (kg) to height (m2)). Inclusion criteria for OB group: all the participants met the criteria for weight loss surgery (BMI > 32.5kg/m2 or ≥ 30 kg/m2 with at least one comorbidity).20 Inclusion criteria for NOB group: patients had cholecystectomy for gallbladder polyps or cholelithiasis, and BMI < 30 kg/m2.21 Exclusion criteria: patients had diseases that presented with wasting syndrome (malignant tumors, tuberculosis, etc.), patients with acute infectious diseases (pneumonia, acute cholecystitis, peritonitis, etc.), patients with cardiovascular diseases, patients who had taken any drugs that may affect glucose metabolism or inflammation processes in the previous 3 months and patients who smoked or abused alcohol/drugs. The study protocols were approved by the Ethics Committee of Yan’an Hospital Affiliated to Kunming Medical University (number 2021–073-01). Written informed consent for inclusion in the study was collected from each participant in advance.
Anthropometric and Metabolic Parameters
Anthropometric phenotyping was performed according to a previously described method.17 Peripheral blood was drawn in the morning after fasting for at least 8 hours for laboratory analysis, including fasting glucose levels, lipid profile and fasting insulin levels. Glucose levels, glycosylated hemoglobin (HbA1c) levels and lipid profiles including plasma triglyceride (TG), low-density lipoprotein (LDL), high-density lipoprotein (HDL), and total cholesterol (TC) llevelswere measured using Auto-biochemical Analyzer (Olympus, Japan) by standard techniques. Insulin was detected by chemiluminescence with an autobiochemical immune analyzer (Roche, Japan). For the assessment of insulin resistance, homeostatic model assessment of insulin resistance (HOMA-IR) indices was calculated as HOMA-IR=fasting insulin (μU/L) ×fasting glucose (mmol/L)/22.5.22
Collection of Omental Adipose Tissue
A total of 0.5–1 cm3 of omental AT were taken from the omentum by laparoscopy during the surgery and washed with cold saline immediately. After the blood vessels were removed, the collected adipose tissue was stored at −80°C.
Adipose Tissue mRNA Analysis
Total RNA was extracted from adipose tissue samples using the TRIzol method,23 and 500 ng of total RNA was reverse-transcribed using a SuperRT cDNA synthesis kit (CW BIO). Then, real-time PCRs were performed using an UltraSYBR Real Time PCR detection system (Roche). Reactions were performed in a total volume of 20μL containing 1.5 μL cDNA, 12.5 μL ultra SYBR green supermix (CW BIO) and gene-specific primers. The following primers were used: CTSL (Forward Primer AAGTGGAAGGCGATGCACAA, Reverse Primer AAAGCCATTCATCACCTGCC), CTSB (Forward Primer TCGGA TGAGCTGGTCAACTA, Reverse Primer AGCTTCAGGTCCTCGGTAAA), CCL-2 (Forward Primer AGTTCAGCACACCAACCTTC, Reverse Primer GGGTCAGCACAGATCTCCTT), IL-6 (Forward Primer AGGTACCAACTTGTCGCACTC, Reverse Primer GCCCTGAGAGTACCTTTCCC), and IL-1β (Forward Primer GAAATGCCACCTTTTGACAGTG, Reverse Primer TGGATGCTCTCATCAGGACAG). The 18s gene was used as a housekeeping gene and data were calculated using the delta CT method.
Statistical Analysis
IBM SPSS statistics 23 was used to perform statistical analysis. Data are presented as mean± standard deviation (SD) unless indicated otherwise. To compare group difference, the χ2 test was used for categorical variables, the independent samples t test was used for continuous variables with normal distribution and the Mann–Whitney U-test for continuous variables with skewed distribution. Variables with skewed distribution were ln-transformed, and Pearson’s correlation and stepwise multiple linear regression were used to identify associations between different variables. For all analyses, p value <0.05 was considered significant.
Results
Demographic and Clinical Characteristics of the Study Population
The clinical characteristics of the participants in the two groups are shown in Table 1. The age of the participants ranged from 23 to 40 years old. Compared to individuals without obesity, individuals with obesity had higher BMI, plasma LDL, fasting glucose, HbA1c, and HOMA-IR values. There was no significant difference in age or sex between the two groups.
 |
Table 1 Demographic and Clinical Characteristics of Study Population |
The Gene Expression of CCL-2, IL-6 and IL-1β Was Elevated in the Adipose Tissue of Individuals with Obesity and Was Associated with BMI and HOMA-IR
The gene expression of CCL-2, IL-6 and IL-1β was elevated in the omental AT of OB group (t = 3.972–5.079, p<0.05) and was positively associated with BMI and Ln (HOMA-IR) (Figure 1). After adjusting BMI, only CCL-2 was associated with Ln (HOMA-IR) (r = 0.279, p=0.039).
 |
Figure 1 Increased adipose tissue associated CCL-2, IL-6 and IL-1β gene expression in OB group. (A-C) qRT-PCR analysis for CCL-2, IL-6 and IL-1β of omental adipose tissue from NOB and OB groups. (D-F) CCL-2, IL-6 and IL-1β gene expression are respectively positively associated with BMI and Ln(HOMA-IR). |
CTSB and CTSL Gene Expression Was Elevated in the at of the OB Group
CTSB and CTSL mRNA expression of the omental AT in the OB group was elevated compared with that in the NOB group (t = 2.693, p<0.05; t = 2.849, p<0.01). A strong positive relationship between CTSB and CTSL mRNA expression was observed (r = 0.836, p<0.01) (Figure 2). CTSB mRNA expression was positively associated with BMI, TG, TC and LDL levels. CTSL mRNA expression was positively associated with TG, TC and LDL (Table 2). No association was observed between the mRNA expression of CTSB or CTSL and fasting glucose, insulin or HOMA-IR values (P<0.05). To determine the factors that affect CTSB or CTSL gene expression, a stepwise multiple linear regression analysis was performed. With Ln (CTSB) or Ln (CTSL) as dependent variable, BMI, TG, TC and LDL values were included as independent variables. Multiple linear regression analysis showed that BMI and TC levels were retained in the final model with Ln (CTSB) as dependent variable. BMI and TC levels were positively associated with CTSB gene expression and together explained 25.1% of the variance of the observed Ln (CTSB). Only TC levels were retained in the final model with Ln (CTSL) as the dependent variable. TC levels were positively associated with Ln (CTSL) and were responsible for 17.9% of the variance of the observed Ln (CTSL) (Table 3).
 |
Table 2 Pearson’s Correlation Coefficients for CTSB and CTSL Gene Expression and Clinical Characters |
 |
Table 3 Relationship Between CTSB, CTSL Gene Expression in Omental Adipose Tissues and Adiposity |
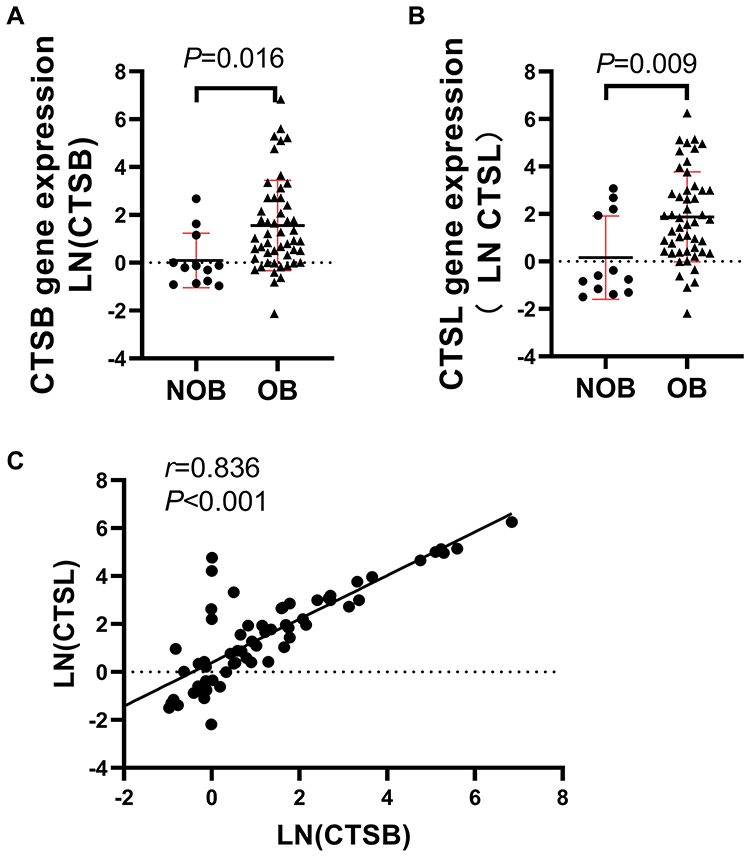 |
Figure 2 Increased CTSB and CTSL gene expression in omental adipose tissue of obese individuals. (A-B) qRT-PCR for CTSB and CTSL mRNA of omental adipose tissue from NOB and OB group. (C) In the study cohort, CTSL expression correlated positively with CTSB gene expression. |
CTSL Correlated with Proinflammatory Cytokines
As IL-1β, IL-6 and CCL-2 might be regulated by autophagy,18 we wondered whether they were related to CTSB/CTSL expression in the omental adipose tissue of humans. To explore the relationship between CTSB/CTSL and inflammatory factors, stepwise multiple linear regression was performed (Table 4).
 |
Table 4 Relationship Between Gene Expression Between CTSB/CTSL and Pro-Inflammatory Cytokines in Omental Adipose Tissues |
Ln (IL-1β), Ln (IL-6) or Ln (CCL-2) were used as the dependent variables, respectively, and BMI, CTSL, CTSB, TG, TC and LDL levels were included as the independent variables. BMI, TC and CTSL were retained in the final model with Ln (IL-6) or Ln (CCL-2) acting as the dependent variable, which explained the 27.9% and 29% changes in the levels of Ln (IL-6) and Ln (CCL-2), accordingly. When Ln (IL-1β) was used as a dependent variable, only CTSL was retained in the final model and explained 16.9% change of Ln (IL-1β). It showed that CTSL, but not CTSB, was positively correlated with the expression of all three proinflammatory factors CCL-2, IL-6 and IL-1β expression.
Discussion
CTSB mRNA expression was upregulated in SCAT from obese compared to lean male (21–35 years old) subjects.24 In our study, a similar upregulation of CTSB mRNA expression was observed in omental AT from OB group. Stepwise multiple linear regression showed that both BMI and TC levels were positively correlated with CTSB mRNA expression, while fasting glucose and HOMA-IR were not. However, a recent study reported that CTSB mRNA expression in SCAT was unrelated with BMI or WHR but negatively correlated with whole-body insulin resistance in middle-aged individuals with obesity (age 52 ± 2 years).17 This difference may be due to different subject characteristics (age and BMI). CTSL mRNA expression was also upregulated in the omental AT of the OB group in our study and was strongly related to CTSB mRNA expression. Different from CTSB mRNA expression, multiple linear regression analysis showed that CTSL mRNA expression was only related to TC. Rodent models indicated that the mutual interaction between CTSB and CTSL in lysosomes maintains lysosomal function.12,25 Moreover, CTSL mRNA expression was significantly elevated in the epididymal AT (visceral AT) of mice with either high-fat diet-induced or genetically induced obesity compared with control mice, while the maturation of CTSL declined. The upregulation of CTSB was a compensatory activation of the downregulation of mature CTSL in obese epididymal AT.10
Interestingly, we found that the mRNA expression of both CTSB and CTSL was related to TC. Autophagy might regulate lipid homeostasis through the selective degradation of lipid droplets via lipophagy.26,27 CTSB and CTSL are two of the most abundant cathepsins that play important roles in the degradation process of autophagy, which is a cellular process strongly associated with lysosomal function. As shown by 3T3L-1 adipocytes, CTSB could be linked to increased lipolysis and possible inflammatory responses via reduced perilipin 1 expression.28 Previous studies found HFD feeding selectively increased CTSL and CTSB levels in epididymal fat in mice. CTSB and CTSL modulate cholesterol homeostasis primarily by regulating the expression of genes involved in cholesterol uptake and NPC2-mediated cholesterol cellular trafficking in macrophages.16 In a study of intestine tissue, CTSB was discovered to have an effect on cholesterol absorption from the intestine.29 All these studies suggest a possible relationship between cholesterol metabolism and CTSB/CTSL. However, more research is needed to clarify the interplay between cholesterol and lysosomal enzymes.
IL-1β, IL-6 and CCL-2 are proinflammatory factors that are known to induce insulin resistance and lead to the development of T2DM.8,18 In the present study, the mRNA expression of IL-1β, IL-6 and CCL-2 in the omental AT was increased in the OB group compared to NOB group. It was also positively associated with BMI and insulin resistance, which is similar to the results of previous studies.30
IL-1β is secreted by NLRP3 (NLR family pyrin domain containing 3) activation and promotes insulin resistance.31,32 Autophagy plays an important role in the regulation of NLRP3 activation,33 and inhibition of autophagy increased IL-1β secretion.34 Epididymal adipose tissue from mice with HFD-induced or genetically induced obesity displayed lysosomal abnormalities, including the deteriorated CTSL function, compensatory elevations in CTSL mRNA and the activation of CTSB, and the lysosomal abnormalities caused NLRP3 activation.10 However, in some studies, CTSL was found to be involved in NLRP3 activation, but autophagy levels were not assessed. Additionally, CTSB and CTSL were implicated in ischemia/reperfusion (I/R)-triggered NLRP3 inflammasome activation in renal tissue, and downregulation of CTSB and CTSL attenuated this activation.35 CTSL knockout cells released significantly less IL-1β, indicating a unique role of CTSL in NLRP3 activation.36,37 Tang et al showed that the knockdown of cathepsin B, L and D affected NLRP3 inflammasome activation by reducing pro-caspase 1 and pro-IL-1β levels in the renal tubular epithelial cell line (HK-2).38 In our present study, elevated CTSL mRNA was positively related with CTSB and IL-1β. This suggested that CTSL dysfunction, the compensatory elevated CTSB, and abnormal autophagy may exist in the omental AT of people with obesity and lead to upregulation of IL-1β; however, this hypothesis needs further confirmation.
The present data showed that CCL-2 and IL-6 mRNA expression was also associated with CTSL. IL-1β, IL-6 and CCL-2 are all NF-kB-dependent proinflammatory mediators, and autophagy is involved in the degradation of NF-kB.39 Blocking autophagy increases CCL-2 and IL-6 levels in the stromal vascular fraction (SVF) of both young and old mice.40 Inhibition of cathepsin B, S, and L leads to a polarization shift from M2- to M1 macrophages with elevated IL-6, CCL-2 and IL-1β levels, which is also associated with distinct alterations in lysosomal signaling and lipid metabolism.41 However, the influence of increased mRNA expression of CTSL on autophagy in human AT is still unknown. Conversely, inflammatory cytokines may also affect CTSL expression. In human lung epithelial cell lines, IL-6 lead to a twofold increase in CTSL mRNA expression. At the protein level, IL-6 induced increased amounts of CTSL but not CTSB.42 Although these studies confirmed the association between CTSL and IL-6/CCL-2, how they interact with each other was elusive. Independent of autophagy, lysosomal membrane permeabilization and cathepsins release also result in increased inflammation.43,44 The involvement of cathepsins in inflammasome activation may act as a system that works together and has both compensatory and independent functions.38,45
In the future, it will be necessary to confirm the protein level and activity of CTSL/CTSB and assess autophagy flux in the omental AT of individuals with obesity. It will also be beneficial to understand the influence of CTSB/CTSL on autophagy and inflammation.
Conclusion
CTSB and CTSL expression in the omental AT of individuals with obesity was elevated compared to that in individuals without obesity. CTSL, but not CTSB, was positively independently related to CCL-2, IL-6 and IL-1β, suggesting that the dysregulation of CTSL may play a significant role in the inflammatory process in AT. However, the present study showed a small cross-sectional analysis, and more research is needed to confirm the relationship and determine the causality of these relationships.
Abbreviations
BMI, body mass index; IL-6, interleukin-6; IL-1β, interleukin-1β; CCL-2, C-C motif chemokine 2; MCP-1, monocyte chemoattractant protein-1; CTSD, cathepsin D; SCAT, subcutaneous adipose tissue; TG, triglycerides; LDL, low-density lipoproteins; HDL, high-density lipoproteins; TC, total cholesterol; HOMA-IR, Homeostatic Model Assessment of Insulin Resistance; HbA1c, glycosylated hemoglobin; NLRP3, NLR family pyrin domain containing 3.
Acknowledgments
We are grateful to all the authors for their contributions to this study.
Funding
This work is supported by grants from the Science and TechnologyDepartment of Yunnan Province (Nos. 202003AC100014) and the Health Science and Technology Fund of Yunnan Province (2018NS0206) in China.
Disclosure
All the authors declared no conflicts of interest in this work.
References
1. Abarca-Gómez L, Abdeen ZA, Hamid ZA, et al. Worldwide trends in body-mass index, underweight, overweight, and obesity from 1975 to 2016: a pooled analysis of 2416 population-based measurement studies in 128·9 million children, adolescents, and adults. Lancet. 2017;390(10113):2627–2642.
2. Alharbi KK, Alshammary AF, Aljabri OS, Ali Khan I. Relationship Between Serum Amyloid A1 (SAA1) Gene Polymorphisms Studies with Obesity in the Saudi Population. Diabetes Metabolic Syndrome Obesity. 2021;14:895–900.
3. Pan XF, Wang L, Pan A. Epidemiology and determinants of obesity in China. Lancet Diabetes Endocrinol. 2021;9(6):373–392.
4. Lumeng CN, Saltiel AR. Inflammatory links between obesity and metabolic disease. J Clin Invest. 2011;121(6):2111–2117.
5. Heymsfield SB, Wadden TA. Mechanisms, Pathophysiology, and Management of Obesity. N Engl J Med. 2017;376(3):254–266.
6. Rutkowski JM, Stern JH, Scherer PE. The cell biology of fat expansion. J Cell Biol. 2015;208(5):501–512.
7. Wu H, Ballantyne CM. Metabolic Inflammation and Insulin Resistance in Obesity. Circ Res. 2020;126(11):1549–1564.
8. Karczewski J, Sledzinska E, Baturo A, et al. Obesity and inflammation. Eur Cytokine Netw. 2018;29(3):83–94.
9. Namkoong S, Cho CS, Semple I, Lee JH. Autophagy Dysregulation and Obesity-Associated Pathologies. Mol Cells. 2018;41(1):3–10.
10. Mizunoe Y, Sudo Y, Okita N, et al. Involvement of lysosomal dysfunction in autophagosome accumulation and early pathologies in adipose tissue of obese mice. Autophagy. 2017;13(4):642–653.
11. Meijer AJ, Codogno P. Regulation and role of autophagy in mammalian cells. Int J Biochem Cell Biol. 2004;36(12):2445–2462.
12. Mizunoe Y, Kobayashi M, Tagawa R, Nakagawa Y, Shimano H, Higami Y. Association between Lysosomal Dysfunction and Obesity-Related Pathology: a Key Knowledge to Prevent Metabolic Syndrome. Int J Mol Sci. 2019;20:15.
13. Kaminskyy V, Zhivotovsky B. Proteases in autophagy. Biochim Biophys Acta. 2012;1824(1):44–50.
14. Schwake M, Schröder B, Saftig P. Lysosomal membrane proteins and their central role in physiology. Traffic. 2013;14(7):739–748.
15. Gornicka A, Fettig J, Eguchi A, et al. Adipocyte hypertrophy is associated with lysosomal permeability both in vivo and in vitro: role in adipose tissue inflammation. Am J Physiol Endocrinol Metab. 2012;303(5):E597–606.
16. Hannaford J, Guo H, Chen X. Involvement of cathepsins B and L in inflammation and cholesterol trafficking protein NPC2 secretion in macrophages. Obesity. 2013;21(8):1586–1595.
17. Xu Q, Mariman ECM, Goossens GH, Blaak EE, Jocken JWE. Cathepsin gene expression in abdominal subcutaneous adipose tissue of obese/overweight humans. Adipocyte. 2020;9(1):246–252.
18. Engin A. The Pathogenesis of Obesity-Associated Adipose Tissue Inflammation. Adv Exp Med Biol. 2017;960:221–245.
19. Kralova Lesna I, Kralova A, Cejkova S, et al. Characterisation and comparison of adipose tissue macrophages from human subcutaneous, visceral and p erivascular adipose tissue. J Transl Med. 2016;14(1):208.
20. Zeng T, Cai Y, Chen L. The Effectiveness of Bariatric Surgery for Chinese Obesity in 2 Years: a Meta-Analysis and Systematic Review. J Investigative Surgery. 2017;30(5):332–341.
21. Alshammary AF, Khan IA. Screening of Obese Offspring of First-Cousin Consanguineous Subjects for the Angiotensin-Converting Enzyme Gene with a 287-bp Alu Sequence. J Obesity Metabolic Syndrome. 2021;30(1):63–71.
22. Matthews DR, Hosker JP, Rudenski AS, Naylor BA, Treacher DF, Turner RC. Homeostasis model assessment: insulin resistance and beta-cell function from fasting plasma glucose a nd insulin concentrations in man. Diabetologia. 1985;28(7):412–419.
23. Roy D, Tomo S, Modi A, Purohit P, Sharma P. Optimising total RNA quality and quantity by phenol-chloroform extraction method from human visceral adipose tissue: a standardisation study. MethodsX. 2020;7:101113.
24. González-Muniesa P, Marrades MP, Martínez JA, Moreno-Aliaga MJ. Differential proinflammatory and oxidative stress response and vulnerability to metabolic syndrome in habitual high-fat young male consumers putatively predisposed by their genetic background. Int J Mol Sci. 2013;14(9):17238–17255.
25. Felbor U, Kessler B, Mothes W, et al. Neuronal loss and brain atrophy in mice lacking cathepsins B and L. Proc Natl Acad Sci U S A. 2002;99(12):7883–7888.
26. Pietrocola F, Bravo-San Pedro JM. Targeting Autophagy to Counteract Obesity-Associated Oxidative Stress. Antioxidants. 2021;10:1.
27. Singh R, Cuervo AM. Lipophagy: connecting autophagy and lipid metabolism. Int J Cell Biol. 2012;2012:282041.
28. Mizunoe Y, Kobayashi M, Hoshino S, et al. Cathepsin B overexpression induces degradation of perilipin 1 to cause lipid metabolism dysfunction in adipocytes. Sci Rep. 2020;10(1):634.
29. Wong WPS, Altemus JB, Hester JF, et al. Cathepsin B is a novel gender-dependent determinant of cholesterol absorption from the intestine. J Lipid Res. 2013;54(3):816–822.
30. Hotamisligil GS. Inflammation, metaflammation and immunometabolic disorders. Nature. 2017;542(7640):177–185.
31. Stienstra R, Tack CJ, Kanneganti TD, Joosten LA, Netea MG. The inflammasome puts obesity in the danger zone. Cell Metab. 2012;15(1):10–18.
32. Antonioli L, Moriconi D, Masi S, et al. Differential Impact of Weight Loss and Glycemic Control on Inflammasome Signaling. Obesity. 2020;28(3):609–615.
33. Biasizzo M, Kopitar-Jerala N. Interplay Between NLRP3 Inflammasome and Autophagy. Front Immunol. 2020;11:591803.
34. Harris J, Hartman M, Roche C, et al. Autophagy controls IL-1beta secretion by targeting pro-IL-1beta for degradation. J Biol Chem. 2011;286(11):9587–9597.
35. Tang TT, Lv LL, Pan MM, et al. Hydroxychloroquine attenuates renal ischemia/reperfusion injury by inhibiting cathepsin mediated NLRP 3 inflammasome activation. Cell Death Dis. 2018;9(3):351.
36. Duewell P, Kono H, Rayner KJ, et al. NLRP3 inflammasomes are required for atherogenesis and activated by cholesterol crystals. Nature. 2010;464(7293):1357–1361.
37. Bauer C, Duewell P, Mayer C, et al. Colitis induced in mice with dextran sulfate sodium (DSS) is mediated by the NLRP3 inflammasome. Gut. 2010;59(9):1192–1199.
38. Campden RI, Zhang Y. The role of lysosomal cysteine cathepsins in NLRP3 inflammasome activation. Arch Biochem Biophys. 2019;670:32–42.
39. Ravanan P, Srikumar IF, Talwar P. Autophagy: the spotlight for cellular stress responses. Life Sci. 2017;188:53–67.
40. Ghosh AK, Mau T, O’Brien M, Garg S, Yung R. Impaired autophagy activity is linked to elevated ER-stress and inflammation in aging adipose tissue. Aging. 2016;8(10):2525–2537.
41. Oelschlaegel D, Weiss Sadan T, Salpeter S, et al. Cathepsin Inhibition Modulates Metabolism and Polarization of Tumor-Associated Macrophages. Cancers. 2020;12(9):548.
42. Gerber A, Welte T, Ansorge S, Bhling F. Expression of cathepsins B and L in human lung epithelial cells is regulated by cytokines. Adv Exp Med Biol. 2000;477:287–292.
43. Chen Y, Li X, Boini KM, et al. Endothelial Nlrp3 inflammasome activation associated with lysosomal destabilization during coronary a rteritis. Biochim Biophys Acta. 2015;1853(2):396–408.
44. Zhao S, Gong Z, Du X, et al. Deoxycholic Acid-Mediated Sphingosine-1-Phosphate Receptor 2 Signaling Exacerbates DSS-Induced Coliti s through Promoting Cathepsin B Release. J Immunol Res. 2018;2018:2481418.
45. Fortelny N, Cox JH, Kappelhoff R, et al. Network analyses reveal pervasive functional regulation between proteases in the human protease web. PLoS Biol. 2014;12(5):e1001869.
 © 2022 The Author(s). This work is published and licensed by Dove Medical Press Limited. The full terms of this license are available at https://www.dovepress.com/terms.php and incorporate the Creative Commons Attribution - Non Commercial (unported, v3.0) License.
By accessing the work you hereby accept the Terms. Non-commercial uses of the work are permitted without any further permission from Dove Medical Press Limited, provided the work is properly attributed. For permission for commercial use of this work, please see paragraphs 4.2 and 5 of our Terms.
© 2022 The Author(s). This work is published and licensed by Dove Medical Press Limited. The full terms of this license are available at https://www.dovepress.com/terms.php and incorporate the Creative Commons Attribution - Non Commercial (unported, v3.0) License.
By accessing the work you hereby accept the Terms. Non-commercial uses of the work are permitted without any further permission from Dove Medical Press Limited, provided the work is properly attributed. For permission for commercial use of this work, please see paragraphs 4.2 and 5 of our Terms.