")
Back to Archived Journals » Reports in Electrochemistry » Volume 5
Electrochemical behavior and assay of anti-Parkinson drug selegiline using cathodic adsorptive stripping square wave voltammetry in bulk form
Authors Sinha P, Shekhawat A, Sharma DK
Received 18 June 2015
Accepted for publication 10 August 2015
Published 23 October 2015 Volume 2015:5 Pages 21—28
DOI https://doi.org/10.2147/RIE.S90750
Checked for plagiarism Yes
Review by Single anonymous peer review
Peer reviewer comments 2
Editor who approved publication: Professor A.M Kannan
Priyanka Sinha, Anjuman Shekhawat, Digish K Sharma
Electrochemical Research Laboratory, Department of Chemistry, University of Rajasthan, Jaipur, India
Abstract: The electrochemical reduction behavior of selegiline was investigated by cyclic voltammetry using glassy carbon electrode and validated by square wave cathodic adsorptive stripping voltammetry. Selegiline gave one well-defined reduction peak in the potential range −0.4 to −0.5 V versus Ag/AgCl electrode. The reduction process is irreversible and partial diffusion controlled. Various chemical and instrumental parameters affecting the electroanalytical response for the determination of selegiline were investigated and optimized. Under optimized conditions, the adsorptive stripping peak current is found to be linear over the concentration range of 3.0×10⁻⁷–2.5×10⁻⁵ M with a detection limit of 3.04×10⁻⁸ M and a lower limit of quantification of 1.01×10⁻⁷ M.
Keywords: selegiline, anti-Parkinson drug, glassy carbon electrode, square wave cathodic adsorptive stripping voltammetry, diffusion controlled
Introduction
Selegiline (l-deprenyl) is a drug that is used for the treatment of early-stage Parkinson’s disease, depression, and dementia. Selegiline is an irreversible and relatively selective inhibitor of monoamine oxidase (MAO-B). MAO-Bs are flavoenzymes sited in the outer mitochondrial membranes of brain, which catalyze the oxidation of a large variety of amine neurotransmitters into the corresponding imines.1 Selegiline has negligible oral bioavailability due to extensive first-pass metabolism.2
It takes a protective action against DNA damage, oxidative stress, and excitotoxic damage from glutamate by trapping hydroxyl and peroxyl radicals. It also stimulates the release of superoxide dismutase (SOD).3,4 SOD is a key enzyme that helps to quench the production of damaging free radicals. Selegiline may prevent or reverse iron-induced memory impairment. The deposition of excess iron in the brain is implicated in several neurodegenerative diseases.5
Selegiline has a structure of N-methyl-N-(2-propynyl)-2-methyl-1-phenyl ethyl-2-amine and is synthesized by the alkylation of (−)-methamphetamine using propargyl bromide. The chemical structure of selegiline is shown in Figure 1.
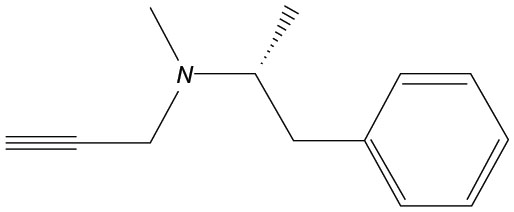 | Figure 1 Structure of selegiline. |
Quantitative analysis of selegiline in human plasma by high-performance liquid chromatography (HPLC) along with some other metabolites is reported; further, its determination in urine has also been reported by capillary electrophoresis.6–8
There has been no electrochemical study published on quantitative determination of selegiline in bulk form as well as pharmaceutical formulations. The widespread use of this compound and the need for clinical and pharmacological studies require fast and sensitive analytical techniques to assay the drug in pharmaceutical dosage forms. This paper deals with the voltammetric determination of drug in bulk form with a low detection limit, hence making it more sensitive.
The low value of limit of detection (LOD) validates the analytical procedure and provides a fast and reliable technique for the assay of the sample without consuming excess time.
Materials and methods
Selegiline was obtained in pharmaceutical dosage form from Intas Pharmaceuticals Pvt Ltd (Ahmedabad, Gujarat, India), and was used after purification. A stock solution of selegiline (1.5×10⁻³ mol/L) was prepared in distilled ethanol. Double distilled water, obtained from laboratory distillation assembly, was used throughout the studies. The solutions for recording voltammograms were prepared by mixing appropriate volume of stock solution and buffers. All chemicals used were of analytical grade and obtained from Sigma-Aldrich (St Louis, MO, USA).
Instrumentation
Electrochemical measurements were performed using model 1230A [SR 400] electrochemical analyzer (CHI Instrument, Bee Cave, TX, USA), purchased from Sinsil International, Mumbai, India. Electrodes used were: glassy carbon electrode (GCE) as working electrode, Ag/AgCl (3.0 mol/L KCl) as reference electrode, and a platinum electrode as auxiliary electrode. All the solutions examined by electrochemical techniques were purged for 10–15 minutes with purified nitrogen gas in which a continuous stream of nitrogen was passed over the solutions before each of the measurements. Nitrogen gas was deoxygenated by passing it through acidic sodium (meta) vanadate solution. All pH-metric measurements were made on a CHINO (Chino Scientific Instruments Mfg, Ajmer, Rajasthan, India) digital pH meter fit with a glass electrode standardized with buffers of known pH.
Analytical procedure
A portion of the finely grounded material equivalent to 10 mg of selegiline was accurately weighed and dissolved in 20 mL of ethanol; then the solution was diluted with 15 mL of water and subjected to sonication for 15 minutes in order to get a homogenous solution. The contents of the beaker were transferred into a centrifuging tube and centrifuged at 3,000 rpm for 30 minutes. An aliquot of 1.5×10⁻³ mol/L of the solution was then analyzed according to the proposed voltammetric procedure.
Pretreatment of GCE
The working GCE was polished with 0.05 μm alumina slurry and further subjected to sonication for a short duration prior to each measurement in order to remove all impurities that remained on the surface of the electrode, and then it was dried at 40°C in an oven.
Results and discussion
The electrochemical behavior of selegiline at GCE was studied using cyclic voltammetry (CV) and square wave cathodic adsorptive stripping voltammetry (SWCAdSV). In all electrochemical methods, selegiline gave one well-defined cathodic peak in Britton Robinson (BR) buffer of pH 11.0 at GCE.
Cyclic voltammetric behavior
Typical cyclic voltammograms for selegiline were recorded within the potential range of 0.0 to −0.8 V versus Ag/AgCl reference electrode at different scan rates and concentrations. Selegiline (1.5×10⁻³ mol/L) in BR buffer gave a well-defined cathodic reduction peak in the chosen potential range, while no peaks were obtained in the anodic direction, thus indicating the irreversible nature of reduction.9
Effect of scan rate
Cyclic voltammograms of selegiline, recorded at different scan rates, clearly showed that as the scan rate is increased from 20 to 160 mV/s at a certain concentration of selegiline, the peak potential shifted toward more negative value, supporting the irreversible nature of the reduction process (Figure 2A).10
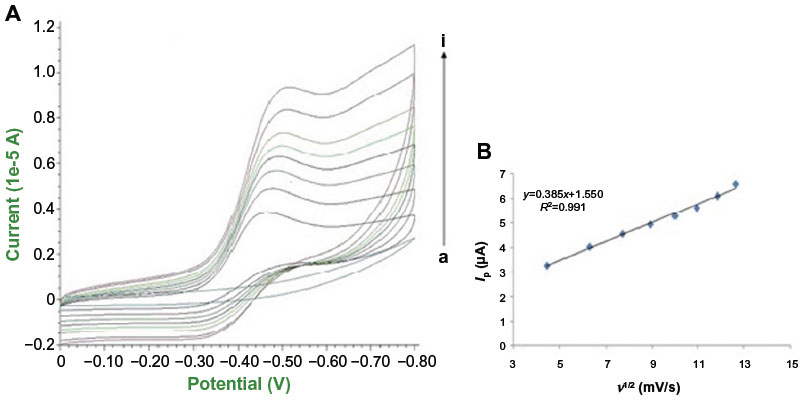 | Figure 2 Peak current as a response to the potential in triangular wave form with varying scan rate. |
Furthermore, peak current was found to be linearly dependent on square root of scan rate consistent with the Randles–Sevcik equation, which can be expressed as:

where n is the number of electrons exchanged in reduction, n′ is the number of electrons involved in the rate determining step, α is the charge transfer coefficient, A (cm2) is the apparent surface area of the electrode, Co (mol/L) is the concentration of the electroactive species, Ip (μA) is the cathodic peak current, Do (cm2/s) is the diffusion coefficient of the electroactive species, and ν (mV/s) is the scan rate.
For diffusion controlled process, Ip is directly proportional to U½ (Ip α ν½).11,12 Hence, a graph (Figure 2B) between peak current versus square root of scan rate shows linear behavior, providing indications about the diffusion process as the rate-determining step of the reduction mechanism, which is expressed by the following linear regression equation:
A slope of 0.38 confirms the diffusive nature of reduction of selegiline. Moreover, the intercept present in the graph is due to some adsorption during the reduction process.
Square wave cathodic adsorptive stripping voltammetry
On the basis of the electrochemical reduction of selegiline at GCE, SWCAdSV method was optimized for trace determination of selegiline by its square wave potential waveforms. Voltammograms of bulk selegiline in the BR buffer recorded by square wave voltammetry following its preconcentration onto the GCE by adsorptive accumulation for 15 seconds exhibited a well-defined single irreversible cathodic peak at pH 11.0.
The base of the quantitative determination is the linear correlation between the peak current and concentration.13 The best single peak shape, peak current sensitivity, and reproducibility of these techniques were obtained in alcoholic solution.
Optimization of operational parameters
The dependence of peak current on instrumental conditions such as frequency (f), scan increment (ΔS), and pulse amplitude (Esw) were examined, and optimum operational conditions were obtained.
Effect of frequency
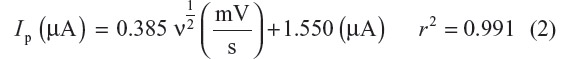
The peak current of the reduction of selegiline using SWCAdSV was found to be linearly dependent on the operational frequency in the range of 10–50 Hz, while a well-defined peak was obtained at 30 Hz. At higher frequencies, the peak shape broadened, and hence 30 Hz frequency was chosen for the further determination.14
Figure 3 shows a linear graph between Ip versus frequency (f) with a regression equation of:

 | Figure 3 Plot of Ip versus frequency (f) for selegiline in 1.5×10⁻³ M concentration in BR buffer at pH 11.0. |
Effect of scan increment and pulse amplitude
Square wave voltammetric techniques are employed to perform an experiment much faster than normal and differential pulse voltammetric techniques. An increase in scan increment (ΔS) in the range of 2–10 mV increased the peak current, but the preferred scan increment was taken as 4 mV suitable with respect to peak shape and size, as beyond this scan increment, the peak shape was broadened. The best peak definition was obtained at 25 mV of pulse amplitude (Esw).
The staircase step period (square period) =0.03 seconds according to the fact:
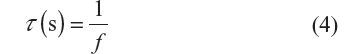
where τ is square period in seconds and f is the square wave frequency in Hz.
Furthermore, the peak-to-peak amplitude was calculated as:15

All operational parameters are listed in Table 1.
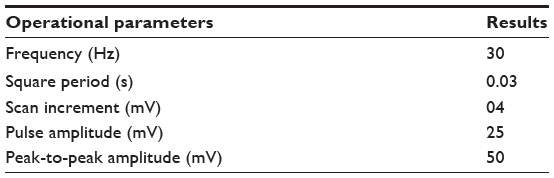 | Table 1 Optimized operational parameters for SWCAdSV |
Effect of concentration
In the optimized conditions, a linear variation of the peak current (Ip) with concentration of bulk selegiline was examined within the concentration range of 4.2×10⁻¹⁰–1.5×10⁻⁴ M.16 The square wave cathodic adsorptive stripping voltammograms of selegiline at different concentrations are shown in Figure 4A.
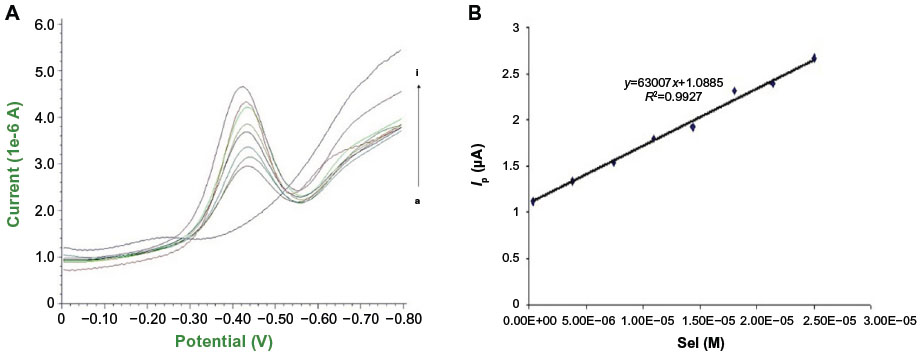 | Figure 4 Peak current as a response to the potential in square wave form with varying concentration. |
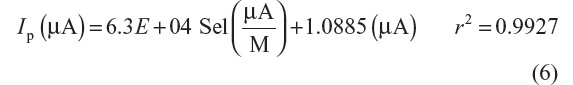
The SWCAdSV peak current linearly increased with increasing concentrations (Figure 4B), and corresponding regression equation for the graph between Ip versus concentrations is as follows:
Effect of pH
The effect of pH on the monitored electroanalytical signal was investigated by varying the pH in the range 7.0–12.0 in BR buffer at a target concentration of 1.5×10⁻³ mol/L selegiline solution. Linear pH dependence of the peak potential for reduction wave clearly shows that the proton participates directly in the reduction process carried out at GCE (Figure 5A and B).17–19
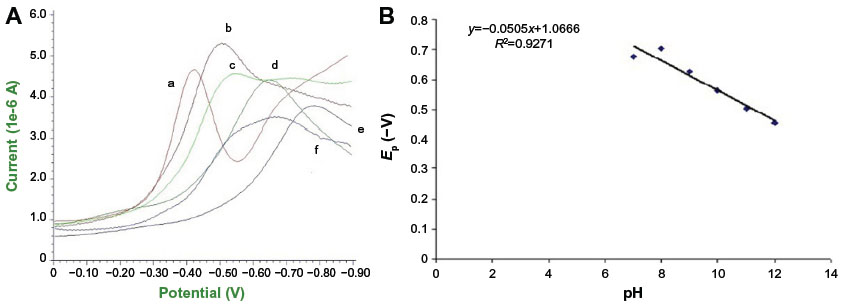 | Figure 5 Effect of pH on peak current and peak potential. |
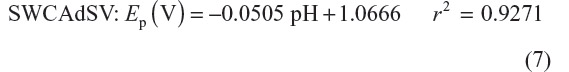
The relation between Ep of the reduction wave and pH over the range 7.0–12.0 may be expressed by the following regression equations:
As depicted in Figure 6, the peak height attains maxima at pH 11.0 and thereafter decreases. Therefore, pH 11.0 was selected as the optimum pH for the determination of selegiline.
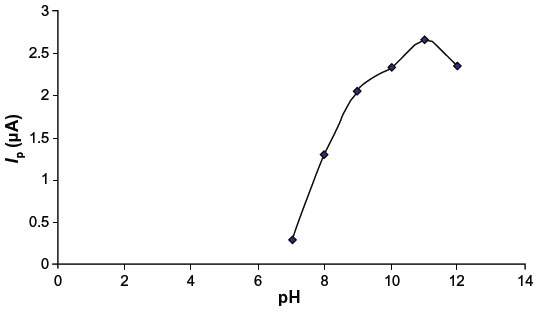 | Figure 6 Influence of pH on SWCAdCV peak current of 1.5×10⁻³ M selegiline in BR buffer (pH 7.0–12.0). |
Validation of the analytical procedure
The base of the quantitative determination is the linear correlation between the peak current and concentration.20,21 The validation of proposed method for quantification in bulk form of selegiline was carried out via estimation of linearity range of concentration, LOD, limit of quantification (LOQ), and % recovery.
LOD and LOQ
The smallest concentration of the sample that can be detected with appreciable certainty was calculated using the equation:
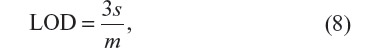
where s is the standard deviation of intercept and m is the slope of the calibration curve (Ip versus concentration). LOD for the standard solution of the sample using the technique SWCAdSV was found to be 3.04×10⁻⁸ M.
The lower LOQ for precise measurements was determined using the equation:
The LOQ for the proposed method was found to be 1.01×10⁻⁷ M. The low values of LOD and LOQ proved the good sensitivity of the method.
Similarly, low value of % relative standard deviation (RSD) indicates less spread of sets of data, which shows a good precision in the method. All data are tabulated in Table 2.
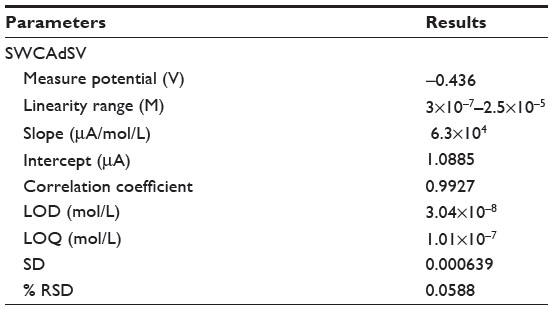 | Table 2 Analytical parameters for voltammetric determination of selegiline in bulk form using SWCAdSV |
Percentage recovery
A certain amount of the sample was added and the method was applied to experimentally investigate the concentration present in the solution. The amount found was expressed in terms of mean percentage recovery. The data were collected based on the five separate determinations. All the results obtained were compared with the results obtained from the determination of selegiline by reverse phase high-performance liquid chromatography (RP-HPLC) and were found to be more accurate.22
Accuracy
Since accuracy is the nearness of a calculation to the true value, the accuracy of the procedure was investigated by calculating the error between measured mean concentrations found and the concentration that was actually added.
The mean recovery was found to be 98.83%±0.025246% for selegiline, and the result for accuracy was further compared with the result from RP-HPLC. The result was found to be more accurate than the result obtained from RP-HPLC (Table 3).
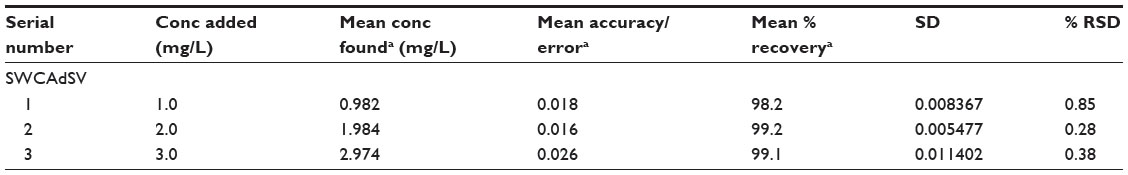 | Table 3 Result of accuracy for assay of selegiline in bulk form using SWCAdSV |
Precision
Repeatability
The repeatability study, conducted using the test selegiline solution of concentration 5 mg/L in five replicate readings (n=5), shows an RSD of 0.02944%. It was concluded that the analytical technique has good repeatability. Data are listed in Table 4.
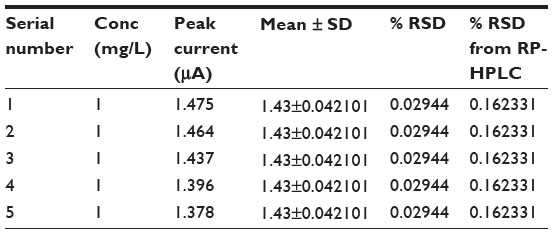 | Table 4 Result for repeatability |
Intermediate precision (intraday and interday study)
The intraday studies were conducted on the test selegiline solution of concentrations 1, 2, and 3 mg/L in four replicate readings (n=4) at an equal time interval of 0, 2, 4, and 6 hours, while interday analysis was carried out on the aforementioned same three test solutions in triplicate readings (n=3) at a time interval of 24 hours continuously for 3 days. The value of RSD for intraday and interday analysis was found to be 0.92% and 0.15% (overall), respectively, thus demonstrating the precision of the method. Data were further compared with the result obtained from RP-HPLC. All data for intraday analysis are listed in Table 5, and data for interday analysis are listed in Tables 6 (day 1), 7 (day 2), 8 (day 3), and 9 (overall RSD).
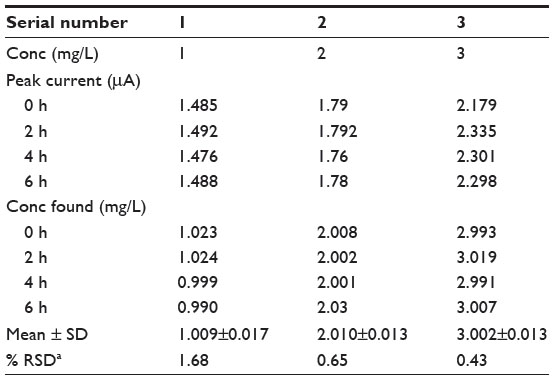 | Table 5 Result for intraday study |
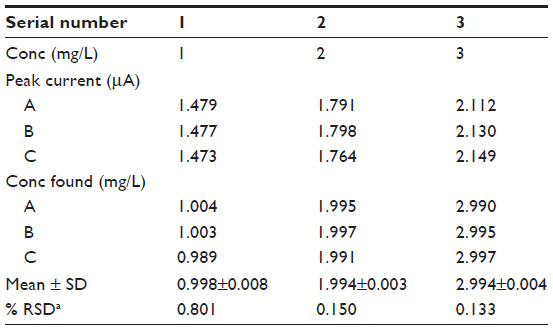 | Table 6 Result for interday study (day1) |
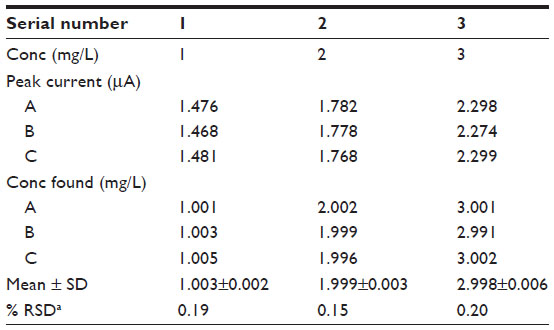 | Table 7 Result for interday study (day 2) |
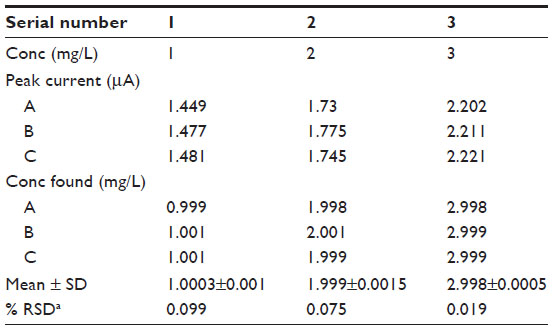 | Table 8 Result for interday study (day 3) |
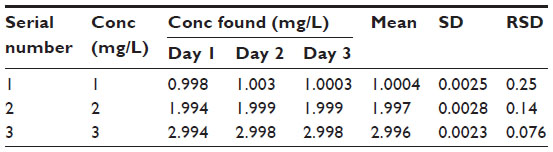 | Table 9 Overall % RSD |
Conclusion
The investigated voltammetric behavior supports the elucidation of the possible cathodic process and gives an idea of diffusion-controlled rate-determining step of reduction mechanism, while the proposed SWCAdSV procedure can be successfully applied for the determination of selegiline in pharmaceutical formulations. The method allows for direct dissolution and estimation of the drug with good accuracy and precision, and hence is a comparatively quick, reliable, and relatively cheap method to perform in quality control laboratories.
Acknowledgments
This work was financially supported by the Council of Scientific and Industrial Research, New Delhi, India, by grant File Number 09/149(0654)/2014/EMR-I. The authors would also like to thank Professor Suresh K Bhargava, Deputy pro-vice chancellor (International), Royal Melbourne Institute of Technology, Australia, for suggestions and providing instrumental accessories.
Disclosure
The authors report no conflicts of interest in this work.
References
Borstnar R, Repic M, Krzan M, Mavri J, Vianello R. Irreversible inhibition of monoamine oxidase b by the antiparkinsonian medicines rasagiline and selegiline: a computational study. Eur J Org Chem. 2011;32: 6419–6433. | |
Benetton SA, Fang C, Yang Y, et al. P450 phenotyping of the metabolism of selegiline to desmethylselegiline and methamphetamine. Drug Metab Pharmacokinet. 2007;22(2):78–87. | |
Chen B, Jack J. Pharmacology and pharmacokinetics of rasagiline: a selective, irreversible, second-generation MAO-B inhibitor. Formulary. 2006;41:18–24. | |
Seymour CB, Mothersill C, Mooney R, Moriarty M, Tipton KF. Monoamine oxidase inhibitors l-deprenyl and clorgyline protect nonmalignant human cells from ionizing radiation and chemotherapy toxicity. Br J Cancer. 2003;89(10):1979–1986. | |
Magyar K. Effect of selegiline against selective neurotoxins. Voprosy Meditsinskoi Khimii. 1997;43(6):504–514. | |
Krishnaiah YSR, Jayaram B, Rama B, et al. Reverse-phase HPLC method for the estimation of selegiline hydrochloride in pharmaceutical dosage forms. Asian J Chem. 2003;15(3–4):1291–1296. | |
Slawson MH, Taccogno JL, Foltz RL, Moody DE. Quantitative analysis of selegiline and three metabolites (N-desmethylselegiline, methamphetamine, and amphetamine) in human plasma by high-performance liquid chromatography-atmospheric pressure chemical ionization-tandem mass spectrometry. J Anal Toxicol. 2002;26(7):430–437. | |
Heo YJ, Whang YS, In MK, Lee KJ. Determination of enantiomeric amphetamines as metabolites of illicit amphetamines and selegiline in urine by capillary electrophoresis using modified β-cyclodextrin. J Chromatogr B Biomed Sci Appl. 2000;741(2):221–230. | |
Shekhawat KS, Sharma H, Bhargava SK, Sharma DK. Electrochemical behavior of 4-(5′6′7′8′-tetrahydro-naphthalene)-1-tetralone in aprotic media. Chem Sci Trans. 2013;2(4):1334–1339. | |
Varshney G, Sharma DK. Electrochemical behavior of N-[[(1-methylethyl) amino] carbonyl]-4-[(30-methylphenyl) amino]-3pyridinesulfonamide on glassy carbon and platinum electrodes in Protic media. Der Pharm Sinica. 2013;5(2):80–94. | |
Kumari M, Sharma DK. Synthesis of (1-ethyl-2-phenyl-1,4-dihydro-quinolin-4-yl)-(2,4,6-trimethyl-phenyl)-amine by electrochemical methods in aprotic media. Croatica Chem Acta. 2011;84(4):455–460. | |
Kumari M, Sharma DK. Electrochemical behavior of (2, 4-difluoro-phenyl)-(2-phenyl-1H-quinolin-4-electrochemical ylidene)-amine in Aprotic media. J Korean Chem Soc. 2011;55(1):50–56. | |
Kacar C, Durmus Z, Kilic E. Electrochemical behavior of tradazone at mercury and glassy carbon electrodes and voltammetric methods for its determination. Asian J Chem. 2014;26(7):1931–1937. | |
Jain R, Rather JA. Stripping voltammetry of tinidazole in solubilized system and biological fluids. Colloids Surfaces A Physicochem Eng Asp. 2011;378(1–3):27–33. | |
Tasdemir IH, Akay MA, Erk N, Kilic E. Voltammetric behavior of telmisartan and cathodic adsorptive stripping voltammetric method for its assay in pharmaceutical dosage forms and biological fluids. Electroanalysis. 2010;22(17–18):2101. | |
Princeton Applied Research. Application note S-7. Subject: Square wave voltammetry. Available from: http://www.princetonappliedresearch.com/Literature/index.aspx#-D. Accessed June 22, 2015. | |
Svorc L, Sochr J, Tomcik P, Rievaj M, Bustin D. Simultaneous determination of paracetamol and penicillin V by square-wave voltammetry at a bare boron-doped diamond electrode. Electrochim Acta. 2012;68: 227–234. | |
Jhankal KK, Sharma A, Ramswaroop, Sharma DK. Quantification of antiviral drug entecavir in pharmaceutical formulation by voltammetric techniques. J Pharm Sci Res. 2015;7(1):10–13. | |
Uslu B, Ozkan SA. Electroanalytical methods for the determination of pharmaceuticals: a review of recent trends and developments. Anal Lett. 2011;44(16):2644–2702. | |
Jain R, Dwivedi A, Mishra R. Adsorptive stripping voltammetric behavior of nortriptyline hydrochloride and its determination in surfactant media. Langmuir. 2009;25(17):10364–10369. | |
Jayant IG, Sharnappa TN. Electrochemical behavior of paclitaxel and its determination at glassy carbon electrode. Asian J Pharm Sci. 2014;9(1):42–49. | |
Gupta M, Paliwal SK. Analytical method development and its validation for estimation of selegiline hydrochloride by reversed phase high performance liquid chromatography (RP-HPLC). Int J Res Pharm Biomed Sci. 2013;4(3):773–781. |
 © 2015 The Author(s). This work is published and licensed by Dove Medical Press Limited. The
full terms of this license are available at https://www.dovepress.com/terms.php
and incorporate the Creative Commons Attribution
- Non Commercial (unported, v3.0) License.
By accessing the work you hereby accept the Terms. Non-commercial uses of the work are permitted
without any further permission from Dove Medical Press Limited, provided the work is properly
attributed. For permission for commercial use of this work, please see paragraphs 4.2 and 5 of our Terms.
© 2015 The Author(s). This work is published and licensed by Dove Medical Press Limited. The
full terms of this license are available at https://www.dovepress.com/terms.php
and incorporate the Creative Commons Attribution
- Non Commercial (unported, v3.0) License.
By accessing the work you hereby accept the Terms. Non-commercial uses of the work are permitted
without any further permission from Dove Medical Press Limited, provided the work is properly
attributed. For permission for commercial use of this work, please see paragraphs 4.2 and 5 of our Terms.