Back to Journals » OncoTargets and Therapy » Volume 15
EGFR Mutation Status and Subtypes Predicted by CT-Based 3D Radiomic Features in Lung Adenocarcinoma
Authors Chen Q ![]() , Li Y
, Li Y ![]() , Cheng Q, Van Valkenburgh J, Sun X, Zheng C, Zhang R, Yuan R
, Cheng Q, Van Valkenburgh J, Sun X, Zheng C, Zhang R, Yuan R
Received 20 January 2022
Accepted for publication 6 May 2022
Published 30 May 2022 Volume 2022:15 Pages 597—608
DOI https://doi.org/10.2147/OTT.S352619
Checked for plagiarism Yes
Review by Single anonymous peer review
Peer reviewer comments 3
Editor who approved publication: Dr William C. Cho
Quan Chen,1,2 Yan Li,3 Qiguang Cheng,1,2 Juno Van Valkenburgh,4 Xiaotian Sun,1,2 Chuansheng Zheng,1,2 Ruiguang Zhang,5 Rong Yuan6
1Department of Radiology, Union Hospital, Tongji Medical College, Huazhong University of Science and Technology, Wuhan, People’s Republic of China; 2Hubei Province Key Laboratory of Molecular Imaging, Wuhan, People’s Republic of China; 3Department of Pathology, Union Hospital, Tongji Medical College, Huazhong University of Science and Technology, Wuhan, People’s Republic of China; 4Department of Radiology, Molecular Imaging Center, Keck School of Medicine, University of Southern California, Los Angeles, CA, USA; 5Cancer Center, Union Hospital, Tongji Medical College, Huazhong University of Science and Technology, Wuhan, People’s Republic of China; 6Department of Radiology, Peking University Shenzhen Hospital, Shenzhen PKU-HKUST Medical Center, Shenzhen, People’s Republic of China
Correspondence: Ruiguang Zhang, Cancer Center, Union Hospital, Tongji Medical College, Huazhong University of Science and Technology, Wuhan, Hubei, People’s Republic of China, Email [email protected] Rong Yuan, Department of Radiology, Peking University Shenzhen Hospital, Shenzhen PKU-HKUST Medical Center, Shenzhen, People’s Republic of China, Email [email protected]
Objective: In this study, we aim to establish a non-invasive tool to predict epidermal growth factor receptor (EGFR) mutation status and subtypes based on radiomic features of computed tomography (CT).
Methods: A total of 233 lung adenocarcinoma patients were investigated and randomly divided into the training and test cohorts. In this study, 2300 radiomic features were extracted from original and filtered (Exponential, Laplacian of Gaussian, Logarithm, Gabor, Wavelet) CT images. The radiomic features were divided into four categories, including histogram, volumetric, morphologic, and texture features. An RF-BFE algorithm was developed to select the features for building the prediction models. Clinicopathological features (including age, gender, smoking status, TNM staging, maximum diameter, location, and growth pattern) were combined to establish an integrated model with radiomic features. ROC curve and AUC quantified the effectiveness of the predictor of EGFR mutation status and subtypes.
Results: A set of 10 features were selected to predict EGFR mutation status between EGFR mutant and wild type, while 9 selected features were used to predict mutation subtypes between exon 19 deletion and exon 21 L858R mutation. To predict the EGFR mutation status, the AUC of the training cohort was 0.778 and the AUC of the test cohort was 0.765. To predict the EGFR mutation subtypes, the AUC of training cohort was 0.725 and the AUC of test cohort was 0.657. The integrated model showed the most optimal predictive performance with EGFR mutation status (AUC = 0.870 and 0.759) and subtypes (AUC = 0.797 and 0.554) in the training and test cohorts.
Conclusion: CT-based radiomic features can extract information on tumor heterogeneity in lung adenocarcinoma. In addition, we have established a radiomic model and an integrated model to non-invasively predict the EGFR mutation status and subtypes of lung adenocarcinoma, which is conducive to saving clinical costs and guiding targeted therapy.
Keywords: lung adenocarcinoma, epidermal growth factor receptor, gene mutation, radiomics, computed tomography
Introduction
Lung cancer is the leading cause of cancer-related deaths worldwide.1 Lung adenocarcinoma is the most common type of non-small-cell lung cancers (NSCLC), which accounts for about 35–45% of lung malignant tumors.2 Lung adenocarcinoma is composed of tumors with significant molecular heterogeneity, which is caused by different internal carcinogenic signal pathways and characterized by high rates of genetic mutation.3 The epidermal growth factor receptor (EGFR) signaling pathway plays a vital role in a variety of lung cancers, especially lung adenocarcinoma. Multiple clinical trials have shown that first-line administration of EGFR-tyrosine kinase inhibitors (EGFR-TKI) can prolong progression-free survival (PFS) compared with chemotherapy for lung adenocarcinoma patients with EGFR mutations.4–8 The most common mutations are exon 19 deletion (exon 19) and the exon 21 L858R mutation (exon 21).9–11 It is worth mentioning that the exon 19 mutation has a better prognosis than the exon 21 mutation with EGFR-TKI.12–14 Therefore, the detection of EGFR mutation status and subtypes is very important for guiding the targeted therapy of lung adenocarcinoma patients.
Gene sequencing or amplification refractory mutation systems are often used to detect EGFR mutation status in clinical settings. These techniques rely on invasive detection methods (surgical resection or tissue biopsy) and have other limitations (eg, sampling errors, biological heterogeneity between the primary tumor and metastatic sites, etc.). In addition, they can cause discomfort for patients and increase medical costs.15 Unfortunately, there are no reliable clinical characteristics that can accurately predict EGFR mutation status. It is necessary to find a potential clinical feature to detect specific EGFR mutations and guide targeted therapy of lung adenocarcinoma.
Computed tomography (CT) imaging is often used clinically as a non-invasive tool to diagnose lung cancer. Radiomics based on chest CT imaging can be used to quantify imaging features and characterize the molecular properties of NSCLC.16–19 Several studies have shown that radiomic features of lung cancer patients extracted from CT images of NSCLC can be used to predict EGFR mutation status, treatment response, survival, and distant metastasis.20–26 However, there are currently only few studies that can distinguish between EGFR mutation status and subtypes.
In this retrospective study, we performed a CT-based radiomic analysis on patients with lung adenocarcinoma to identify the EGFR mutation status (EGFR mutant and wild type) and subtypes (exon 19 or exon 21). This analysis can help save clinical costs and guide therapy of EGFR-TKI.
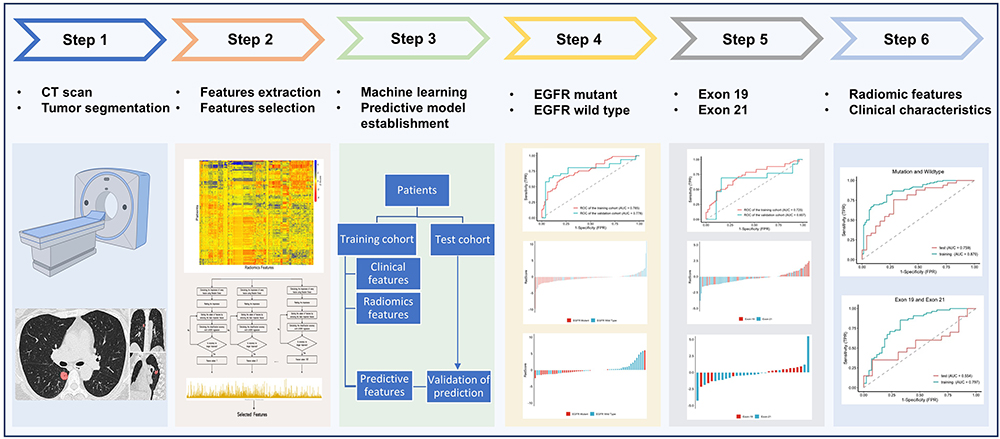 |
Figure 1 Workflow diagram of the study. |
Materials and Methods
Patient Population
Patient data and samples from July 2015 to July 2017 from a total of 369 patients with pathologically confirmed primary lung adenocarcinoma were extracted from the Cancer Center of Union Hospital, Tongji Medical College, Huazhong University of Science and Technology. The inclusion criteria were as follows: (I) tumor sample tissue obtained by surgery or biopsy; (II) pathological diagnosis of lung adenocarcinoma based on hematoxylin-eosin and immunohistochemical staining; (III) availability of complete thin-slice chest CT images (≤1 mm) reconstructed in Digital Imaging and Communications in Medicine (DICOM) format before treatment. The exclusion criteria were as follows: (I) other EGFR mutations: exon 18 or exon 20 mutation, or simultaneous multiple EGFR mutations; (II) no thin-slice chest CT images; (III) tumor edge was indistinguishable with the naked eyes; (IV) images with severe artifact.
Clinicopathological data collected for analyses included age, gender, smoking status, TNM staging, maximum diameter, lesion location, growth pattern, and EGFR mutation status and subtype. Smoking status was categorized into 2 groups: non-smokers and smokers (consisting of former and current smokers). Lung adenocarcinoma staging was based on the eighth edition of the American Joint Committee on Cancer (AJCC) staging manual. The classification of lung adenocarcinoma was based on the 2011 International Association for the Study of Lung Cancer, American Thoracic Society, and European Respiratory Society classification system (IASLC/ATS/ERS).27,28 No patients had received neoadjuvant chemotherapy, radiotherapy, or EGFR-TKI before tumor resection or biopsy. The workflow diagram of the study is shown in Figure 1.
Tumor Sample Preparation and DNA Extraction and Mutation Analysis
Tumor samples were fixed in 10% neutral buffered formalin and embedded in paraffin wax. The paraffin-embedded tumor tissues were sliced into 4 μm sections on microtomes in preparation for hematoxylin–eosin (H&E) staining, molecular tests, and immunohistochemistry (IHC).
DNA was extracted from the archived formalin-fixed, paraffin-embedded tissue samples using a QIAamp DNA FFPE Tissue Kit (Qiagen NV, Venlo, the Netherlands) according to the protocol in the manufacturer’s instruction manual, and the concentration and purity of the extracted DNA were assessed using NanoDrop 2000 (Thermo Fisher Scientific, Waltham, MA, USA). Briefly, 10 sections of 4-μm-thick tumor tissues were cut from representative formalin-fixed, paraffin-embedded tissues selected for the assay, and, if necessary, macro-dissected to ensure a high percentage of tumor cells. Tissue sections were treated once with xylene, followed by one wash in ethanol. The pellet was resuspended in a tissue lysis buffer and treated with proteinase-K overnight at 56°C. DNA was extracted after the inactivation of proteinase-K by heating and tested with a proprietary detection kit, according to the protocol of the EGFR Mutations Detection Kit (Amoy Diagnostics, Xiamen, China). A polymerase chain reaction was performed using Mx3000PtM (Stratagene, La Jolla, USA), and positive or negative results were attained by meeting the criterion defined in the manufacturer’s instruction manual.
CT Imaging Acquisition and Tumor Segmentation
Chest CT examinations were performed with SOMATOM Definition AS (Siemens Healthcare, Florsheim, Germany). The scanning parameters were as follows: detector collimation width, 64 × 0.6 mm and 64 × 0.6 mm; tube voltage, 120 kV. The tube current was regulated by an automatic exposure control system (CARE Dose 4D; Siemens Healthcare). The chest CT images were reconstructed with a thickness of 1 mm and an interval of 1 mm. Two radiologists, blinded to all clinical and histologic data, interpreted CT studies retrospectively. One radiologist (7 years of experience in pulmonary CT) manually performed ROI semi-automatic segmentation on chest CT images using Radiomics in Rayplus.29 A senior radiologist (10 years of experience in pulmonary CT) and a senior oncologist (10 years of experience in lung cancer) reviewed all the lesions. Two radiologists and an oncologist negotiated to reach an agreement for controversial cases. The semi-automatic segmentation workflow consisted of 4 steps: preprocessing, semi-automatic correction of the pulmonary boundary, click and grow, and manual refinement.
Extraction and Selection of Radiomic Features
Radiomic feature extraction was performed after ROI segmentation. A total of 2300 features were calculated (Supplementary Table S1), including 92 unfiltered features (19 histogram features, 3 volumetric features, 13 morphologic features, and 57 texture features) and 2208 filtered features (92 features from Logarithm filter, 92 features from Exponential filter, 92 features from Laplacian of Gaussian (LoG) filter, 736 features from Wavelet filter, and 1196 features from Gabor filter) (Supplementary Table S2). In this work, three types of texture features on the basis of gray-level co-occurrence matrix (GLCM), gray-level size zone matrix (GLSZM) and gray-level run length matrix (GLRLM) were investigated. 25, 16, and 16 features were extracted from GLCM, GLSZM and GLRLM, respectively. Wavelet filter computed eight decompositions in each of the three dimensions with six kernel functions, and Gabor filter computed thirteen orientations on five scales. All radiomic features were extracted from Radiomics in Rayplus as well.
The radiomic features extracted were used to build radiomic models independently. The dataset was randomized into a training set and a test set with a ratio of 3:1. The RF-BFE algorithm was applied to select the radiomic features for building models. The binary logistics regression model of selected radiomic features was constructed and the RadScores (radiomics score) were calculated.
The main procedure of feature selection is illustrated in Figure 2. First, the whole dataset was shuffled, and the features were ranked by Random Forest (RF) importance measures. Then, least absolute shrinkage and selection operator (LASSO) regression was used iteratively to perform both regularization and accuracy calculation in the Backward Features Elimination (BFE) to gain a series of feature subsets, the process ending when further removals did not result in any improvement. Lastly, we gathered all the feature subsets in a feature counter, and the final feature subset was determined by hard voting with equal weight.
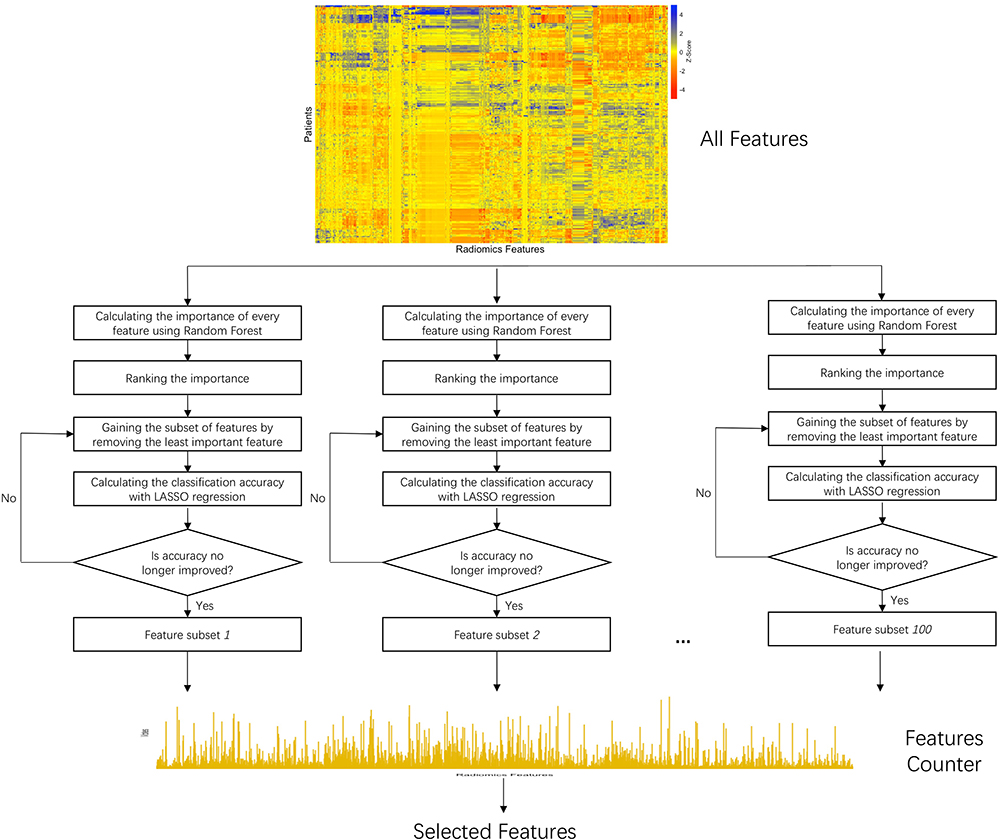 |
Figure 2 Procedure of the iterative RF-BFE algorithm and selection scheme. |
The RF importance measure of each feature was calculated in each iteration to provide more robust results. The detailed feature selection scheme in an iteration is illustrated in Figure 2. The least important feature was eliminated, and the updated features were then used to re-train the LASSO regression. The BFE process ended when there was no longer any improvement in the accuracy. The formula for achieving accuracy is obtained as follows:
Where TP, TN, FP, and FN represent true positive, true negative, false positive, and false negative, respectively.
We implemented 100 iterations in our study. We used a hard voting strategy to determine the final features after obtaining 100 subsets of the features. All the selected features were gathered in a feature counter. The vote with equal weight for each feature revealed the stability of the feature (Figure 2). The final feature subset (Fs) with k features was determined as follows:


Where Fsub is the set of features addressed in all subsets; νf is the vote of the feature; ν0 is the threshold. The νf and ν0 ranged from 0 to 100As, given that we used 100 iterations. In the experiment, we set the threshold of ν0 at 70.
Study Oversight
The study was approved by the Ethics Committee of Union Hospital, Tongji Medical College, Huazhong University of Science and Technology. It was conducted in accordance with the Declaration of Helsinki and Good Clinical Practice guidelines. All patients provided written informed consent prior to their inclusion in the study.
Statistics
First, the chi-square test and Fisher’s exact test were used to analyze variables describing clinicopathological characteristics. Second, the differences in the radiomic variables extracted from CT images between EGFR mutation status and subtypes were assessed with R software version 4.0.3 (https://www.r-project.org). The “glmnet” package was used to perform LASSO logistic regression analysis and binary logistics regression model. The “ggplot” package was used in the creation of ROC curves and the calculation and comparisons of AUCs. The “ggpubr” package was used in the comparisons of RadScores. A two-sided P-value <0.05 was accepted as indicative of statistical significance.
Results
Clinical Characteristics of Patients
Among the 369 cases of primary lung adenocarcinoma, a total of 233 cases of primary lung adenocarcinoma with EGFR mutant and wild type were finally included in this study. There were 129 cases (55.4%) with EGFR mutant and 104 cases (44.6%) with wild type (Table 1). There were 55 cases (42.6%) with exon 19 and 74 cases (57.4%) with exon 21 in EGFR mutant group (Table 2). The patient flow diagram in the study is shown in Figure 3. The patients were randomly divided into the training and test cohorts. In the training cohort, there were significant differences (P < 0.01) in sex, smoking status, maximum diameter and growth pattern between the EGFR mutant and wild type. In the test cohort, there were significant differences (P < 0.05) in sex, smoking status, TNM staging and growth pattern between the EGFR mutation and wild type. No significant difference in EGFR mutation subtypes between exon 19 and exon 21 was found in the training and test cohort (P > 0.05).
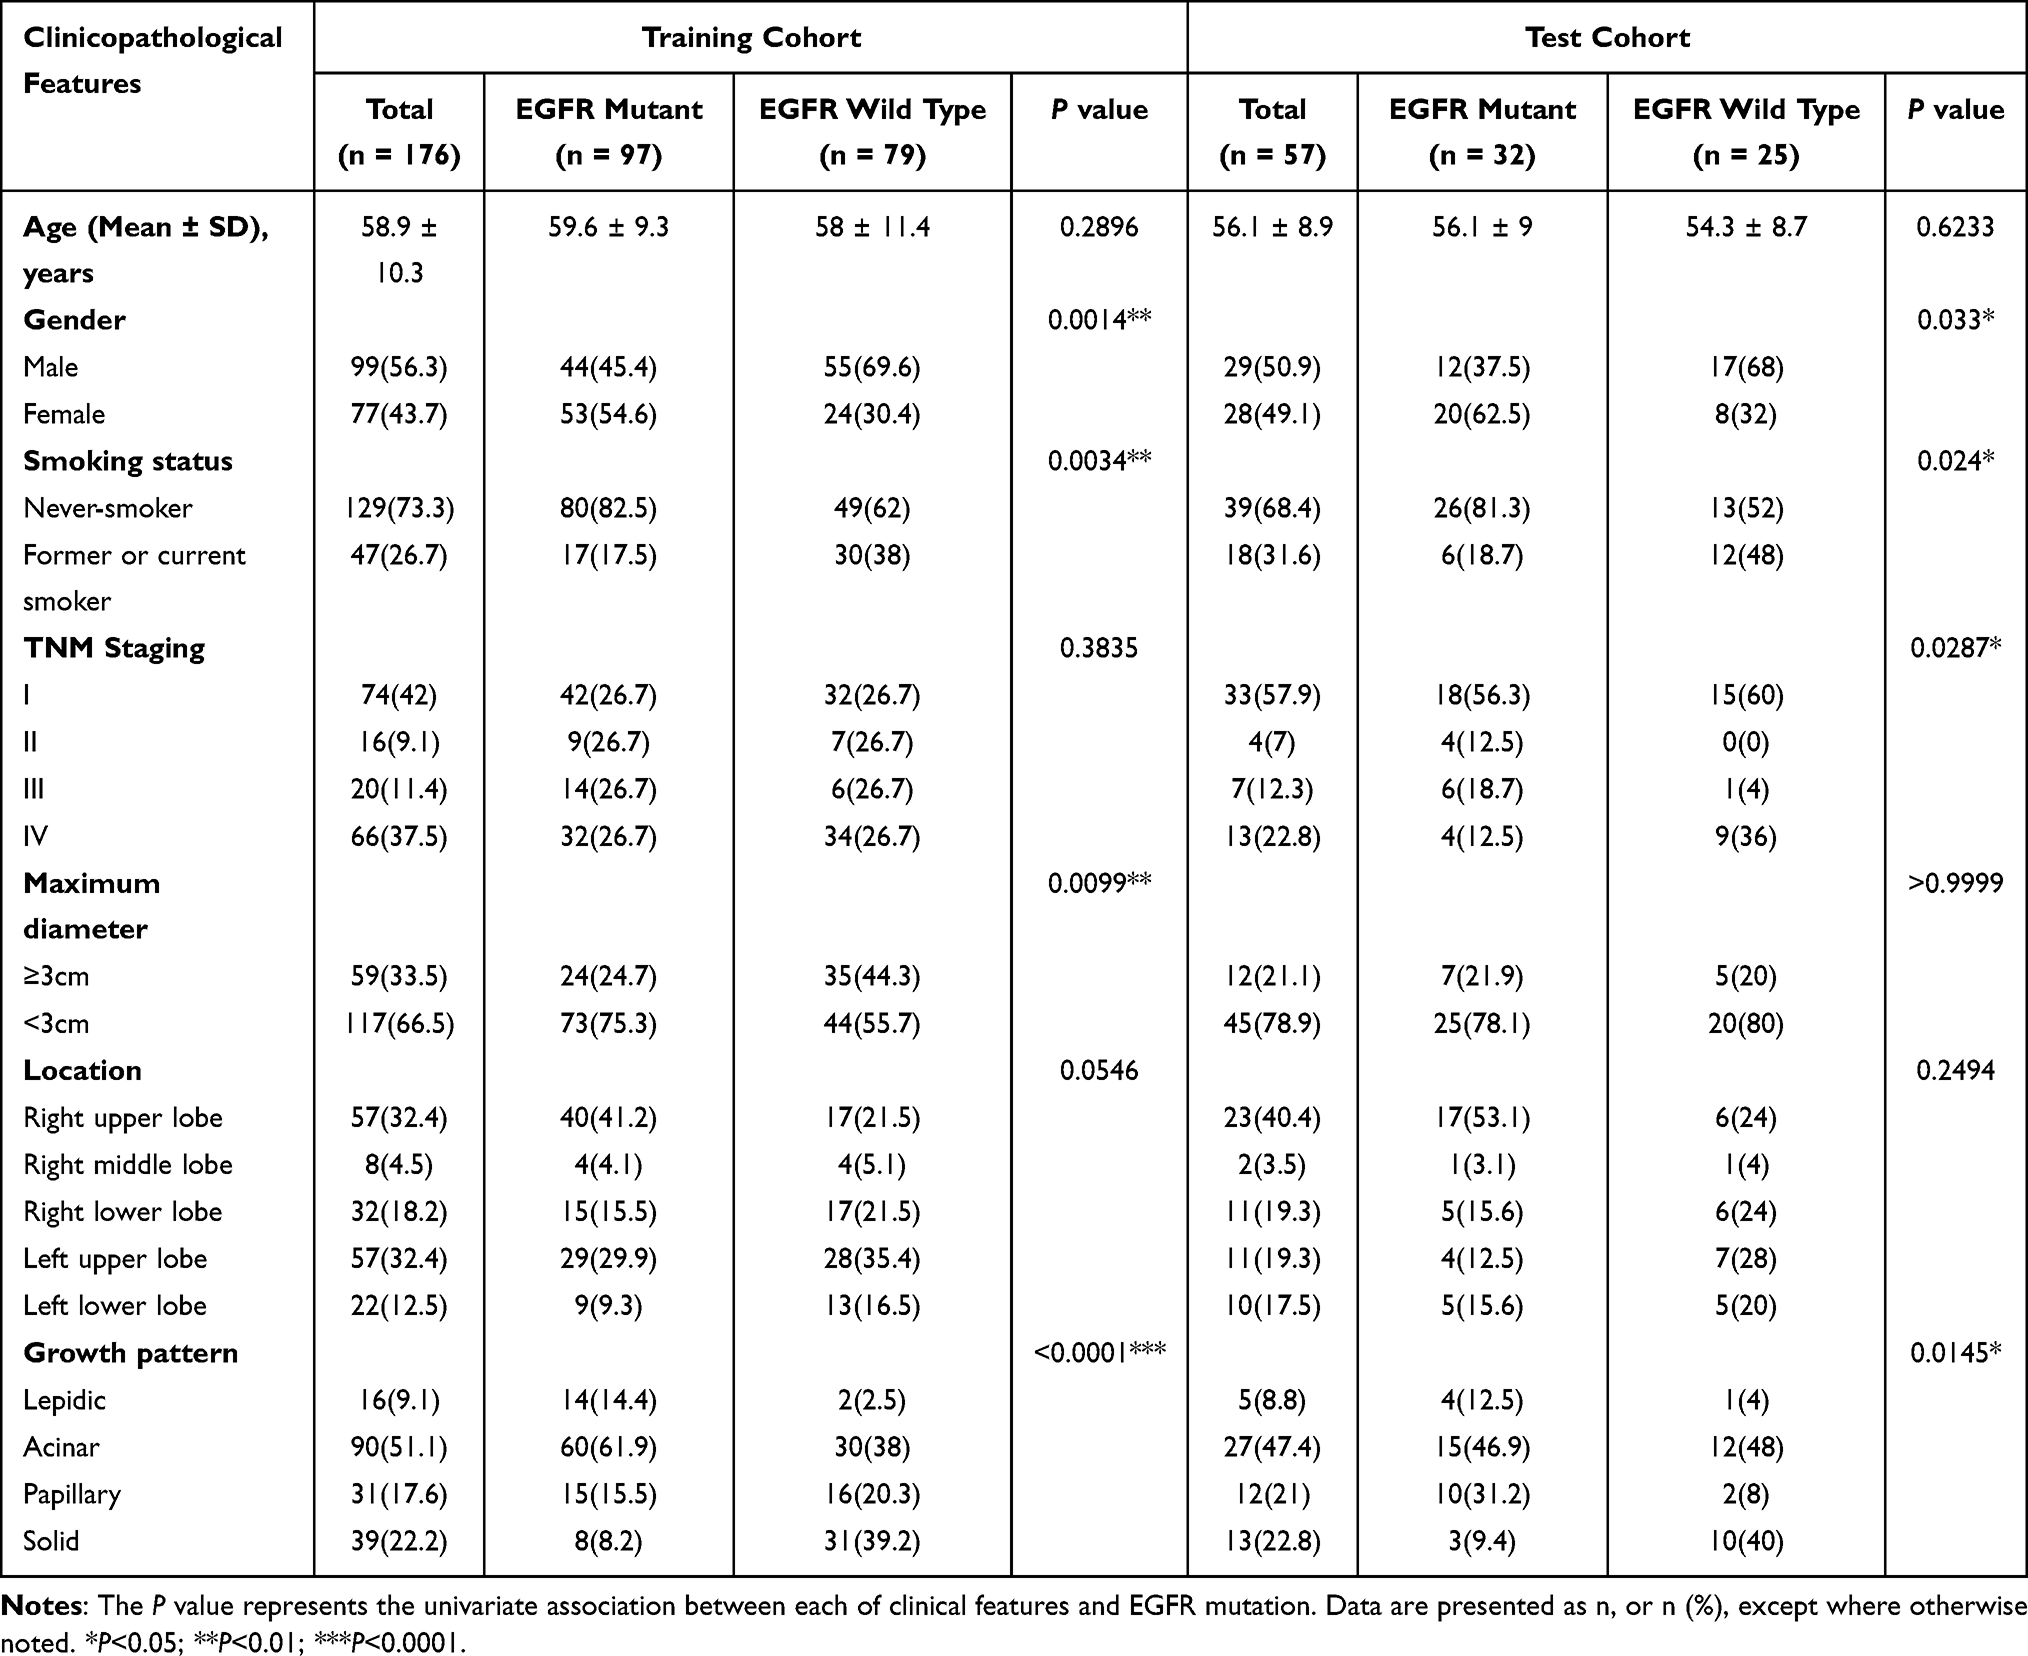 |
Table 1 Clinicopathological Features of EGFR Mutant and EGFR Wild Type Patients Between Training Cohort and Test Cohort |
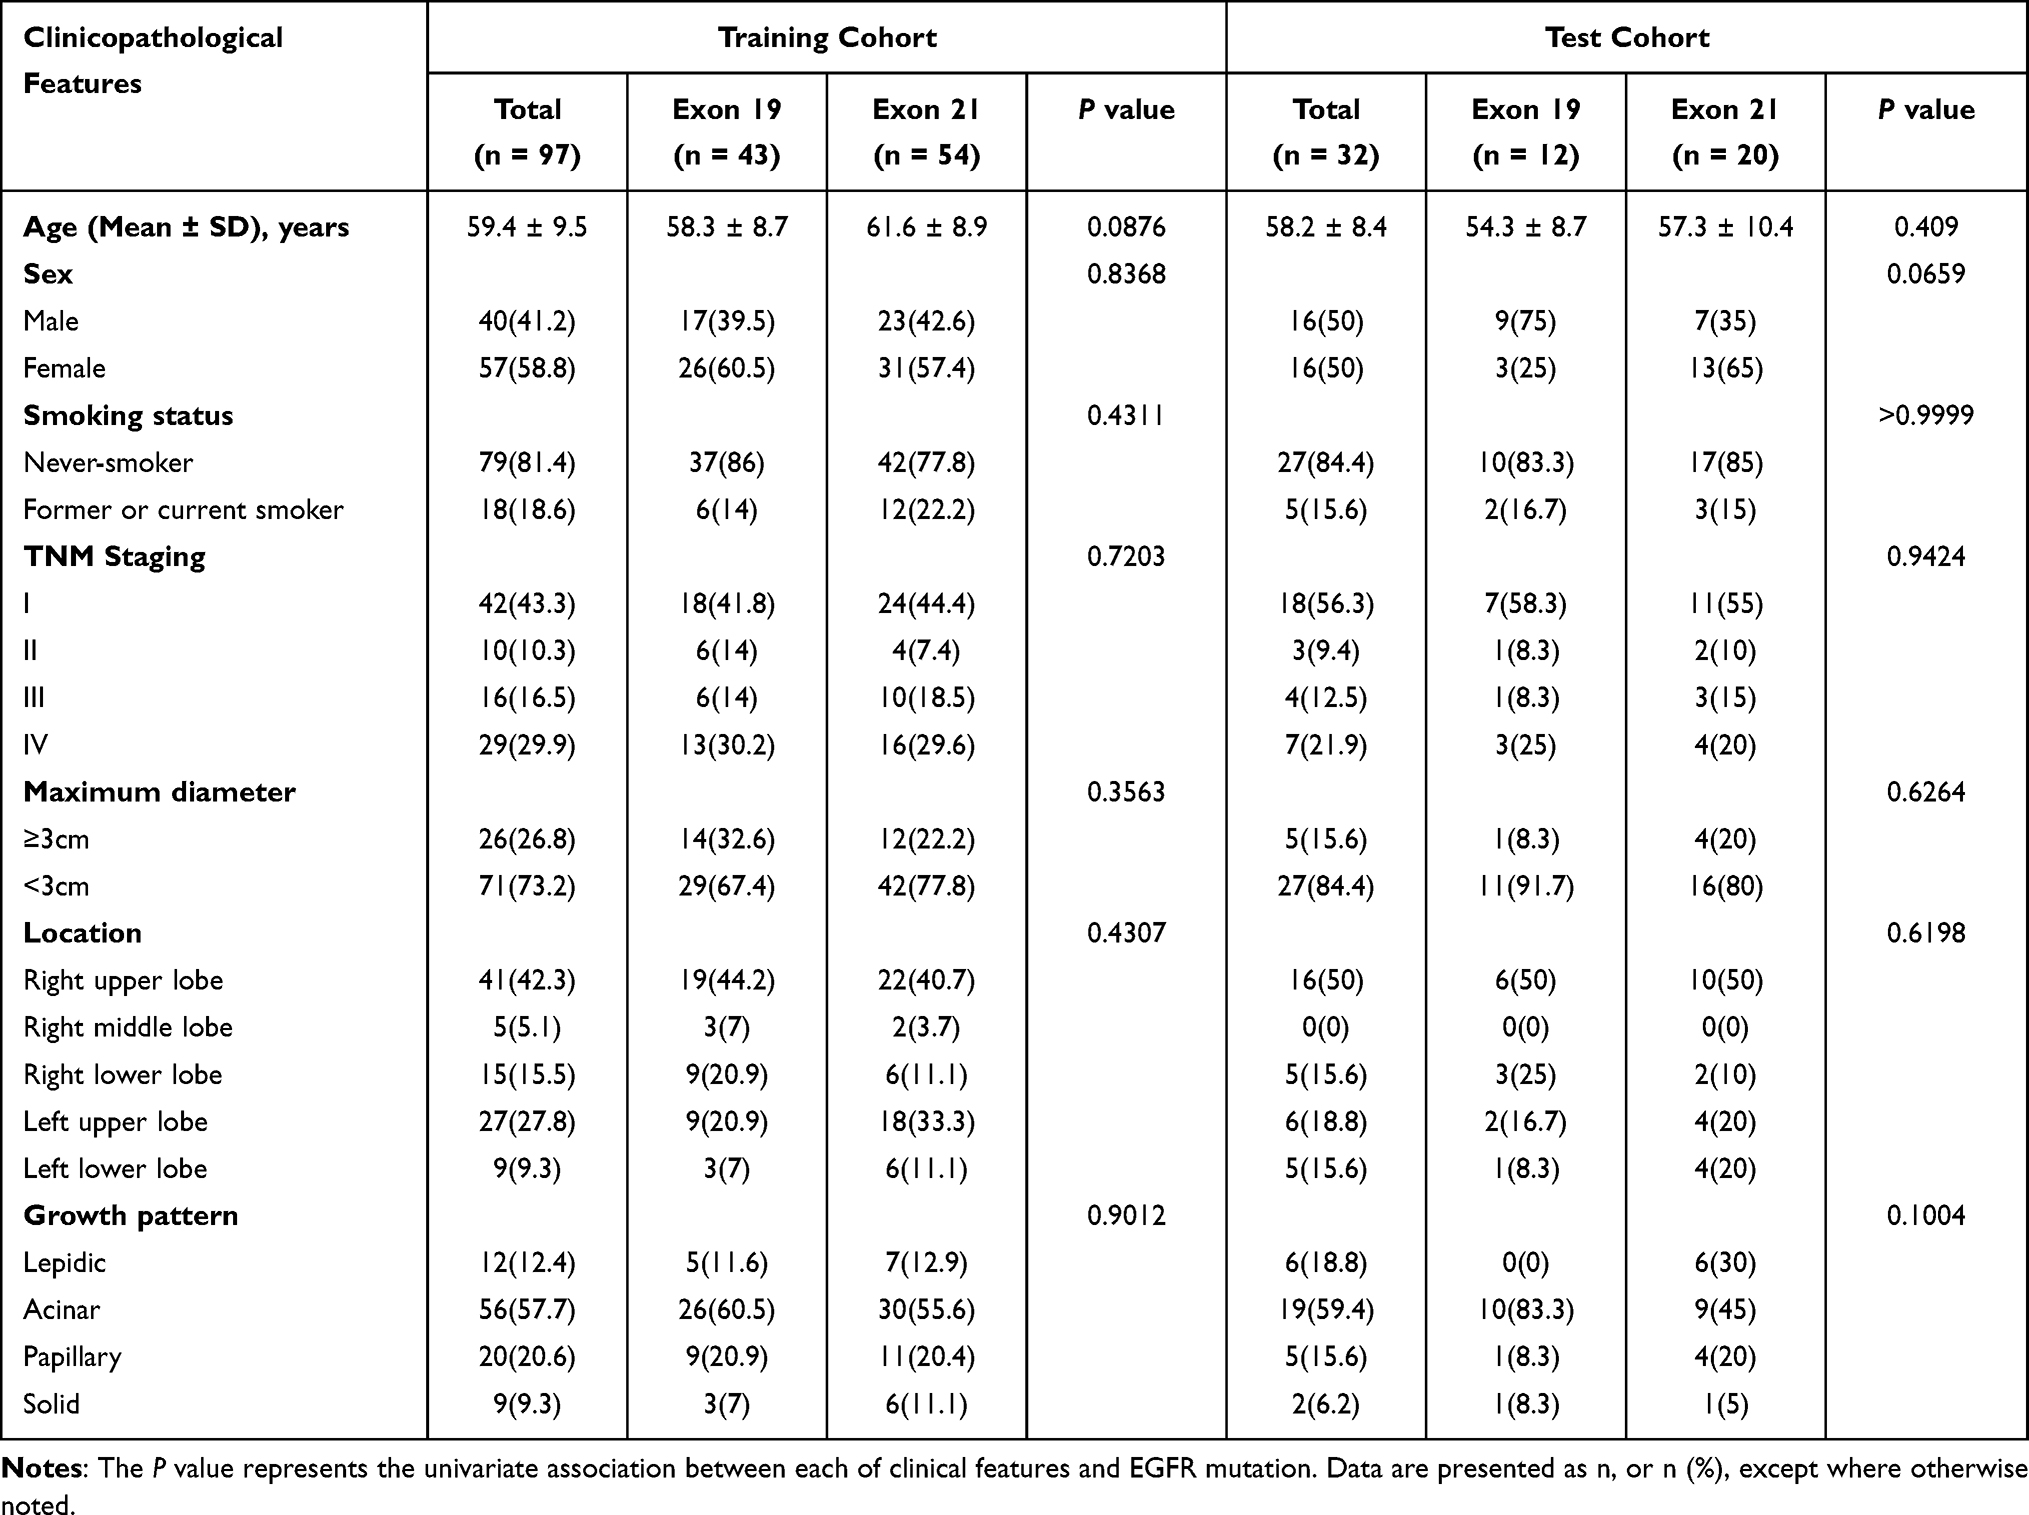 |
Table 2 Clinicopathological Features of Exon 19 and Exon 21 Mutation Patients Between Training Cohort and Test Cohort |
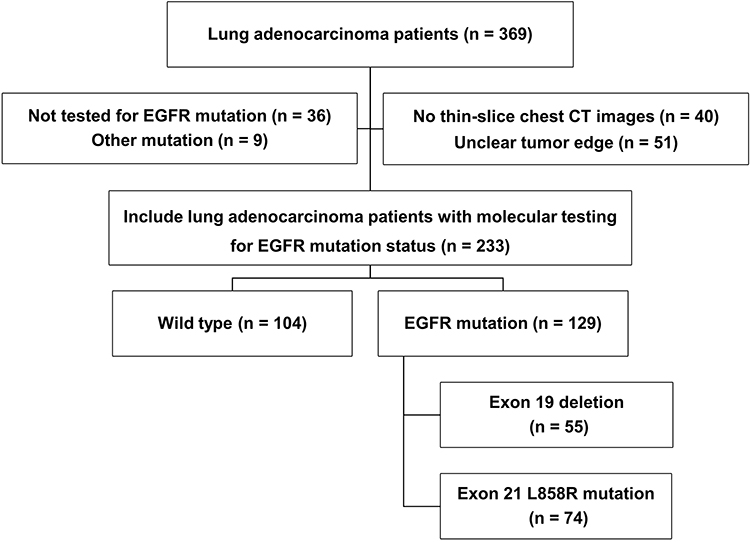 |
Figure 3 Patient selection workflow of the study cohort. |
Radiomics Predictor
The histogram of the votes in the feature counter is shown in Figure 4. A set of 10 features were selected to predict EGFR mutation status between EGFR mutant and wild type (Table 3), while 9 selected features were used to predict EGFR mutation subtypes between exon 19 and exon 21 (Table 4). ROC analysis and AUC measurements were used to quantify the predictor’s ability to differentiate EGFR mutation status in the training and test cohorts. The RadScore was generated by using a logistic regression model based on selected features. To predict EGFR mutation status, the AUC of the training cohort was 0.778 and the AUC of the test cohort was 0.765 (Figure 5). To predict EGFR mutation subtypes, the AUC of the training cohort was 0.725 and the AUC of the test cohort was 0.657 (Figure 6).
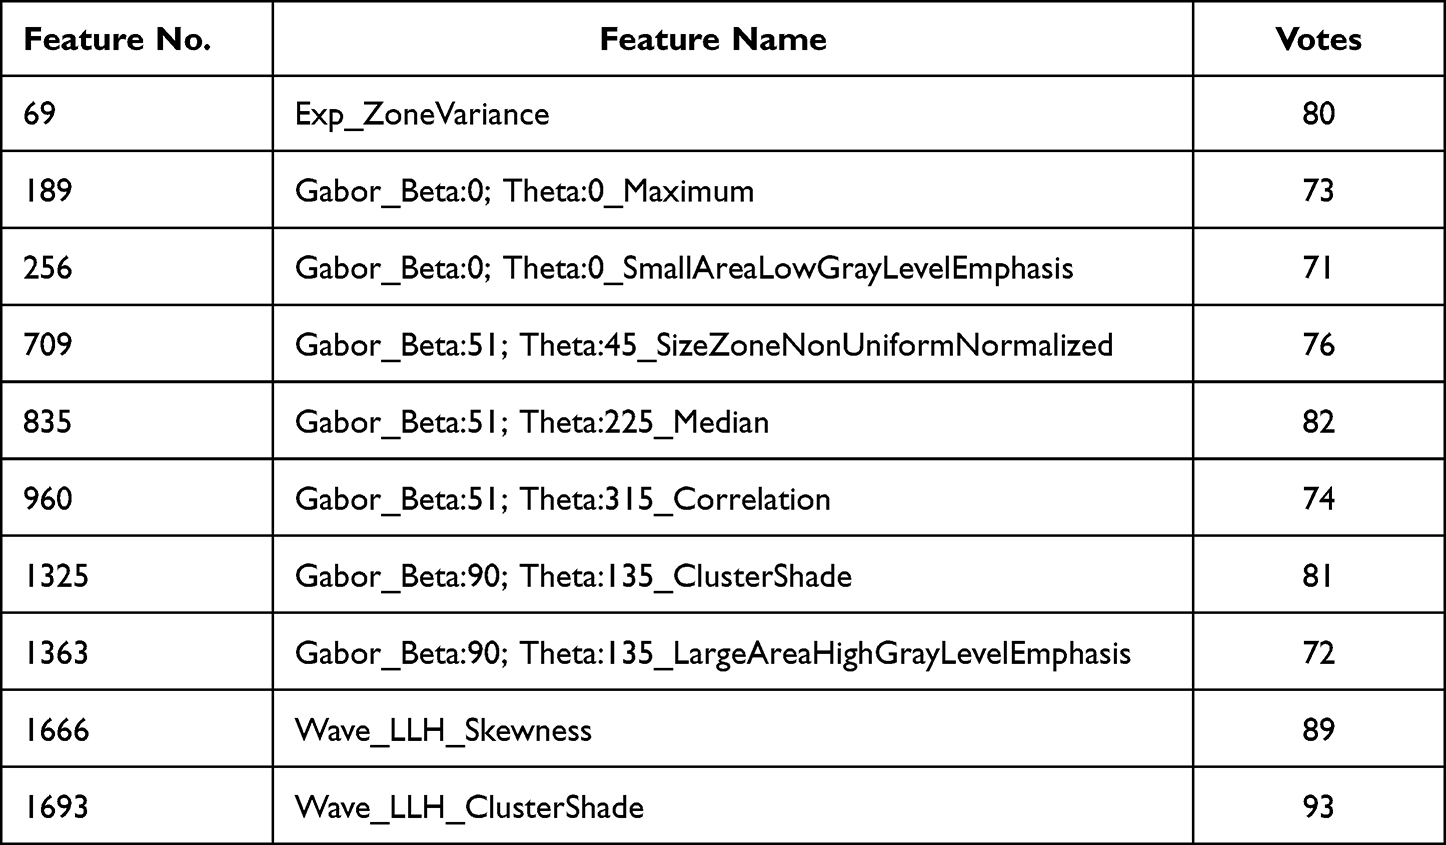 |
Table 3 Selected Features for the Predictor of EGFR Mutant and EGFR Wild Type |
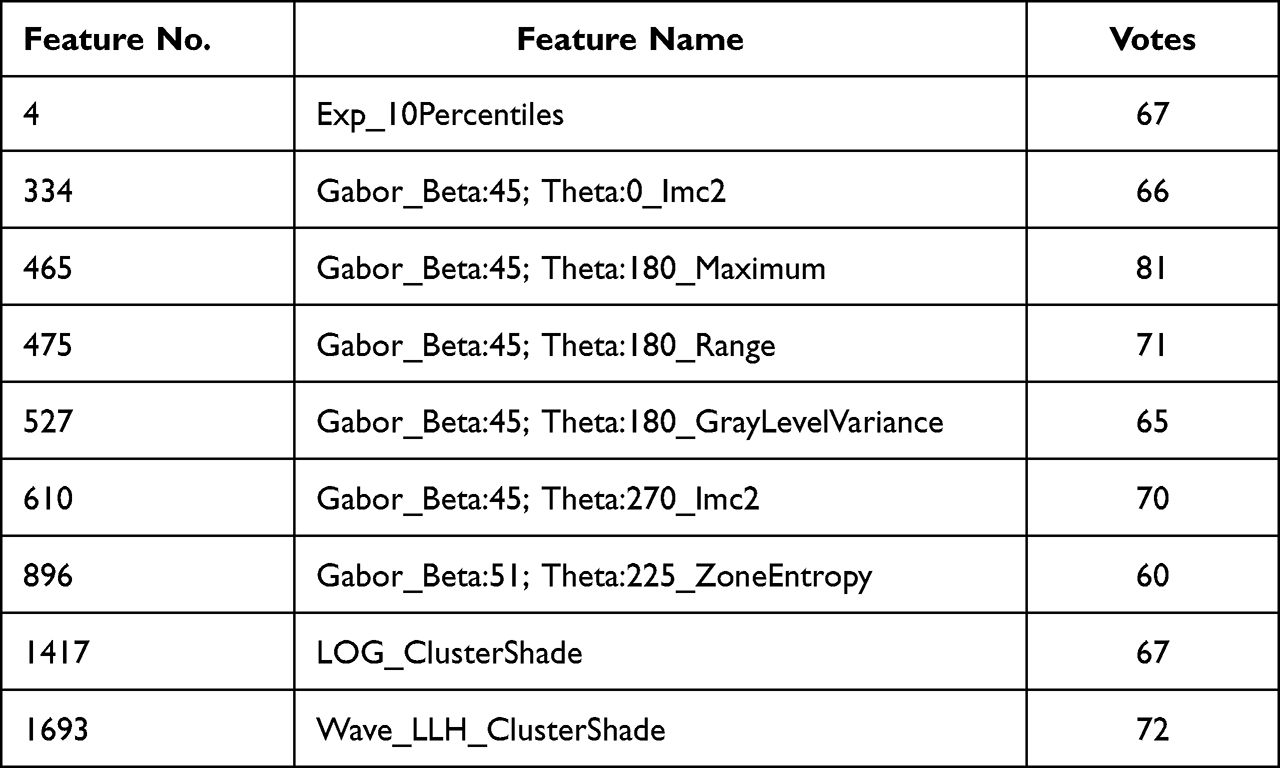 |
Table 4 Selected Features for the Predictor of EGFR Mutation Subtypes Between Exon 19 and Exon 21 |
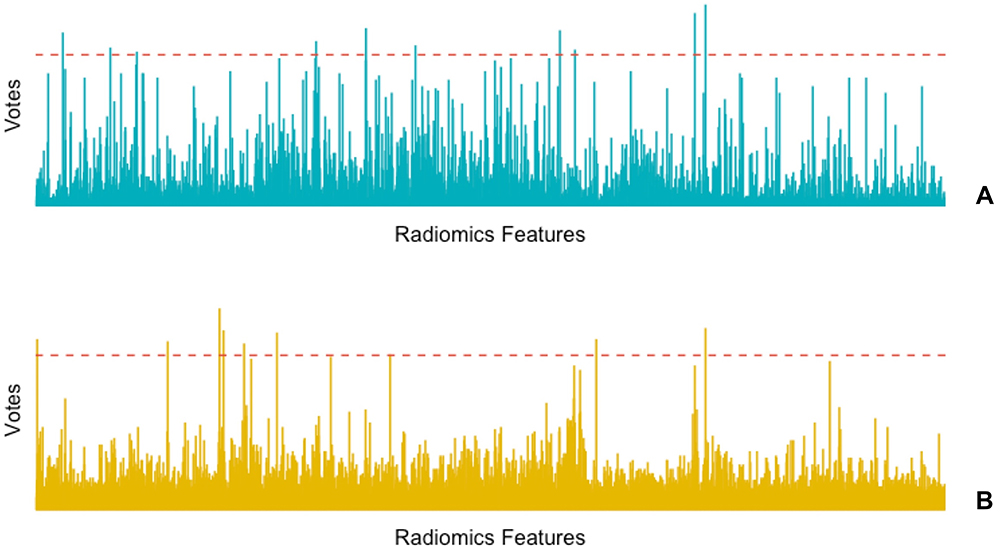 |
Figure 4 Histogram of the votes in the feature counter. (A) The feature counter for EGFR mutant and EGFR wild Type. (B) The feature counter for EGFR Exon 19 and Exon 21. |
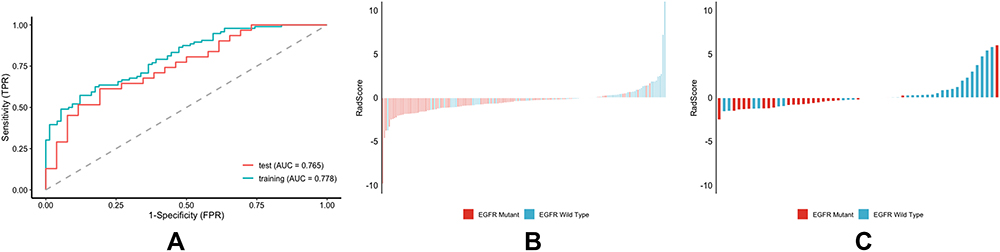 |
Figure 5 Performance of the predictor of EGFR mutant and EGFR wild type. (A) ROC curve of the training cohort and validation cohort. (B) RadScore of the training cohort. (C) RadScore of the validation cohort. |
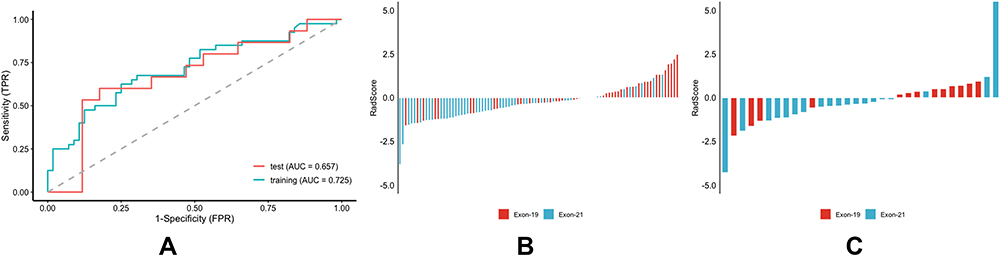 |
Figure 6 Performance of the predictor of EGFR mutation subtypes between exon 19 and exon 21. (A) ROC curve of the training cohort and validation cohort. (B) RadScore of the training cohort. (C) RadScore of the validation cohort. |
Moreover, we established an integrated model by using logistic regression that combined radiomic and clinicopathological features (including age, gender, smoking status, TNM staging, maximum diameter, location, and growth pattern) to predict the EGFR mutation status and mutation subtypes. To predict the EGFR mutation status, the AUC of training cohort was 0.87 and the AUC of test cohort was 0.759. To predict the EGFR mutation subtypes, the AUC of training cohort was 0.797 and the AUC of test cohort was 0.554 (Figure 7).
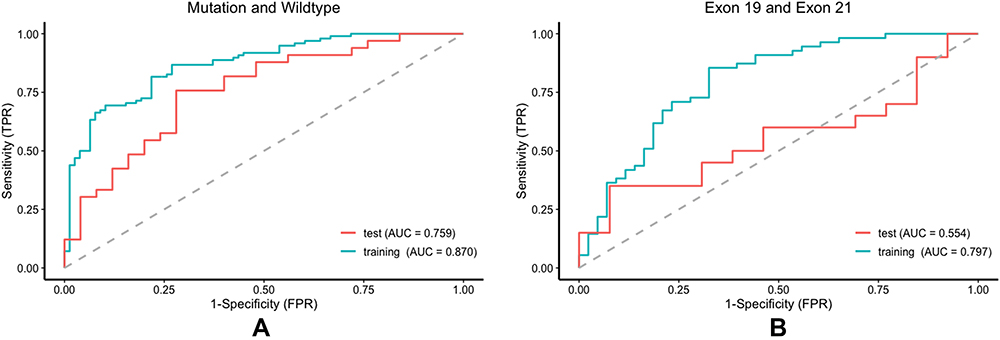 |
Figure 7 Performance of the predictor with combined radiomic features and clinical characteristics of EGFR mutation status and subtypes. (A) ROC curve of the training cohort and validation cohort between EGFR mutant and wild type. (B) ROC curve of the training cohort and validation cohort between exon 19 and exon 21. |
Significant differences were found between the high- and low-RadScore patients with EGFR mutation status and subtypes. The predictor of EGFR mutation status showed better performance than the predictor of EGFR mutation subtypes.
Discussion
In our study, we have established a predictive model of radiomics. A set of 10 radiomic features were selected to predict EGFR mutation status between EGFR mutant and wild type. The predictive model of radiomics showed good performance in identifying EGFR mutation in the training and test cohort (AUC >0.75). Moreover, a set of 9 selected features were used to predict EGFR mutation subtypes between exon 19 and exon 21. The radiomic model predicted the EGFR mutation subtypes: the AUC of the training cohort was 0.725, and the AUC of the test cohort was 0.657. The AUC of the test cohort is not high, which may be related to the fact that there were fewer cases with EGFR mutation subtypes. We have also established an integrated model that combines radiomics and clinicopathological features (including age, gender, smoking status, TNM staging, maximum diameter, location, growth pattern) to predict the EGFR mutation status and subtypes. The integrated model showed good performance with prediction of higher AUC (the AUC of the training and test cohorts are 0.870 and 0.759, respectively) to identify EGFR mutation status. The integrated model improved the prediction (AUC of 0.797) to identify EGFR mutation subtypes in the training cohort. However, the AUC in the test cohort was 0.554, which again may be related to the smaller number of cases of exon 19 and exon 21. Yip et al described an AUC of 0.67 for predicting EGFR mutation status.30 Liu et al provide a system model (AUC of 0.709) to clarify the EGFR mutation status.31 In addition, an integrated model was applied to the training cohort to identify EGFR mutation status (AUC, from 0.73 to 0.78) and mutation subtypes between EGFR exon 19 and exon 21 (AUC, from 0.65 to 0.78).32 Compared with the previous studies, using an integrated model in the study can make significant improvements in predicting EGFR mutation status and subtypes.
We used a novel algorithm to select stable sets of radiomic features for the predictive models. Compared with previous studies, the repeatability and reproducibility of selected features make our models less volatile and improves their generalizability. Most of the selected features from Wavelet and Gabor filtered images highlighte the regional heterogeneity in cancer lesions, as the Wavelet and Gabor filtering decomposes images into high frequency (heterogeneity) and low frequency (homogeneity) for the tumoral regions. This confirms the results of previous radiomics research.
Several studies have indicated that EGFR mutation is strongly related to the female, never-smoker, adenocarcinoma history, and East Asian populations.33–35 Some prior studies included clinical features to establish the predictive model with EGFR mutation. In our study, female, never-smokers, and maximum diameter <3cm with lung adenocarcinoma had significantly higher EGFR mutation rates than male, smokers, and maximum diameter ≥3 cm, which is consistent with the conclusions of most studies.33–35 Moreover, we found that most lung adenocarcinoma lesions in this study are mainly located in the upper lobes, especially in the right lobe. Some theories had explained this phenomenon: (I) Due to less ventilation or lower lymphatic clearance, carcinogens or toxins are more likely to be deposited in the upper lobe; (II) The higher tissue PO2 levels in the upper lobe may contribute to tumorigenesis.35 Furthermore, compared with patients with advanced stage NSCLC, the incidence of EGFR mutations in early-stage NSCLC patients is significantly higher. Additionally, the growth pattern of lesions was associated with EGFR mutation status. These findings were consistent with previous studies.32,36
The main advantage of this study is the development of non-invasive prediction models (a radiomic model and an integrated model) for EGFR mutation status and subtypes with lung adenocarcinoma. We divided the EGFR mutation status and subtypes into two steps: (I) we selected highly specific radiomic features to identify the EGFR mutation status (EGFR mutant or wild type); (II) highly specific radiomic features were selected to identify the EGFR mutation subtypes (exon 19 or exon 21). As far as we know, most studies have focused on the association between radiomics and EGFR mutation status.11,31,36 Some studies only focus on predicting the correlation of EGFR mutation subtypes using radiomics.36 In addition, some studies related to radiomics only extract relatively few features for analysis.31,32,36 In this study, 2300 radiomic features were extracted to assess the ability to predict the EGFR mutation status. Most studies use data from different CT machines from different manufacturers, which will lead to deviations in reconstruction algorithms and spatial resolution.32 In this study, all cases used the same CT machine for chest CT imaging, which can avoid data deviations from different manufacturers and models.
Several limitations can influence the results of this study, and improvements can be made in the following aspects. (I) This study was a retrospective study performed in a single medical center. A prospective study with a large patient cohort would be required to confirm our observations. (II) Only CT image features were used in this study. Multimodal imaging (such as PET/CT) can provide more lesion features to optimize performance. (III) Radiomic features were derived from semi-automatic segmentation by radiologists, which can be influenced by observers’ subjectivity. (IV) The number of cases was not sufficiently large, so some multi-center studies are needed in the future.
Conclusion
In conclusion, based on radiomic features of chest CT imaging, we can extract information on tumor heterogeneity in lung adenocarcinoma. In addition, we have established a radiomic model and an integrated model to non-invasively predict the EGFR mutation status and subtypes of lung adenocarcinoma, which is conducive to saving clinical costs and guiding targeted therapy.
Abbreviations
NSCLC, non-small-cell lung cancer; CT, computed tomography; EGFR, epidermal growth factor receptor; EGFR-TKI, EGFR-tyrosine kinase inhibitors; exon 19, exon 19 deletion; exon 21, exon 21 L858R mutation; PFS, progression-free survival; DICOM, Digital Imaging and Communications in Medicine; AJCC, American Joint Committee on Cancer; IASLC/ATS/ERS, International Association for the Study of Lung Cancer, American Thoracic Society, and European Respiratory Society classification system; H&E, hematoxylin-eosin; IHC, immunohistochemistry; AUC, areas under the curve; LoG, Laplacian of Gaussian; GLCM, gray-level co-occurrence matrix; GLSZM, gray-level size zone matrix; GLRLM, gray-level run length matrix; RF, Random Forest; LASSO, least absolute shrinkage and selection operator; BFE, Backward Features Elimination; RadScore, radiomics score; TP, true positive; TN, true negative; FP, false positive; FN, false negative.
Acknowledgment
Ruiguang Zhang is the corresponding author and Rong Yuan is the co-corresponding author.
Disclosure
The authors report no conflicts of interest in this work.
References
1. Sung H, Ferlay J, Siegel RL, et al. Global cancer statistics 2020: GLOBOCAN estimates of incidence and mortality worldwide for 36 cancers in 185 countries. CA Cancer J Clin. 2021;71:209–249. doi:10.3322/caac.21660
2. Dong S, Men W, Yang S, Xu S. Identification of lung adenocarcinoma biomarkers based on bioinformatic analysis and human samples. Oncol Rep. 2020;43:1437–1450. doi:10.3892/or.2020.7526
3. Travis WD, Brambilla E, Nicholson AG, et al. The 2015 World Health Organization classification of lung tumors: impact of genetic, clinical and radiologic advances since the 2004 classification. J Thorac Oncol. 2015;10:1243–1260. doi:10.1097/JTO.0000000000000630
4. Balagurunathan Y, Gu Y, Wang H, et al. Reproducibility and prognosis of quantitative features extracted from CT images. Transl Oncol. 2014;7:72–87. doi:10.1593/tlo.13844
5. Panth KM, Leijenaar RT, Carvalho S, et al. Is there a causal relationship between genetic changes and radiomics-based image features? An in vivo preclinical experiment with doxycycline inducible GADD34 tumor cells. Radiother Oncol. 2015;116:462–466. doi:10.1016/j.radonc.2015.06.013
6. Stewart EL, Tan SZ, Liu G, Tsao MS. Known and putative mechanisms of resistance to EGFR targeted therapies in NSCLC patients with EGFR mutations-a review. Transl Lung Cancer Res. 2015;4:67–81. doi:10.3978/j.issn.2218-6751.2014.11.06
7. Coroller TP, Grossmann P, Hou Y, et al. CT-based radiomic signature predicts distant metastasis in lung adenocarcinoma. Radiother Oncol. 2015;114:345–350. doi:10.1016/j.radonc.2015.02.015
8. Fried DV, Tucker SL, Zhou S, et al. Prognostic value and reproducibility of pretreatment CT texture features in stage III non-small cell lung cancer. Int J Radiat Oncol Biol Phys. 2014;90:834–842. doi:10.1016/j.ijrobp.2014.07.020
9. Parmar C, Rios Velazquez E, Leijenaar R, et al. Robust radiomics feature quantification using semiautomatic volumetric segmentation. PLoS One. 2014;9:e102107. doi:10.1371/journal.pone.0102107
10. Hendriks LE, Derks JL, Postmus PE, et al. Single organ metastatic disease and local disease status, prognostic factors for overall survival in stage IV non-small cell lung cancer: results from a population-based study. Eur J Cancer. 2015;51:2534–2544. doi:10.1016/j.ejca.2015.08.008
11. Rizzo S, Petrella F, Buscarino V, et al. CT radiogenomic characterization of EGFR, K-RAS, and ALK mutations in non-small cell lung cancer. Eur Radiol. 2016;26:32–42. doi:10.1007/s00330-015-3814-0
12. Yoon HY, Ryu JS, Sim YS, et al. Clinical significance of EGFR mutation types in lung adenocarcinoma: a multi-centre Korean study. PLoS One. 2020;15:e0228925. doi:10.1371/journal.pone.0228925
13. Choi YW, Jeon SY, Jeong GS, et al. EGFR Exon 19 deletion is associated with favorable overall survival after first-line gefitinib therapy in advanced non-small cell lung cancer patients. Am J Clin Oncol. 2018;41:385–390. doi:10.1097/COC.0000000000000282
14. Rossi S, Toschi L, Finocchiaro G, et al. Impact of Exon 19 deletion subtypes in EGFR-mutant metastatic non-small-cell lung cancer treated with first-line tyrosine kinase inhibitors. Clin Lung Cancer. 2019;20:82–87. doi:10.1016/j.cllc.2018.10.009
15. Wu W, Parmar C, Grossmann P, et al. Exploratory study to identify radiomics classifiers for lung cancer histology. Front Oncol. 2016;6:71. doi:10.3389/fonc.2016.00071
16. Mackin D, Fave X, Zhang L, et al. Harmonizing the pixel size in retrospective computed tomography radiomics studies. PLoS One. 2017;12:e0178524. doi:10.1371/journal.pone.0178524
17. Antropova N, Huynh BQ, Giger ML. A deep feature fusion methodology for breast cancer diagnosis demonstrated on three imaging modality datasets. Med Phys. 2017;44:5162–5171. doi:10.1002/mp.12453
18. Wong CW, Chaudhry A. Radiogenomics of lung cancer. J Thorac Dis. 2020;12:5104–5109. doi:10.21037/jtd-2019-pitd-10
19. Lee HJ, Kim YT, Kang CH, et al. Epidermal growth factor receptor mutation in lung adenocarcinomas: relationship with CT characteristics and histologic subtypes. Radiology. 2013;268:254–264. doi:10.1148/radiol.13112553
20. Gu Y, Kumar V, Hall LO, et al. Automated delineation of lung tumors from CT images using a single click ensemble segmentation approach. Pattern Recognit. 2013;46:692–702. doi:10.1016/j.patcog.2012.10.005
21. Dingemans AM, Groen HJ, Herder GJ, et al. A randomized Phase II study comparing paclitaxel-carboplatin-bevacizumab with or without nitroglycerin patches in patients with stage IV nonsquamous nonsmall-cell lung cancer: NVALT12 (NCT01171170) dagger. Ann Oncol. 2015;26:2286–2293. doi:10.1093/annonc/mdv370
22. Larue R, van Timmeren JE, de Jong EEC, et al. Influence of gray level discretization on radiomic feature stability for different CT scanners, tube currents and slice thicknesses: a comprehensive phantom study. Acta Oncol. 2017;56:1544–1553. doi:10.1080/0284186X.2017.1351624
23. Shafiq-Ul-Hassan M, Zhang GG, Latifi K, et al. Intrinsic dependencies of CT radiomic features on voxel size and number of gray levels. Med Phys. 2017;44:1050–1062. doi:10.1002/mp.12123
24. Aerts HJ, Grossmann P, Tan Y, et al. Defining a radiomic response phenotype: a pilot study using targeted therapy in NSCLC. Sci Rep. 2016;6:33860. doi:10.1038/srep33860
25. Zhang Y, Oikonomou A, Wong A, Haider MA, Khalvati F. Radiomics-based prognosis analysis for non-small cell lung cancer. Sci Rep. 2017;7:46349. doi:10.1038/srep46349
26. Zhou JY, Zheng J, Yu ZF, et al. Comparative analysis of clinicoradiologic characteristics of lung adenocarcinomas with ALK rearrangements or EGFR mutations. Eur Radiol. 2015;25:1257–1266. doi:10.1007/s00330-014-3516-z
27. Eberhardt WE, Mitchell A, Crowley J, et al. The IASLC lung cancer staging project: proposals for the revision of the M descriptors in the forthcoming eighth edition of the TNM classification of lung cancer. J Thorac Oncol. 2015;10:1515–1522. doi:10.1097/JTO.0000000000000673
28. Goldstraw P, Chansky K, Crowley J, et al. The IASLC lung cancer staging project: proposals for revision of the TNM stage groupings in the forthcoming (eighth) edition of the TNM classification for lung cancer. J Thorac Oncol. 2016;11:39–51. doi:10.1016/j.jtho.2015.09.009
29. Yuan R, Shi S, Chen J, Cheng G. Radiomics in rayplus: a web-based tool for texture analysis in medical images. J Digit Imaging. 2019;32:269–275. doi:10.1007/s10278-018-0128-1
30. Yip SS, Kim J, Coroller TP, et al. Associations between somatic mutations and metabolic imaging phenotypes in non-small cell lung cancer. J Nucl Med. 2017;58:569–576. doi:10.2967/jnumed.116.181826
31. Liu Y, Kim J, Balagurunathan Y, et al. Radiomic features are associated with EGFR mutation status in lung adenocarcinomas. Clin Lung Cancer. 2016;17:441–448 e446. doi:10.1016/j.cllc.2016.02.001
32. Liu G, Xu Z, Ge Y, et al. 3D radiomics predicts EGFR mutation, exon-19 deletion and exon-21 L858R mutation in lung adenocarcinoma. Transl Lung Cancer Res. 2020;9:1212–1224. doi:10.21037/tlcr-20-122
33. Fukuoka M, Wu YL, Thongprasert S, et al. Biomarker analyses and final overall survival results from a Phase III, randomized, open-label, first-line study of gefitinib versus carboplatin/paclitaxel in clinically selected patients with advanced non-small-cell lung cancer in Asia (IPASS). J Clin Oncol. 2011;29:2866–2874. doi:10.1200/JCO.2010.33.4235
34. Zhou C, Wu YL, Chen G, et al. Erlotinib versus chemotherapy as first-line treatment for patients with advanced EGFR mutation-positive non-small-cell lung cancer (OPTIMAL, CTONG-0802): a multicentre, open-label, randomised, Phase 3 study. Lancet Oncol. 2011;12:735–742. doi:10.1016/S1470-2045(11)70184-X
35. Tseng CH, Chen KC, Hsu KH, et al. EGFR mutation and lobar location of lung adenocarcinoma. Carcinogenesis. 2016;37:157–162. doi:10.1093/carcin/bgv168
36. Tu W, Sun G, Fan L, et al. Radiomics signature: a potential and incremental predictor for EGFR mutation status in NSCLC patients, comparison with CT morphology. Lung Cancer. 2019;132:28–35. doi:10.1016/j.lungcan.2019.03.025
 © 2022 The Author(s). This work is published and licensed by Dove Medical Press Limited. The
full terms of this license are available at https://www.dovepress.com/terms
and incorporate the Creative Commons Attribution
- Non Commercial (unported, 3.0) License.
By accessing the work you hereby accept the Terms. Non-commercial uses of the work are permitted
without any further permission from Dove Medical Press Limited, provided the work is properly
attributed. For permission for commercial use of this work, please see paragraphs 4.2 and 5 of our Terms.
© 2022 The Author(s). This work is published and licensed by Dove Medical Press Limited. The
full terms of this license are available at https://www.dovepress.com/terms
and incorporate the Creative Commons Attribution
- Non Commercial (unported, 3.0) License.
By accessing the work you hereby accept the Terms. Non-commercial uses of the work are permitted
without any further permission from Dove Medical Press Limited, provided the work is properly
attributed. For permission for commercial use of this work, please see paragraphs 4.2 and 5 of our Terms.