Back to Journals » Eye and Brain » Volume 14
Effects of tACS-Like Electrical Stimulation on Off- and On-Off Center Retinal Ganglion Cells: Part II
Received 27 March 2021
Accepted for publication 30 November 2021
Published 25 January 2022 Volume 2022:14 Pages 17—33
DOI https://doi.org/10.2147/EB.S313090
Checked for plagiarism Yes
Review by Single anonymous peer review
Peer reviewer comments 3
Editor who approved publication: Professor Margaret Wong-Riley
Christianne E Strang, Franklin R Amthor
Department of Psychology, The University of Alabama at Birmingham, Birmingham, AL, 35294-1170, USA
Correspondence: Franklin R Amthor
Department of Psychology, The University of Alabama at Birmingham, Birmingham, AL, 35294-1170, USA, Tel +1 205 934-2694, Fax +1 205 975-6110, Email [email protected]
Purpose: Transcranial alternating current stimulation (tACS) is used as a brain stimulation mechanism to enhance learning, ameliorate some psychiatric disorders, and modify behavior. This study assessed the effects of near threshold tACS-like currents on Off-center and On-Off retinal ganglion cell responsiveness in the rabbit retina eyecup preparation as a model for central nervous system effects.
Materials and Methods: We made extracellular recordings in the isolated rabbit eyecup preparation using single electrodes and microelectrode arrays to measure light-evoked spike responses in different classes of Off-center and On-Off retinal ganglion cells before, during, and after brief applications of alternating currents of 1– 2 microamperes, at frequencies of 10, 20, 30, and 40 Hz.
Results: tACS application sculpted the light-evoked response profiles without directly driving spiking activity of the 20 Off-center and On-Off ganglion cells we recorded from. During tACS application, Off responses were significantly enhanced for 6 cells and significantly suppressed for 14 cells, but after tACS application, Off responses were significantly enhanced for 7 cells and suppressed for 12 cells. The Off responses of the remaining two cells returned to baseline. On responses were less affected during and after tACS.
Conclusion: tACS sculpts Off-center and On-Off retinal ganglion cell responsiveness. The dissimilarity of effects in different cells within the same class and the differential effects on the On and Off components of the light response within the same cell are consistent with the hypothesis that tACS acts at threshold on amacrine cells in the inner plexiform layer.
Keywords: retina, tACS mechanisms, CNS, in vitro model, neural coding, neuromodulation
Introduction
Hundreds of human studies have been conducted using external electrical brain stimulation for cognitive enhancement and amelioration of mental or behavioral dysfunction with little knowledge of the mechanism of its effects.1 Electrical brain stimulation has been used to enhance learning,2,3 to ameliorate a variety of cognitive or psychiatric disorders,4 such as depression,5 schizophrenia,6 substance abuse,7 dyslexia,8 binge eating disorder,9 and Alzheimer’s disease.10
Human brain stimulation has been done mostly using four main stimulation protocols: transcranial direct current stimulation (tDCS), transcranial alternating current stimulation (tACS), transcranial pulsed current stimulation (tPCS), and transcranial random noise stimulation (tRNS). Stimulation currents of a few milliamperes are passed through scalp electrodes similar to those used for recording EEGs, for 10–20 minutes.11 These non-invasive brain stimulation protocols are thought to modulate ongoing activity rather than directly driving spiking activity.12–14 However, determination of the mechanisms can be complicated by secondary effects such as or the modulation of activity through neural entrainment15 or synchronization of neural firing16,17 rather than direct modulation. For example, low current stimulation entrains firing in cortical hippocampal slices in current intensity-dependent manner, and there is a post-tACS polarity-dependent effect on the excitability of preterminal axonal branches of interposito-rubral nucleus of anesthetized animals.18
In previous studies,19,20 we reported the use of the retina as a model for investigating electrical stimulation effects on the central nervous system. The retina can be removed from a euthanized animal completely intact, and, light, the input that drives the retina, can be supplied in vitro in the isolated preparation, allowing investigation of modulation of naturally evoked neuronal activity, unlike brain slice preparations which usually have little or no ongoing neuronal activity.
Recordings of the same retinal ganglion cell classes in intact, anesthetized, versus in vitro preparations show that ganglion cell responses are essentially identical in the two preparations. In rabbit retina, the first descriptions of different physiological ganglion cell classes were done in anesthetized preparations,21 but work on function/structure identities and central projections involved recordings from the same cells in isolated preparations.22,23 Because retinal ganglion cells integrate signals created by the entire neural processing chain from photoreceptors through bipolar cells effects anywhere in the retina should alter ganglion cell responses. We have previously reported the effects of tACS on On-center ganglion cells.20
This report extends that data to explore the effects of tACS currents on Off-center and On-Off retinal ganglion cells and continue testing several hypotheses about the location and mechanism of tACS effects on Off-center and On-Off retinal ganglion cells at near threshold currents of 1–2 microamperes. Effects on photoreceptor responses should be seen in all classes of ganglion cells, whereas modifications of gain and center-surround balance across most ganglion cells suggest tACS effects primarily on horizontal cells. Because of parallel processing in the On and Off pathways, tACS effects mediated by modulation of bipolar cell activity would be expected to modulate On and Off pathways independently. If effects were mediated solely by modulation of ganglion cell activity, one might expect tACS to continuously modulate ganglion cell firing directly in or out of phase with the alternating current, such as has been observed in hippocampus and visual cortex.16 The hypothesis that amacrine cells have the lowest threshold for effects because tDCS more strongly modulate responses of some ganglion cell classes versus others is consistent with data in our previous reports.19,20
Understanding the effects of electrical stimulation in the retina is also important because stimulation of the retina may occur as a side effect of brain stimulation. Electrical stimulation of frontal brain areas may cause some current to pass through the retina, which could be the source of phosphenes reported during current onset and offset in such studies.24 These tACS-evoked retinal phosphenes24 can in turn contribute to the effects of tACS [reviewed by Schutter25]. Further, neuro-plastic changes in the retina that would also be expected to occur as part of electrical stimulation might be used to design prosthetic treatments for retinal dysfunction.
Materials and Methods
Retina preparations and electrophysiology methods are the same as those used in the companion study reporting the effects of tACS on the light-evoked activity of On-center retinal ganglion cells.20
Animals
All animals were maintained in accordance with the National Institute of Health Guide for the Care and Use of Laboratory Animals (NIH Publications No. 80–23, revised 1996), and the Global Statement on the Use of Animals in Research (Federation of European Neuroscience Societies, Japan Neuroscience Society, International Brain Research Organization, and Society for Neuroscience). All experimental procedures were approved by the University of Alabama at Birmingham (UAB) Institutional Animal Care and Use Committee. UAB is accredited by the American Association for Accreditation of Laboratory Animal Care. Both eyes of 5 albino rabbits were used for the present study. Rabbits were chosen for the current experiments because the physiology and morphology of rabbit retinal cells are well described and recordings from retinal ganglion cells in intact, anesthetized, versus in vitro preparations show that ganglion cell responses are essentially identical in the two preparations.21–23
Retina Preparation
New Zealand albino rabbits (1.6 to 4.2 kg) of both sexes were dark adapted and anesthetized with urethane (2 g/kg i.p.; Sigma-Aldrich, St. Louis, MO). After the eyes were enucleated under dim red light, the animal was euthanized with 1 mL Fatal Plus (i.v.; Vortech Pharmaceuticals, Dearborn, MI). After removal, the eye was placed in 4°C oxygenated bicarbonate-buffered (95% O2 and 5% CO2) Ames medium (Sigma-Aldrich), and the anterior pole, lens, and vitreous removed. The posterior pole containing the retina was everted onto a domed chamber and superfused with 35–38°C bicarbonate-buffered Ames medium (about 3.5 mL/min). Ganglion cell somas were sometimes visualized using Azure B (Sigma-Aldrich) solution, a few drops of which were added to the superfusate flowing over the retina at the beginning of recording.26 Under these conditions, retinas can remain stably responsive for 8 or more hours.
Ganglion Cell Recordings
Single microelectrode recordings obtained from carbon-fiber glass-insulated electrodes with silver-plated tips and multi-electrode array recordings obtained with stainless steel electrode wires modified from those of Amthor et al,27 were configured for concurrent recording and current application as previously described19 and used to obtain ganglion cell recordings from central and mid-peripheral inferior retina, typically from just below the visual streak. Multi-electrode array recordings allowed testing the effects of tACS current on a number of ganglion cells simultaneously. Ganglion cell spikes were amplified conventionally and digitized using Measurement Computing data acquisition boards (USB-1608 and USB-201, Measurement Computing Corp., Norton, MA). Firing rates were analyzed offline as described below.
As described in the companion paper,20 spikes were extracted from thresholding template convolved traces using MATLAB 2018 (MathWorks, Natick, MA). Thresholded spikes were then integrated, analyzed for statistical significance, and graphed using programs written for MATLAB. Light-evoked ganglion cell activity (average spikes/sec) was defined as an On response if it occurred during the 1000 msec light stimulus, and as an Off response if the activity occurred within the 1000 msec after light offset. Activity occurring during the 1000 msec prior to spot onset was used to define the maintained epoch firing rate. This study reports only data runs where spike height and stability were maintained throughout the experiment, other than the obvious effects on spike time patterning at the onset and offset of current application.
Light Stimuli
Light stimuli were generated using a custom LED array consisting of 3 mm white LEDs (Adafruit P3819A) in a 7 × 7 array (total extent 30 × 30 mm) mounted on a micromanipulator and projected onto the retinal surface through the microscope objective (single electrode recordings; image 1.5 mm on the retina) or through a focal length 30 mm lens above the retina (multielectrode array recordings; image 4 × 4 mm on the retina).
LED stimulus configurations were driven by an Arduino Mega microcontroller, which also controlled the experimental sequence and data acquisition, resulting in 100 microsecond light flash timing precision. The stimulus configurations used were (1) the central single LED, (2) the central 9 LEDs, (3) the central 16 LEDs, (4) all 49 LEDs, and (5) the annular ring of outer LEDs. Configurations 1–4 are referred to in the figures as Spot 1, Spot 2, and so forth. Spot 4 was equivalent to a full-field stimulus. The annular ring is referred to as “Annulus”. Two intensities were presented: 20 ma and 10 ma per LED for all LEDs. Spots 6–10 are the same as 1–5 except at half intensity. In early experiments (Sep 12 and Oct 10), the lower intensities were created using pulse width modulation of the Arduino at 960 Hz, but after that, reduced intensity was created by a higher resistance in series with the LED so that intensity was continuous. At maximum brightness, the LED array intensity was 12.5 times that of a standard 100 cd/m2 computer monitor. Under either configuration, half intensity stimuli were consistently above threshold.
Each stimulus sequence consisted of a 1000 msec period of baseline spiking activity, 1000 msec with the LED(s) on, and 1000 msec after LED illumination, for the off period. Experiments with 20 stimuli for each of those 10 stimulus types typically lasted about 30 minutes (3 seconds per stimulus × 10 stimulus types × 20 stimuli for each pre-, during, post-epoch). Thus, we were able to rapidly record responses before, during, and after tACS, so that changes in responsiveness due to rundown of the isolated retina, or other time factors, were minimized.
Stimuli were presented in the same order, from smallest to largest spot, then annulus, at high intensity, followed by the same order at half intensity. In post-experiment timing verification, we found that at the onset of DAQ acquisition was delayed up to 100 msec in the 1000 msec pre-stimulus epoch for the first presentation of Spot1, so we excluded results from Spot1 in comparative quantitative data analysis.
Alternating Current Application
The recording and electrical stimulus configurations were modified from those used for the tDCS study.19 One current electrode was a stainless-steel wire immersed in the superfusion bath over the retina placed near the recording electrode(s). The reference electrode was a silver–silver chloride ring at the chamber bottom that served as both the ground/reference electrode for recording and as the other electrode for tACS current application. The tACS currents were generated by a sinusoidal function generator (Instek GFG-8219A) through a current limiting resistor. The current RMS amplitude in all microelectrode array experiments in this study was one microampere, continuously monitored by an in-line digital multimeter (Neotek) in micro-ammeter mode. All microelectrode array results in this study used phase-locked sinusoidal current stimulation, so that the phase of the injected current was the same in every base, light stimulation on, light off trial. The data reported from the single microelectrode recordings used random phase alternating currents at 2 microamperes. Most data were collected at 10 Hz, a frequency used in a previous human visual system study.28 Alternating current frequencies of 10, 20, 30 or 40 Hz were used for a smaller subset of cells.
Ganglion Cell Classification
Ganglion cells included in this report were those that were broadly classified into transient or sustained Off-center and On-Off cell groups. Cells were classified based on the strongest unequivocal light response. The stimulus that elicited that response was defined as the optimal spot size. However, it was not possible to unambiguously assign each recorded ganglion cell to a particular known final class from the responses given the limited number of stimuli. It cannot be ruled out that the broad cell group of cells classified as On-Off contained concentric cells for which the light stimuli were not centered over the center of the cell’s receptive fields due to limitations of the multielectrode array recordings.
Further, the fact that the LED array was centered only on the middle electrodes in the microelectrode array, meant that for cells recorded with microelectrodes near the edge of the array, the concentric spots were not centered on some cell’s receptive fields. Thus, for these cells, the smallest spot (Spot 1) may have been in the surround of those cells, not the center. Given that there are over 30 ganglion cell classes29 in mammalian retina, it is obvious that ganglion cells in each group almost certainly include members of several classes.
Data Processing
The analog recordings of ganglion cell responses were digitized at 4 kHz with 12-bit resolution and thresholded in MATLAB as described above. The resulting spike records were used to determine the stimulus case(s) with the largest unequivocal light-evoked response(s) prior to electrical stimulation. Those cases with the strongest responses to the light stimuli are the ones generally shown in this report. For each condition (before tACS current, during tACS, post-tACS), 20–30 epochs of baseline, light on, light off were acquired. All peri-stimulus time histograms (PST) were calculated with 20 msec bins. The mean and standard deviation of these 20 msec bins of responses during 18–30 trials was calculated and exported from MATLAB for further analysis in GraphPad Prism 9 (La Jolla, Ca) to assess overall statistical differences between conditions. Tukey’s multiple comparison tests with the familywise error rate set to 0.05 were used to create multiplicity adjusted p-values (*p<0.05, **p < 0.001, ***p < 0.0001) following significant two-way ANOVAs (alpha set at 0.05) in order to compare the column means and bin by bin (20 msec) differences between pre, during, and post-current epochs for each cell. In the post-stimulus time histograms (PSTs), single symbols above a bin denote significance at the p < 0.05 level, double height symbols denote significant difference at the p < 0.005 level. Error bars represent 95% confidence intervals (CI). Because each cell was tested only at a single frequency, the frequency parameter was not included in the statistical analysis.
Spatial Heat Maps
The responses as a function of stimulus configuration are illustrated by “heat maps” computed from the responses to spots 2–4. The central nine squares, which comprise spot 2 show the average response to that spot configuration. Spot 4 is comprised of the ring of squares around spot 3 plus spot 3. What is plotted in the heat maps for that ring of squares is the difference between the response to spot 4 and the response to spot 3. Thus, if there was no difference between the responses to spot 3 and spot 4, this ring is plotted green. If spot 4 generated more spikes than spot 3, this ring is colored yellow through red. If spot 4 inhibited the response to spot 3, the ring is colored a shade of blue. The same plotting scheme is used for the outer ring of squares, which takes the difference between the response to spot 5 and spot 4.
Results
Full data sets were obtained from 20 Off-center and On-Off retinal ganglion cells from 7 retinas. Ganglion cells were broadly classified into transient (n = 4) or sustained (n = 6) Off-center and On-Off cell (n = 10) groups (Table 1). Wherever possible, we report data from the first tACS application in each retina, because of the variability seen in effects from multiple applications in our previous tDCS study.19 This variability is not surprising given our finding in that study that 15 minute one microampere tDCS application had effects lasting for hours, so that subsequent applications of tDCS current were acting on a retinal already dynamically modified by the previous current applications. We also generally report the results from the spot configuration that evoked the largest response, defined as the optimal stimulus or the optimal spot for that cell.
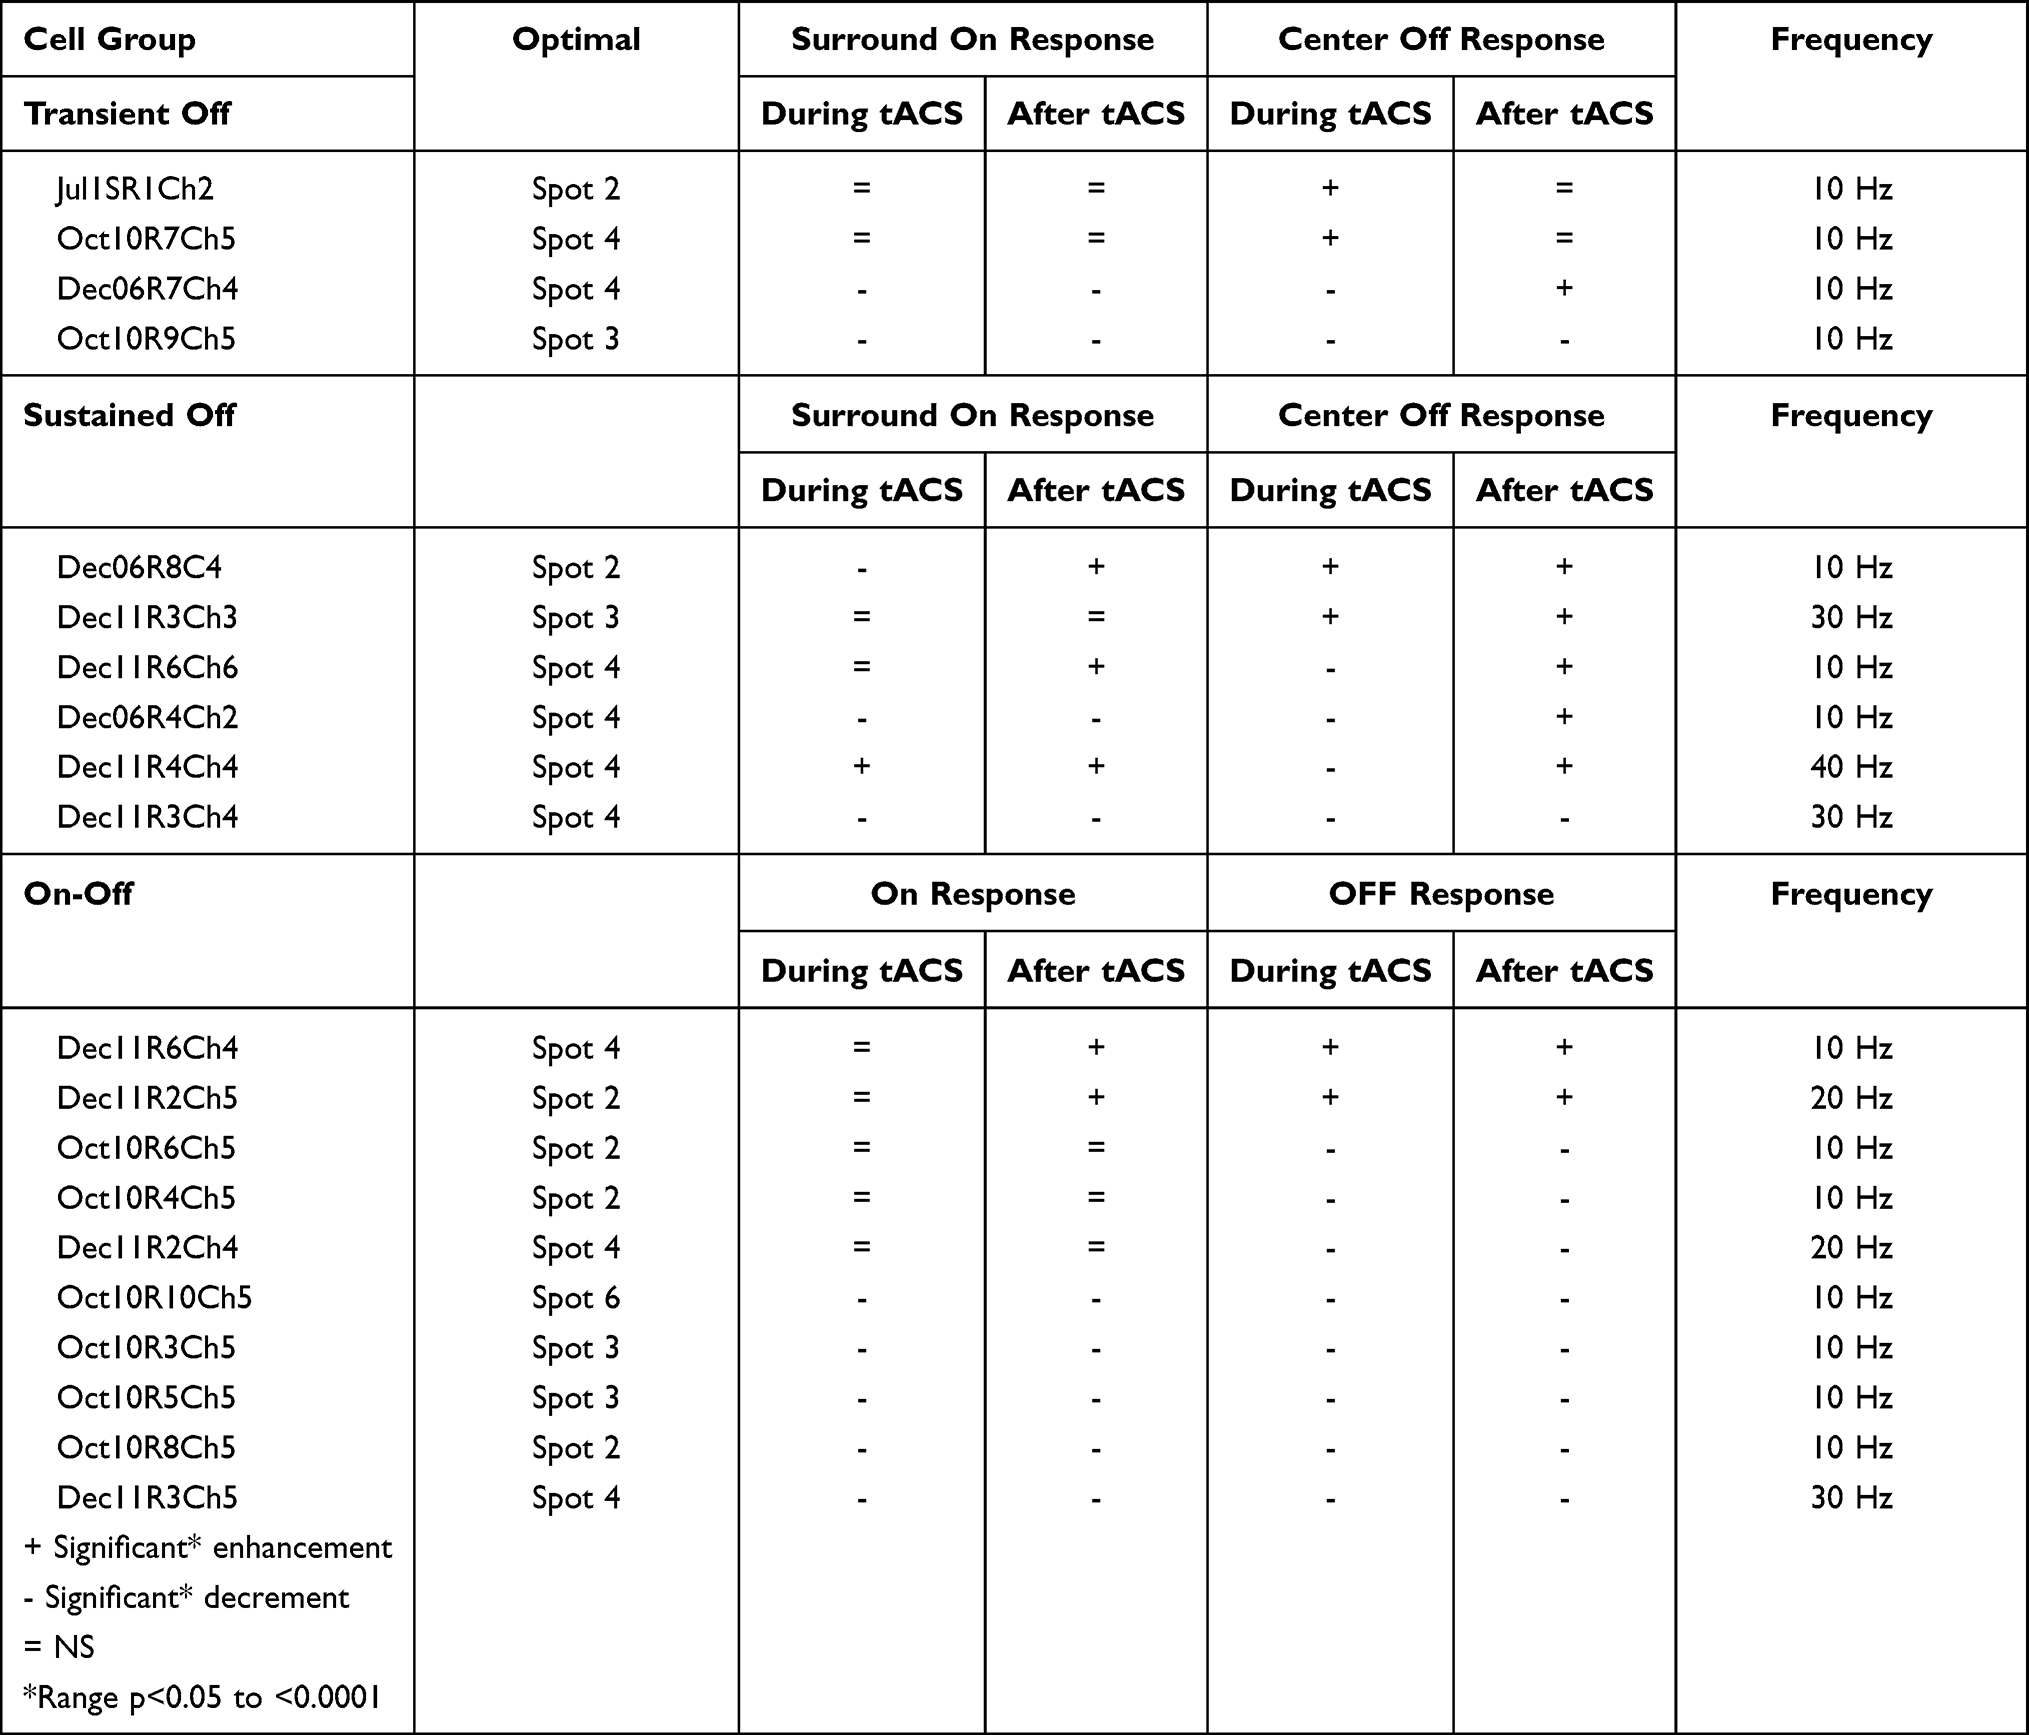 |
Table 1 Changes in Responses to Optimal Light Stimuli During and After tACS |
We show here the results from complete data runs (baseline, during, and after current application) from single and multi-electrode array recordings obtained from Off-center and On-Off ganglion cells. We used the multi-electrode array to obtain as many simultaneous recordings as possible from the first application of tACS current in the retina. Most of the data were collected with the tACS frequency of 10 Hz. A smaller number of recordings were made at 20, 30, and 40 Hz and are reported near the end of the Results section.
The cell classes reported in this study are more heterogeneous than those in the companion paper.20 That is, Off-sustained, Off-transient, and On-Off groups each were composed of multiple cell classes. Notwithstanding this heterogeneity, we observed a limited number of statistically significant response pattern changes induced by the tACS currents (as shown in Table 1). (1) Off-response enhancement during tACS, post-tACS response enhancement or return to near baseline, (2) Off response decrement during tACS, post-tACS response enhancement. (3) Decrement of the Off responses both during and after tACS. In contrast, variable changes were recorded in the surround On responses of 7 Off-center cells and the On component of 6 On-Off ganglion cells. The tACS-induced changes in the On components of the responses were not always in the same direction as the changes in the Off responses. The On responses of 6 cells were not significantly affected by tACS. Unlike our previous papers19,20 we never saw significant enhancement during tACS that was followed by a response decrement after current cessation.
Pattern 1: Off-response enhancement during tACS, post-tACS response enhancement or return to near baseline
Figure 1 shows a transient Off cell (Jul1SR1Cs2) with the center Off response enhanced during application of 10Hz tACS. Panel 1A shows raster plots for pre-tACS, during tACS, and post-tACS responses during the first tACS application (run 1) of an Off-center ganglion cell recorded with a single microelectrode. Baseline responses are black dots, responses during tACS are red dots, post-tACS responses blue dots. The light stimulus is on during one second of the 3 second stimulus epoch, marked in green. The tACS current is on the entire time during the time-period marked in red. The raster plots show that prior to tACS, each stimulus elicits one or no spikes, but during tACS almost every stimulus elicits a spike. After cessation of tACS (blue dots) there is a period when the stimulus elicits few spikes, followed by a return to near baseline firing, with an occasional late spike not seen in the baseline recordings.
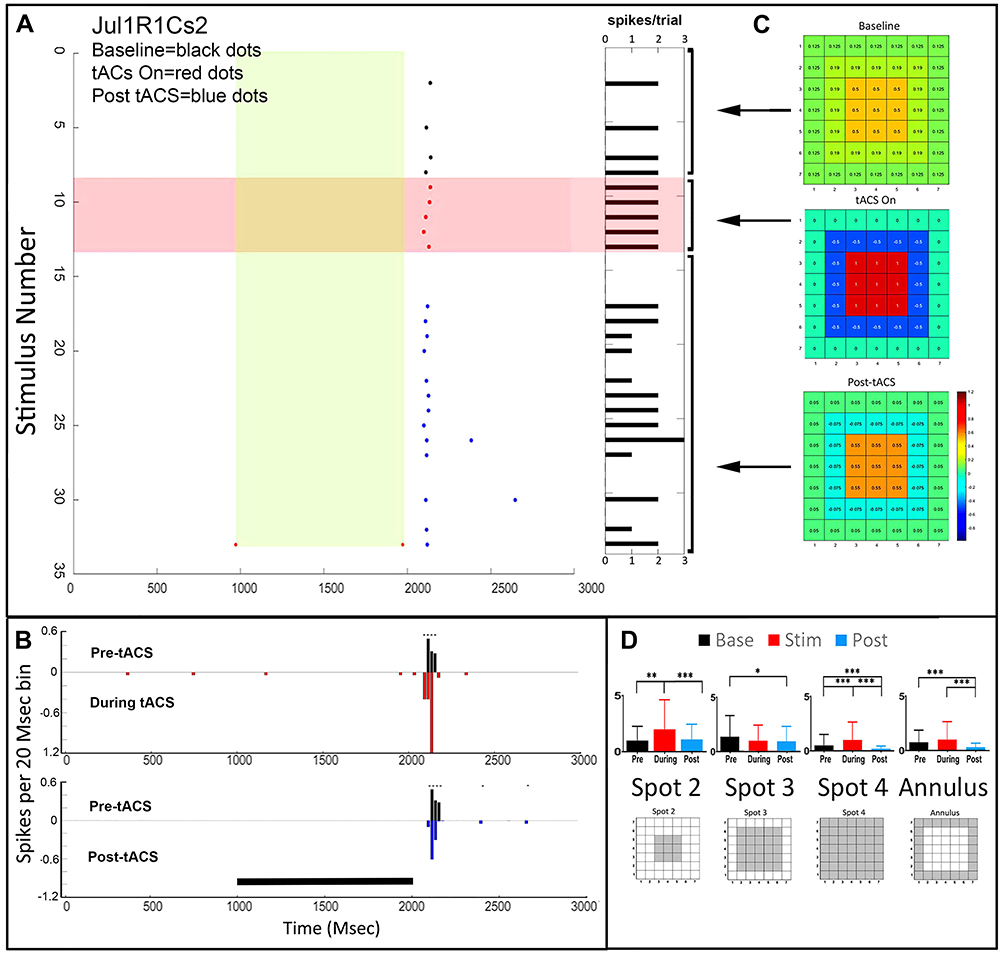 |
Figure 1 Temporal and spatial characteristics of the responses of a transient Off retinal ganglion of cell (Jul1SR1Ch2Cs2) demonstrating pattern 1 before, during and after tACS current. (A) Raster plots for pre-tACS, during tACS, and post-tACS responses for the optimal light stimulus (spot 2). The light stimulus is on during one second of the 3 second stimulus epoch marked in light green. The tACS current is on the entire time during the period marked in red. Baseline responses are depicted as black dots, responses during tACS are red dots, post-tACS responses, blue dots. To the right are horizontal columns indicating On (yellow) and Off (black) spike totals from each raster line. (B) Top panel, the pre-tACS histogram of the optimal response is in black, with the PST histogram during tACS plotted upside-down in red. The bottom panel compares firing pre-tACS (black) with post-tACS (blue). Asterisks indicate statistical differences between individual bins in the two plots at the 0.05 level as described in the “Methods” section. Black bar indicates the timing of the light stimulus. (C) Heat maps of the responses as a function of stimulus configuration. Construction of heat maps from responses to spots 1–4 are detailed in the “Methods” section. (D) Bar plots of response spikes as a function of stimulus configuration for pre-tACS (black), during tACS (red) and post-tACS (blue) epochs. Error bars indicate 95% confidence intervals. *p<0.05, **p<0.001, ***p<0.0001. The spatial configuration of each stimulus is shown below the corresponding bar plot. |
The PST histograms in Figure 1B show, in the top panel, the pre-tACS histogram in black, with the PST histogram during tACS plotted upside-down in red. The bottom panel compares firing pre-tACS (black) with post-tACS. The top panel shows that during tACS there are more spikes with a shorter latency compared to baseline. The responses during tACS current tend to have higher spike counts than before, followed by a period of lower spike counts after tACS cessation, but with higher irregularity. Post-tACS (blue) firing returns to near normal, although the latency remains shorter.
The heat map to the right of the raster plots (Figure 1C) shows how tACS affects the center-surround balance of this cell (details on how heat maps are constructed are in the ‘Methods’ section). The baseline spatial configuration shows moderate excitation for the nine LEDs constituting spot 2 (top, orange area), with weak additional excitation for the area surrounding this central region (green). During tACS (middle heat map) the strength of the center excitatory region becomes larger (red), but so also does the strength of the surround inhibition (blue). Post-tACS (bottom heat map), the spatial center-surround configuration returns to near baseline, but with a small shift toward the pattern exhibited during tACS.
The numerical data from which the heat maps were constructed, and the layout of the stimulating spots and annulus, are shown in Figure 1D. The response to Spot 2, comprised of the central nine LEDs, shows enhancement during tACS, followed by return to baseline afterward. This pattern is also true for Spot 4 and the annulus, but not spot 3, the middle-sized spot, which gave the largest baseline Off-center response, but also the largest inhibition during tACS.
Increases in the Off response total spike counts during and after tACS were also exhibited by sustained Off cells (Figure S1; Dec06R8Ch4). Simultaneously, tACS suppressed the On response, which returned to near baseline post-tACS. The heat maps in Figure S1 Panel C indicate changes in center-surround strength with a reduction in surround antagonism during tACS, which reverted to a pattern more like baseline afterward.
Pattern 2: Off Response Decrement During tACS, Post-tACS Response Enhancement or Return to Baseline
The second tACS-induced response pattern we observed in Off-center cells was of a decrement in the Off-response during tACS, followed by response enhancement after tACS cessation. The surround On responses in the same cells exhibited variable changes.
The temporal and spatial changes induced by tACS in the light responses of a sustained Off-center retinal ganglion cell demonstrating pattern 2 (Dec06R4Ch2Cs4) before, during and after tACS current are shown in Figure 2. A dramatic reduction of both On and Off responses, particularly the initial transients, occurs almost immediately after tACS current onset (Figure 2A). Both On and Off responses recover significantly after cessation of tACS (blue dots), with total firing in response to spot 2 being slightly but significantly enhanced above baseline. The PST plots (Figure 2B) show that the response profiles are quite different after tACS (blue), compared to baseline. Post-tACS the small surround On response that disappeared during tACS remains missing, while the Off response has a different profile with a shorter latency.
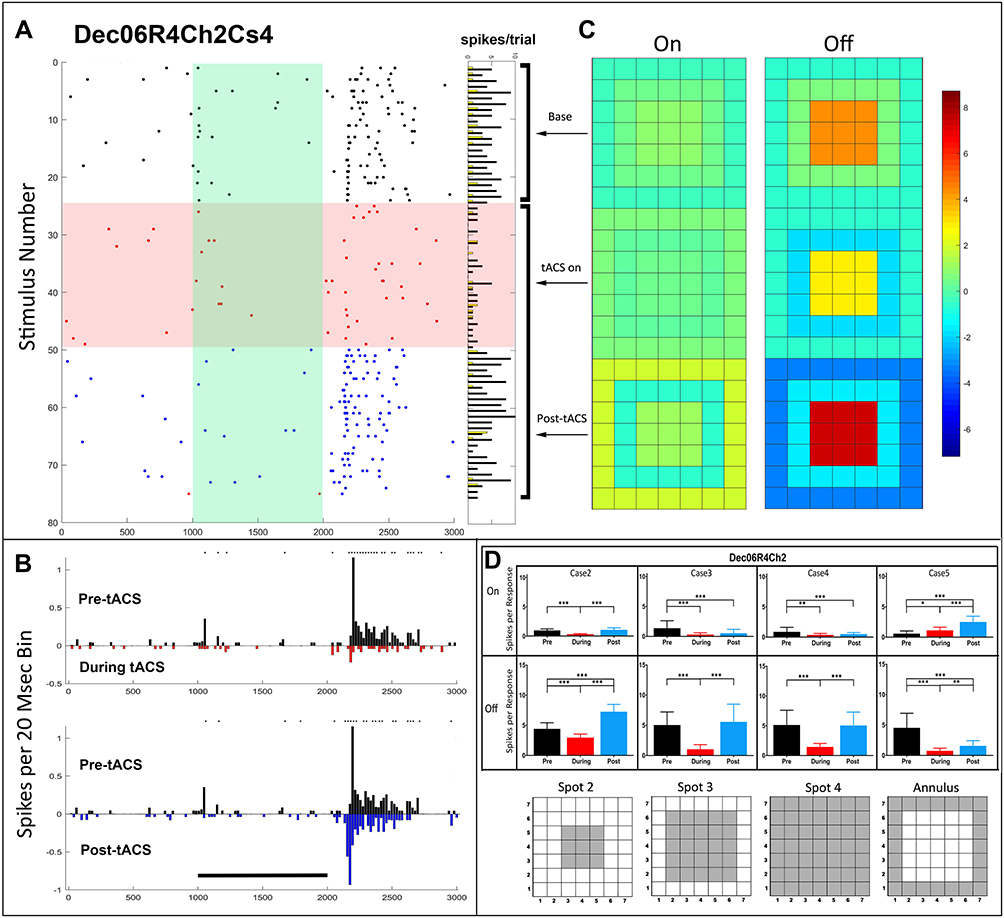 |
Figure 2 Temporal and spatial characteristics of the responses of a sustained Off-center retinal ganglion cell demonstrating pattern 2, (Dec06R4Ch2Cs4) before, during and after tACS current. Symbols and layout conventions as in Figure 2. (A) Raster plots of the spikes occurring during each trial for the spot 4 stimulus (plotting conventions same as Figure 2) with horizontal columns to the right indicating On (yellow) and Off (black) spike totals from each raster line. (B) PST histograms of baseline (black), during tACS (red) and post-tACS (blue) responses. Asterisks indicate statistical differences between individual bins in the two plots at the 0.05 level. Black bar indicates the timing of the light stimulus. (C) Heat maps of spatial dependence of On and Off responses constructed from responses to all spots. (D) Bar plots of total On and Off responses for each stimulus configuration with spatial configuration of each stimulus shown below each bar plot. Error bars indicate 95% confidence intervals. **p<0.001, *** p<0.0001. |
Figure 2C shows that tACS current clearly changes the spatial configuration of excitation and inhibition. The heat maps for the Off responses show little or no surround inhibition before tACS (top right, baseline), somewhat increased inhibition during tACS (middle), but strong inhibition post-tACS, despite a stronger response to spot 2 post-tACS. Thus, tACS increased both the center excitability and the surround inhibition after tACS cessation. The small antagonistic surround On-response in this cell does not exhibit significant spatial effects from tACS.
The temporal and spatial characteristics of a transient Off cell (Dec06R7Ch4) are shown in Figure S2. During tACS, this cell exhibited significant changes in spike patterns in all cases, even though the significant decrements in the total Off responses during tACS were only seen in response to the largest, full-field spot and annular stimulus. The heat maps (Figure S2C) show that both the center excitation and surround inhibition of the Off response increase post-tACS. The baseline response consisted of an excitatory center more or less coextensive with spot 2, and a weak inhibitory surround. During tACS, the center excitation is reduced, but the ring immediately around spot 2 shows more inhibition. As in Figure 2, both the center excitatory response and surround inhibition are stronger post-tACS.
Pattern 3: Decrement of the Off Responses Both During and After tACS
We observed a third pattern of tACS-induced changes in which Off responses were reduced during and after tACS cessation,and the On responses were also likely to be reduced. This pattern was predominant for On-Off cells, though it cannot be ruled out that this broad cell group contained concentric cells for which the light stimuli were not centered over the center of the cell’s receptive fields due to limitations of the multielectrode array recordings.
Figure 3 shows the temporal and spatial data of a cell identified as transient Off (Oct10R9Ch5). The raster plots (Figure 3A) and PST histograms (Figure 3B) do not show obvious changes in firing pattern during tACS, but a clear reduction in the initial Off response transient occurs immediately after cessation of tACS current. The heat map for the Off response (Figure 3C, top right) shows that during baseline the cell had a strong excitatory center, but little surround inhibition. This structure is maintained during tACS, but afterward, the center Off excitation is reduced.
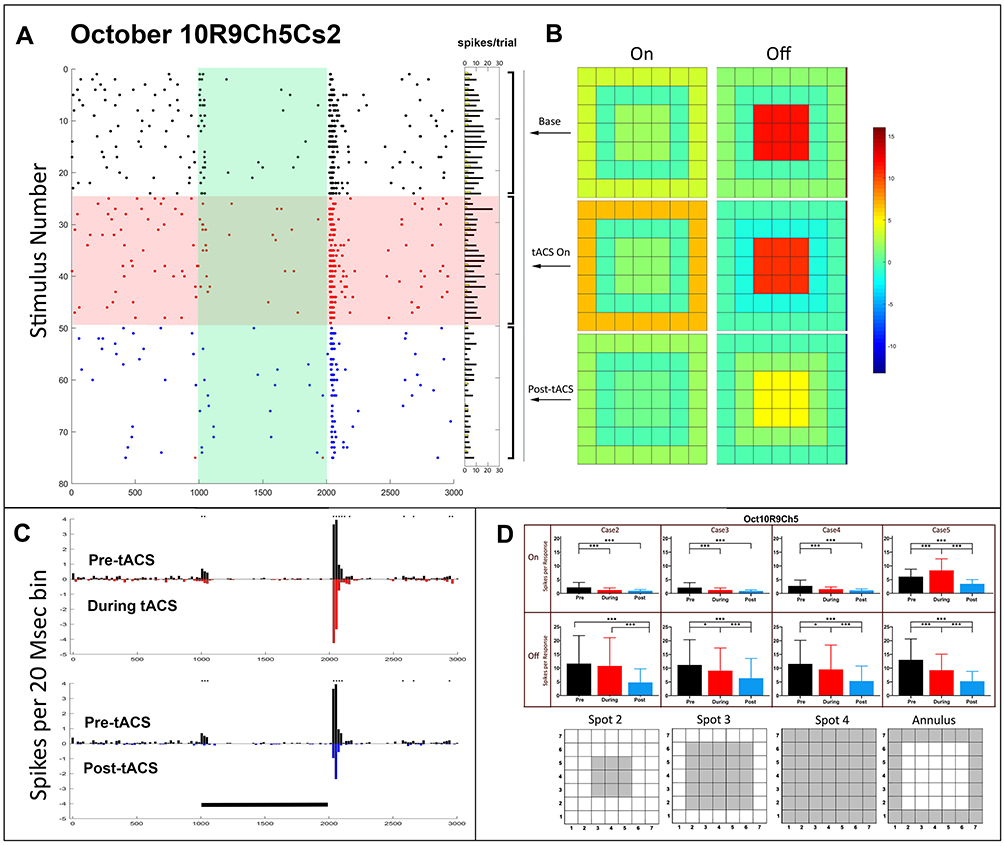 |
Figure 3 Temporal and spatial characteristics of the responses of a pattern 3 Off-center transient retinal ganglion cell (Oct10R9Ch5) before, during and after tACS current. Symbols and layout conventions as in Figure 2. (A) Raster plots of the spikes occurring during each stimulus epoch for each trial of the spot 2 stimulus with horizontal columns indicating spike totals from each raster line. (B) PST histograms of baseline (black), during tACS (red) and post-tACS (blue) responses. Asterisks indicate statistical differences between individual bins in the two plots at the 0.05 level. Black bar indicates the timing of the light stimulus. (C) Heat maps of spatial dependence of On and Off responses constructed from responses to all spots. (D) Bar plots of total On and Off responses for each stimulus configuration with spatial configuration of each stimulus shown below each bar plot. *p<0.05, ***p<0.0001. |
On-Off Ganglion Cells
tACS application resulted in significant decrements on the total Off responses that continued after tACS cessation for 80% of the cells broadly classified as On-Off cells. In contrast, the total spike counts of the On responses were not strongly affected by tACS for 50% of these cells. Interestingly, tACS effects were often strongest for the transient components of the responses of On- and Off-center cells, whether or not the total spike counts were significantly affected.
Figure 4 shows the responses of an On-Off ganglion cell (Oct10R6Ch5). Notably, this cell showed strong inhibition of ongoing maintained firing during the light on period (100–2000 msec). The raster plots (Figure 4A) and PST histograms (Figure 4B) indicate a loss of the initial transient of the Off response during tACS, which persisted afterwards. The initial transient of the On response, however, simultaneously increased during tACS, and this effect persisted after cessation of tACS (blue). The heat maps (Figure 4C) showed that, for the Off response, the relatively strong contrast between center excitation and surround inhibition present at baseline (Figure 4C, top right), was lost during tACS, and this loss persisted afterward. Figure 4D shows the numerical spot data from which the heat maps were generated.
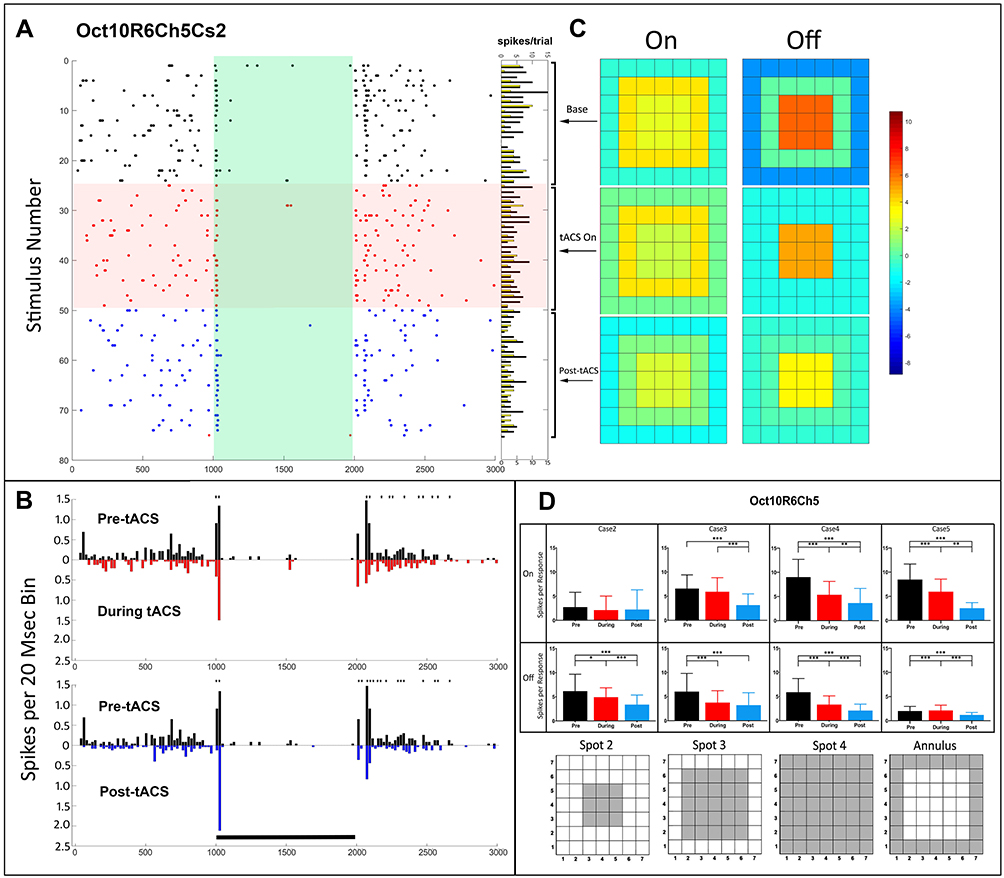 |
Figure 4 Temporal and spatial characteristics of the pattern 3 responses of an On-Off retinal ganglion cell (Oct10R6Ch5) before, during and after tACS current. Symbols and layout conventions as in Figure 2. (A) Raster plots of the spikes occurring during each stimulus epoch during each stimulus epoch for the case 2 spot (plotting conventions same as Figure 2). Horizontal columns at right indicate On (yellow) and Off (black) spike totals from each raster line. (B) PST histograms of baseline (black), during tACS (red) and post-tACS (blue) responses. Asterisks above a bin denote significant differences between the plots at the p<0.05 level. Black bar indicates the timing of the light stimulus. (C) Heat maps of the responses as a function of spatial configuration constructed from responses to all spots. (D) Bar plots of On and Off response spikes as a function of stimulus configuration for pre-tACS (black), during tACS (red) and post-tACS (blue) epochs. Error bars indicate 95% confidence intervals. *p<0.05, **p<0.001, ***p<0.0001. |
Similar reductions in the transient responses were seen for the On-Off cell (Oct10R4Ch5) shown in Figure S3. Although the total spike counts are less affected by tACS, there is a reduction in the transient component of both the On and Off responses during tACS, followed by a return to something more like the baseline pattern afterward for the On response, but not for the Off response, which remains reduced. The heat maps (Figure S3C) more clearly show that the On response shows little spatial reorganization, while the strength of the center-Off response declines during and after tACS.
Response Latency Shifts
Unusual changes in response latency occurred in some cells, which could occur for either the On or Off response, but not the other, and could occur for some stimuli, but not others. These latency changes were also observed at higher tACS frequencies (discussed in the next section). Figure 5 shows details of the temporal and spatial effects of tACS on another On-Off cell (Oct10R3Ch5). Figure 5A and B show significant changes in response profile, with the latency of the On response increasing significantly during and after tACS. Remarkably, the Off response of the same cell for the same stimulus was almost unaffected, as were the responses to other stimulus spot configurations. Even though tACS reduced the total spike counts for the On and Off responses (Figure 5E), the heat maps show that the On and Off response spatial effects were also different. Specifically, the strength of the inhibitory surround of the On response was moderately increased during tACS, and markedly increased afterwards. The Off response, however, showed a loss of center-surround antagonistic strength during and after tACS.
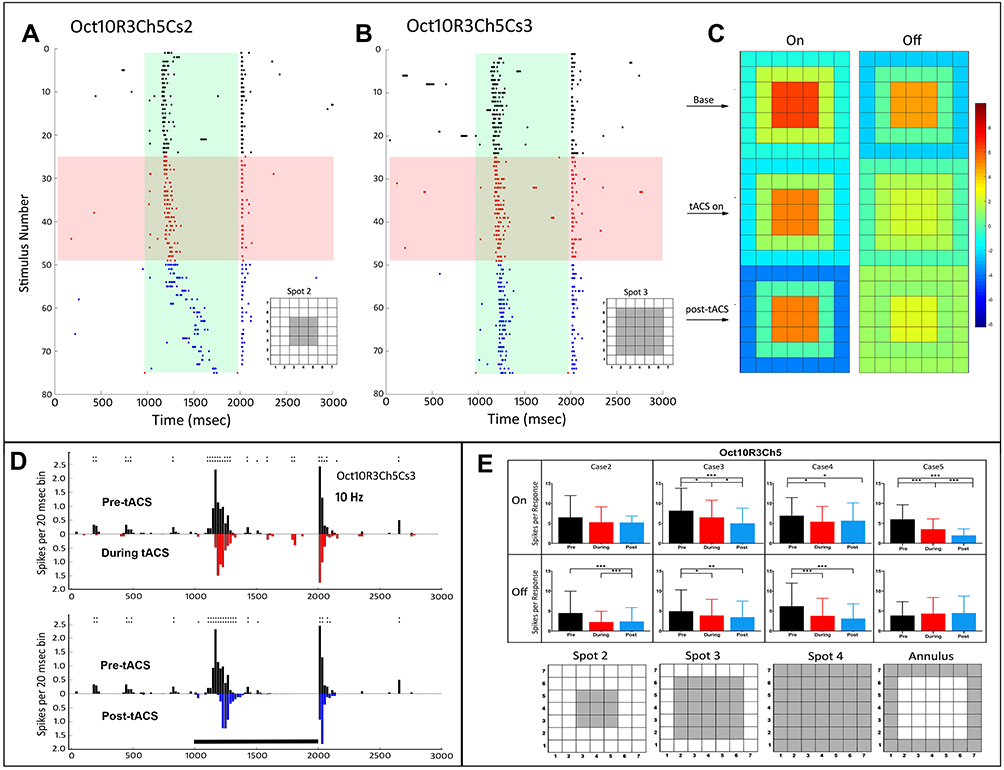 |
Figure 5 Temporal and spatial characteristics of the responses of an On-Off retinal ganglion cell (Oct10R3Ch5) before, during and after tACS current showing differences in latency during and after tACS. Symbols and layout conventions as in Figure 2. (A) Raster plots of the spikes occurring during each stimulus epoch for the case 2 spot (plotting conventions same as Figure 2). (B) Raster plots of the spikes occurring during each stimulus epoch for the case 2 spot (C) PST histograms of baseline (black), during tACS (red) and post-tACS (blue) responses for the case 3 spot. Double height asterisks above a bin denote significant differences between the plots at the p<0.005 level, triple height symbols denote significant differences at the p<0.0005 level. Black bar indicates the timing of the light stimulus. (D) Heat maps of the responses as a function of spatial configuration constructed from responses to all spots. (E) Bar plots of On and Off response spikes as a function of stimulus configuration for pre-tACS (black), during tACS (red) and post-tACS (blue) epochs. Error bars indicate 95% confidence intervals. *p<0.05, **p<0.001, ***p<0.0001. |
Higher Frequency tACS Stimulation
We ran a limited number of experiments at 20, 30 or 40, rather than 10 Hz. Figure 6 shows the results of 20Hz stimulation on an On-Off cell (Dec11R2Ch4). The Figure 6A raster plot shows only small changes in spikes per trial, but obvious changes in the PST pattern can be seen in Figure 6B. tACS stimulation at 20 Hz reduces the center Off response compared to baseline but had little effect on the On response. After current cessation, both On and Off responses are reduced, and Off response latency was increased. Figure 6C shows a moderate increase in center surround antagonism post-tACS for the Off, but not the On response.
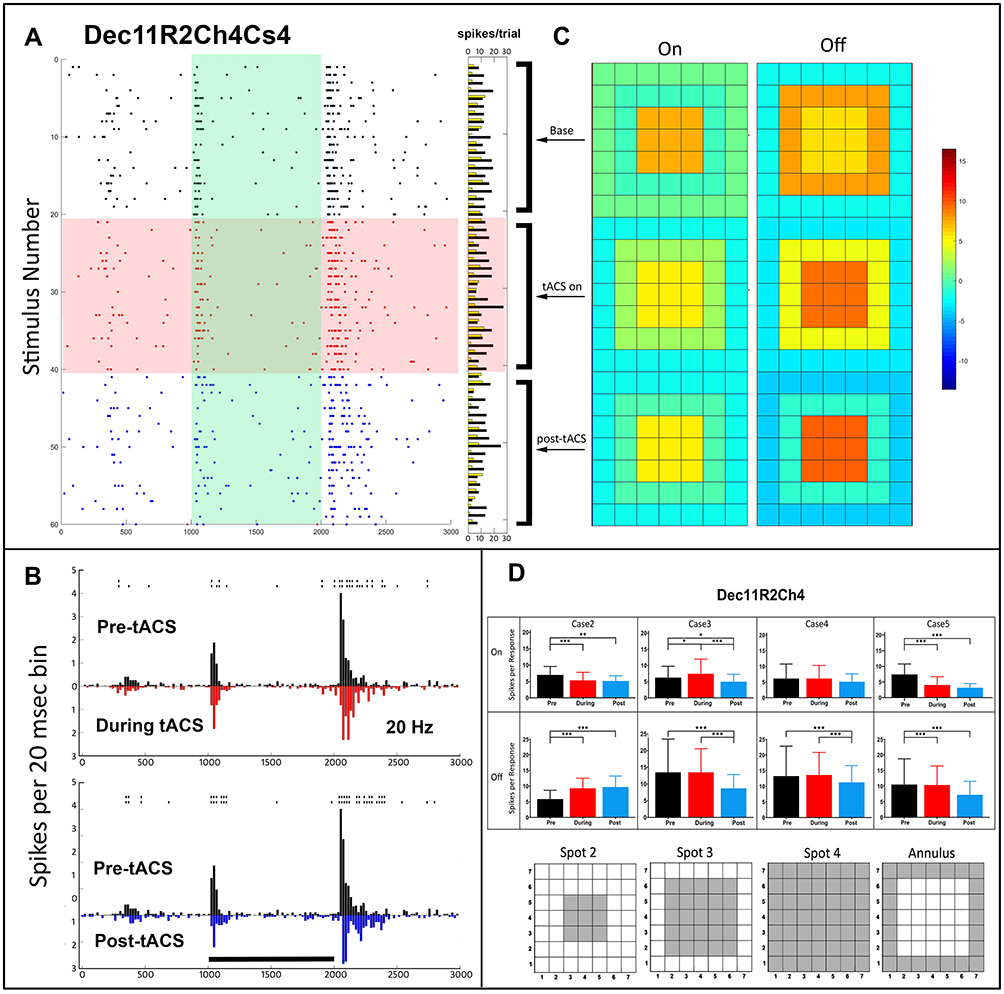 |
Figure 6 Temporal and spatial characteristics of the responses of an On-Off retinal ganglion cell (Dec11R2Ch4) before, during and after 20 Hz tACS current. (A) Raster plots of the spikes occurring during each stimulus epoch for the spot 2 trial (plotting conventions same as Figure 2). Horizontal columns at right indicate On (yellow) and Off (black) spike totals from each raster line. (B) PST histograms of baseline (black), during tACS (red) and post-tACS (blue) responses. Asterisks above a bin denote significant differences between the plots at the p<0.05 level, double height symbols denote significant differences at the p<0.005 level. Black bar indicates the timing of the light stimulus. (C) Heat maps of spatial dependence of On and Off responses constructed from responses to all spots. (D) Bar plots of response spikes as a function of stimulus configuration for pre-tACS (black), during tACS (red) and post-tACS (blue) epochs. Error bars indicate 95% confidence intervals. *p<0.05, **p<0.001, ***p<0.0001. |
Another On-Off cell (Dec11R2Ch5) simultaneously recorded with that just described previously is shown in Figure S4. This cell exhibited an almost complete loss of the On response initial transient during and after 20 Hz tACS, without significant changes in the total spike count, with strong shape changes in the Off-response profile, including a longer latency post-tACS. The magnitude of both the On and Off responses was somewhat larger post-tACS, despite the longer latency.
Forty Hz tACS stimulation also produced odd latency and PST profile changes as is shown in Figure S5. The raster plots and PST histograms for cell Dec11R4Ch4Cs5 show that 40 Hz tACS increases the spike count in Off-center response and induces a new, short-latency On-surround response that was not present at baseline. The heat map shows a loss of inhibitory surround during tACS. Post-tACS, the center response strength is larger. Post-tACS the surround On response continues to change. PST histograms show that both On and Off responses have shorter latency during and after tACS stimulation. It is possible that the post-tACS firing prior to light stimulus onset at 1000 msec is actually a delayed Off response from the previous stimulus, which would have been delivered one second prior to the beginning of the next stimulus epoch.
Phase Locking and Modulation Mechanisms
The one microampere currents used in these experiments did not drive ganglion cell spiking directly. There was little evidence of increases in ganglion cell firing in the pre-light stimulus period during tACS stimulation, rather, the effects of the tACS current were to sculpt the light-induced firing pattern. For some cells, we phase-locked the tACS stimulation to the light stimulus epoch in order to examine whether changes in the light-induced firing pattern tracked the tACS stimulus waveform, and whether, if so, phase-locked alterations in firing were in or out of phase with the tACS waveform, and whether they had characteristics consistent with an additive/subtractive (threshold), or multiplicative (gain) mechanism.
In most of our recordings, we saw no strong evidence of spike responses being phase-locked to the tACS stimulus, but this did occur in some ganglion cells. Two examples are shown in Figure S6 where the baseline PST plots (black) versus tACS average PST plots (red) are superimposed with the average tACS stimulus waveform plotted at an arbitrary scale (see the ‘Methods’ section). For cell Dec06R8Ch4Cs4, enhancement of firing appears to occur near several positive peaks of the tACS current. For the cell Dec11R6Ch4Cs4 (bottom) enhanced firing appears near one or two negative peaks. We did not, in general, observe any strong correlation between the tACS waveform and PST modulation.
Discussion
We stimulated Off-center and On-Off retinal ganglion cells with one microampere tACS currents believed to be near threshold from previous studies.19,20 These tACS currents in the 10 Hz frequency range virtually never drove ganglion cells directly, as evidenced by no detectable ongoing modulation of maintained firing outside of On and Off response epochs. Although we recorded fewer cells at higher frequencies, 1 microampere tACS currents at 20, 30, or 40 Hz tACS at also did not drive ganglion cell firing. Phase locked firing was rare, but when it did occur, it could be associated with either positive or negative peaks of the tACS current. Direct effects on ganglion cell firing rates or phase locking might increase at higher currents; however, this was not tested in this study.
tACS did, however, always modulate light-evoked On and Off responses, even on the eighth 10-minute application in the same retina, after 3 hours. As in previous papers exploring the effects of current stimulation in the retina,19,20 tACS could change On and Off response spike counts in opposite directions in the same cell, or it could change On or Off responses in different cells recorded simultaneously in different directions. tACS effects on ganglion cell response profiles were often observed immediately after the initiation or cessation of current and lasted for the recording period following cessation of tACS currents without obvious diminution.
The effects of tACS on the light-evoked response to our series of light stimuli were more consistent with the Off responses for any given cell. We were able to identify 3 general patterns of effects. The first was Off-response enhancement during tACS followed by enhancement or return to baseline. The second was Off response decrement during tACS followed post-tACS response enhancement. The third was decrement of the Off responses both during and after tACS. Unlike our previous papers,19,20 we never saw significant enhancement during tACS that was followed by a response decrement after current cessation. In general, the effects of tACS on the On responses were smaller and more variable, but could affect the initial transients as reported for On cells in our companion paper.20
In general, changes in strength of the center and surround responses paralleled the changes in the light-evoked firing. That is, cells with stronger center responses post-tACS also had stronger post-tACS surround inhibition. The center and surround strength of cells with off responses that reverted to baseline also reverted to a pattern near baseline, indicating that for these cells the center surround balance was unchanged. In contrast, the center-surround balance for transient On cells can be changed by tACS application.20
The diverse tACS effects, such as different, complex modulations of PST profiles of On and Off responses in the same ganglion cell, are not consistent with hypothesized mechanisms such as ganglion cell threshold modulation.30 These results are also not consistent with primary mechanisms of action in the outer retina, which would be expected to reveal themselves as additive or multiplicative response modulations similar across all ganglion cell classes.
The tACS effects we observed are most consistent with a locus in the inner plexiform layer, namely, in amacrine cells. The complexity of tACS effects is consistent with current estimates of the number of amacrine cell classes in the mammalian retina as more than 60,31 including cells that release almost every known neurotransmitter and neuromodulator. Threshold tACS effects are similar to those of pharmacological agents that agonize or antagonize neurotransmitter systems used by different amacrine cells. In studying retinal circuitry, tACS may have advantages over the use of pharmacological agents in that it can be quickly turned on and off, and frequency and current magnitude may be able to be tuned to affect different neurotransmitter systems.
One hypothesized mechanism for electrical stimulation effects in the central nervous system is activation of voltage-gated calcium channels.32 Voltage-gated calcium channel activation would be expected to have two phases consistent with our observations: (1) additive or multiplicative increase in neurotransmitter release during the early time period of tACS, followed by (2) depletion of neurotransmitter stores and dropout of the affected neurotransmitter system from the retinal circuitry driving ganglion cell responses.
Frequency Dependence and Retinal Effects
The functional consequences of these tACS effects are speculative but given our data one could predict that alterations in the peak firing rate reflect alterations in gain control, and timing would affect the weighting of input from different ganglion cells. These changes in individual cells might preferentially weight one type of stimulus over another, an interpretation consistent with previous reports that tACS contributes to gain control and attentional modulation in the brain.33 The lack of strong changes in center-surround balance argues against changes in the spatial or temporal tuning properties of these cells.34,35 However, it is possible that alterations in the response properties of rabbit On-Off cells might affect motion sensitivity.23
Understanding the mechanism of tACS effects in retina is important because some retinal prostheses have been proposed that use electrical current to stimulate retinal neurons after photoreceptor death.36 Transcorneal electrical stimulation has been used to enhance ganglion cell survival and axon regrowth in a glaucoma model.37,38 Electric current has been postulated to prolong retinal function in a number of retinal degeneration models.39–42
Although we did not systematically investigate frequency effects, there does appear to be some frequency dependence in our results. Prosthetic stimulation of the retina at some frequencies might avoid potential neurotransmitter depletion produced at other frequencies. The use of multiple frequency stimulation may allow targeting of specific retinal circuits in electrical prosthetic devices.
The Retina as a CNS Model System
The isolated retina preparation has many desirable properties as a model of electrical stimulation effects in the CNS because it can be removed intact and operates in a nearly normal manner in vitro. Further, the responses of physiologically identified ganglion cell classes are essentially identical between in isolated preparations,22,23 with those obtained from in vivo preparations, allowing for greater control of the electrical stimulation parameters. For example, the configuration for electrical stimulation in the isolated eyecup preparation allows the anode and cathode to be placed directly above and below the retina. In an anesthetized preparation, the stimulation would need to not only pass through the entire globe but it would be necessary to place the ground at a location distant from the retina. Shunting would not only require reconfiguring the threshold but the higher currents required could also have secondary effects in non-retinal areas.
Our results are consistent with previous findings mentioned in the “Introduction” section that tACS sculpts, rather than directly drives neural responses in intact circuits. It will be challenging to understand the subtle sculpting of ongoing activity by electrical stimulation in most cortical and hippocampal brain slice preparations because they are disconnected from their inputs and thus have no normal ongoing activity. Because of the consistency of ganglion cell responses across in vitro and in vivo preparations, mechanisms of tACS effects identified using the eye cup preparation could then be extended to studies in anesthetized animals to allow determination of threshold differences and secondary effects related to the greater distance between the anode and cathode.
Although the diversity of electrical stimulation effects across different ganglion cell classes belies simple explanations about mechanisms, this diversity is actually an advantage and opportunity. The neural circuitry and neurotransmitter systems in retina are as well understood, and arguably more understood, than in any other CNS location. Different retinal ganglion cell classes have very different balances between bipolar and amacrine cell input that can be correlated with tACS effects. Modulation of tACS frequency and phase should allow some targeting of effects on particular circuits in the retina. tACS can be combined with pharmacological manipulation to both verify the neurotransmitter systems involved and further target-specific neural pathways.
Limitations and Future Directions
This study is a survey of a sample of tACS effects near threshold on Off-center and On-Off ganglion cell classes. We did not establish the actual threshold current for effects, how responses changed as a function of current strength, nor the threshold for phase locking in any ganglion cell class. We found that multiple applications of tACS have different effects on the same cells but did not systematically determine the time dependence of multiple applications. As we found with tDCS,19 tACS effects lasted for at least 30 minutes following cessation of tACS currents without obvious diminution, but we did not examine tACS effects beyond this time period, and we do not know if this duration models neuro-plastic effects observed in humans in many studies. This paper does not report on hypothesized tACS effects on synchronous firing by entraining neural activity, as reported by Vieira et al.16 This issue is addressed in a companion paper comparing the effects of tACS on correlated ganglion cell firing during simultaneous microelectrode array recordings.43
Conclusion
Because tACS is being used to modify behavior and treat a myriad of medical conditions and psychiatric disorders, it is important to understand the cellular mechanisms of its effects to optimize parameters for treatment efficacy. Our data showing that tACS sculpts naturally evoked neuronal activity in an isolated retina preparation and supports the use of the retina as a model for investigating electrical stimulation effects on the central nervous system. Understanding the mechanisms of neural circuit modulation by electric current stimulation may reveal novel pharmacological targets to enhance neural function or alleviate neurodegenerative disorders.
Acknowledgments
This work was supported by the VSRC core (UAB Vision Science Research Center, grant P30 EY003039). The content is solely the responsibility of the authors and does not necessarily represent the official views of the National Institutes of Health (NIH).
Author Contributions
All authors made substantial contributions to conception and design, acquisition of data, or analysis and interpretation of data; took part in drafting the article or revising it critically for important intellectual content; agreed to submit to the current journal; gave final approval of the version to be published; and agreed to be accountable for all aspects of the work.
Disclosure
The authors report no conflicts of interest in this work.
References
1. Chase HW, Boudewyn MA, Carter CS, Phillips ML. Transcranial direct current stimulation: a roadmap for research, from mechanism of action to clinical implementation. Mol Psychiatry. 2020;25(2):397–407. doi:10.1038/s41380-019-0499-9
2. Esmaeilpour Z, Schestatsky P, Bikson M, et al. Notes on human trials of transcranial direct current stimulation between 1960 and 1998. Front Hum Neurosci. 2017;11:71. doi:10.3389/fnhum.2017.00071
3. Hashemirad F, Zoghi M, Fitzgerald P, Jaberzadeh S. The effect of anodal transcranial direct current stimulation on motor sequence learning in healthy individuals: a systematic review and meta-analysis. Brain Cogn. 2016;102:1–12. doi:10.1016/j.bandc.2015.11.005
4. Kekic M, Boysen E, Campbell IC, Schmidt U. A systematic review of the clinical efficacy of transcranial direct current stimulation (tDCS) in psychiatric disorders. J Psychiatr Res. 2016;74:70–86. doi:10.1016/j.jpsychires.2015.12.018
5. Bennabi D, Haffen E. Transcranial Direct Current Stimulation (tDCS): a Promising Treatment for Major Depressive Disorder? Brain Sci. 2018;8(5):81. doi:10.3390/brainsci8050081
6. Valiengo L, Goerigk S, Gordon PC, et al. Efficacy and safety of transcranial direct current stimulation for treating negative symptoms in schizophrenia: a randomized clinical trial. JAMA Psychiatry. 2020;77(2):121–129. doi:10.1001/jamapsychiatry.2019.3199
7. Lupi M, Martinotti G, Santacroce R, et al. Transcranial direct current stimulation in substance use disorders: a systematic review of scientific literature. J ECT. 2017;33(3):203–209. doi:10.1097/YCT.0000000000000401
8. Rios DM, Correia rios M, Bandeira ID, Queiros campbell F, de Carvalho Vaz D, Lucena R. Impact of transcranial direct current stimulation on reading skills of children and adolescents with dyslexia. Child Neurol Open. 2018;5. doi:10.1177/2329048X18798255
9. Burgess EE, Sylvester MD, Morse KE, et al. Effects of transcranial direct current stimulation (tDCS) on binge eating disorder. Int J Eat Disord. 2016;49(10):930–936. doi:10.1002/eat.22554
10. Andrade SM, de Mendonça CTPL, Pereira TCL, Fernandez-Calvo B, Araújo RCN, Alves NT. Adjuvant transcranial direct current stimulation for treating Alzheimer’s disease: a case study. Dement Neuropsychol. 2016;10(2):156–159. doi:10.1590/S1980-5764-2016DN1002013
11. Bikson M, Grossman P, Thomas C, et al. Safety of Transcranial Direct Current Stimulation: evidence Based Update 2016. Brain Stimul. 2016;9(5):641–661. doi:10.1016/j.brs.2016.06.004
12. Anastassiou CA, Montgomery SM, Barahona M, Buzsáki G, Koch C. The effect of spatially inhomogeneous extracellular electric fields on neurons. J Neurosci. 2010;30(5):1925–1936. doi:10.1523/JNEUROSCI.3635-09.2010
13. Buzsáki G, Anastassiou CA, Koch C. The origin of extracellular fields and currents–EEG, ECoG, LFP and spikes. Nat Rev Neurosci. 2012;13(6):407–420. doi:10.1038/nrn3241
14. Creutzfeldt OD, Fromm GH, Kapp H. Influence of transcortical d-c currents on cortical neuronal activity. Exp Neurol. 1962;5:436–452. doi:10.1016/0014-4886(62)90056-0
15. Ozen S, Sirota A, Belluscio MA, et al. Transcranial electric stimulation entrains cortical neuronal populations in rats. J Neurosci. 2010;30(34):11476–11485. doi:10.1523/JNEUROSCI.5252-09.2010
16. Vieira PG, Krause MR, Pack CC. tACS entrains neural activity while somatosensory input is blocked. PLoS Biol. 2020;18(10):e3000834. doi:10.1371/journal.pbio.3000834
17. Violante IR, Li LM, Carmichael DW, et al. Externally induced frontoparietal synchronization modulates network dynamics and enhances working memory performance. eLife. 2017;6. doi:10.7554/eLife.22001
18. Bączyk M, Jankowska E. Presynaptic actions of transcranial and local direct current stimulation in the red nucleus. J Physiol. 2014;592(19):4313–4328. doi:10.1113/jphysiol.2014.276691
19. Strang CE, Ray MK, Boggiano MM, Amthor FR. Effects of tDCS-like electrical stimulation on retinal ganglion cells. Eye Brain. 2018;10:65. doi:10.2147/EB.S163914
20. Amthor FR, Strang CE. Effects of tACS-Like Electrical Stimulation on On-Center Retinal Ganglion Cells: part I. Eye Brain. 2021;13:175–192. doi:10.2147/EB.S312402
21. Levick WR. Receptive fields and trigger features of ganglion cells in the visual streak of the rabbit’s retina. J Physiol. 1967;188(3):285–307. doi:10.1113/jphysiol.1967.sp008140
22. Amthor FR, Takahashi ES, Oyster CW. Morphologies of rabbit retinal ganglion cells with concentric receptive fields. J Comp Neurol. 1989;280(1):72–96. doi:10.1002/cne.902800107
23. Amthor FR, Takahashi ES, Oyster CW. Morphologies of rabbit retinal ganglion cells with complex receptive fields. J Comp Neurol. 1989;280(1):97–121. doi:10.1002/cne.902800108
24. Kar K, Krekelberg B. Transcranial electrical stimulation over visual cortex evokes phosphenes with a retinal origin. J Neurophysiol. 2012;108(8):2173–2178. doi:10.1152/jn.00505.2012
25. Schutter DJLG. Cutaneous retinal activation and neural entrainment in transcranial alternating current stimulation: a systematic review. NeuroImage. 2016;140:83–88. doi:10.1016/j.neuroimage.2015.09.067
26. Amthor FR, Keyser KT, Dmitrieva NA. Effects of the destruction of starburst-cholinergic amacrine cells by the toxin AF64A on rabbit retinal directional selectivity. Vis Neurosci. 2002;19(4):495–509. doi:10.1017/S0952523802194119
27. Amthor FR, Tootle JS, Yildirim A. A new transparent multi-unit recording array system fabricated by in-house laboratory technology. J Neurosci Methods. 2003;126(2):209–219. doi:10.1016/S0165-0270(03)00094-3
28. Battaglini L, Mena F, Ghiani A, Casco C, Melcher D, Ronconi L. The Effect of Alpha tACS on the Temporal Resolution of Visual Perception. Front Psychol. 2020;11. doi:10.3389/fpsyg.2020.01765
29. Sanes JR, Masland RH. The types of retinal ganglion cells: current status and implications for neuronal classification. Annu Rev Neurosci. 2015;38:221–246. doi:10.1146/annurev-neuro-071714-034120
30. Blum M-C, Solf B, Hunold A, Klee S. Effects of ocular direct current stimulation on full field electroretinogram. Front Neurosci. 2021;15. doi:10.3389/fnins.2021.606557
31. Yan W, Laboulaye MA, Tran NM, Whitney IE, Benhar I, Sanes JR. Molecular identification of sixty-three amacrine cell types completes a mouse retinal cell atlas. bioRxiv. 2020;2020. doi:10.1101/2020.03.10.985770
32. Pall ML. Electromagnetic fields act via activation of voltage-gated calcium channels to produce beneficial or adverse effects. J Cell Mol Med. 2013;17(8):958–965. doi:10.1111/jcmm.12088
33. Obleser J, Kayser C. Neural Entrainment and Attentional Selection in the Listening Brain. Trends Cogn Sci. 2019;23(11):913–926. doi:10.1016/j.tics.2019.08.004
34. Robinson DW, Chalupa LM. The intrinsic temporal properties of alpha and beta retinal ganglion cells are equivalent. Current Biology. 1997;7(6):366–374. doi:10.1016/S0960-9822(06)00184-9
35. Graham DJ, Chandler DM, Field DJ. Can the theory of “whitening” explain the center-surround properties of retinal ganglion cell receptive fields? Vision Res. 2006;46(18):2901–2913. doi:10.1016/j.visres.2006.03.008
36. Bloch E, Luo Y, da Cruz L. Advances in retinal prosthesis systems. Ther Adv Ophthalmol. 2019;11. doi:10.1177/2515841418817501
37. Henrich-Noack P, Voigt N, Prilloff S, Fedorov A, Sabel BA. Transcorneal electrical stimulation alters morphology and survival of retinal ganglion cells after optic nerve damage. Neurosci Lett. 2013;543:1–6. doi:10.1016/j.neulet.2013.03.013
38. Tagami Y, Kurimoto T, Miyoshi T, Morimoto T, Sawai H, Mimura O. Axonal regeneration induced by repetitive electrical stimulation of crushed optic nerve in adult rats. Jpn J Ophthalmol. 2009;53(3):257–266. doi:10.1007/s10384-009-0657-8
39. Ciavatta VT, Mocko JA, Kim MK, Pardue MT. Subretinal electrical stimulation preserves inner retinal function in RCS rat retina. Mol Vis. 2013;19:995–1005.
40. Hanif AM, Kim MK, Thomas JG, et al. Whole-eye electrical stimulation therapy preserves visual function and structure in P23H-1 rats. Exp Eye Res. 2016;149:75–83. doi:10.1016/j.exer.2016.06.010
41. Mocko JA, Kim M, Faulkner AE, Cao Y, Ciavatta VT, Pardue MT. Effects of Subretinal Electrical Stimulation in Mer-KO Mice. Invest Ophthalmol Vis Sci. 2011;52(7):4223–4230. doi:10.1167/iovs.10-6750
42. Pardue MT, Allen RS. Neuroprotective strategies for retinal disease. Prog Retin Eye Res. 2018;65:50–76. doi:10.1016/j.preteyeres.2018.02.002
43. Amthor FR, Strang CE. Effects of tACS-Like Electrical Stimulation on Correlated Firing of Retinal Ganglion Cells: Part III. Eye Brain. 2022;14:1-15. https://doi.org/10.2147/EB.S313161
 © 2022 The Author(s). This work is published and licensed by Dove Medical Press Limited. The
full terms of this license are available at https://www.dovepress.com/terms
and incorporate the Creative Commons Attribution
- Non Commercial (unported, 3.0) License.
By accessing the work you hereby accept the Terms. Non-commercial uses of the work are permitted
without any further permission from Dove Medical Press Limited, provided the work is properly
attributed. For permission for commercial use of this work, please see paragraphs 4.2 and 5 of our Terms.
© 2022 The Author(s). This work is published and licensed by Dove Medical Press Limited. The
full terms of this license are available at https://www.dovepress.com/terms
and incorporate the Creative Commons Attribution
- Non Commercial (unported, 3.0) License.
By accessing the work you hereby accept the Terms. Non-commercial uses of the work are permitted
without any further permission from Dove Medical Press Limited, provided the work is properly
attributed. For permission for commercial use of this work, please see paragraphs 4.2 and 5 of our Terms.