Back to Journals » Eye and Brain » Volume 15
Effects of Stimulus Luminance, Stimulus Color and Intra-Stimulus Color Contrast on Visual Field Mapping in Neurologically Impaired Adults Using Flicker Pupil Perimetry
Authors Portengen BL ![]() , Porro GL, Bergsma D, Veldman EJ, Imhof SM, Naber M
, Porro GL, Bergsma D, Veldman EJ, Imhof SM, Naber M
Received 24 February 2023
Accepted for publication 7 May 2023
Published 2 June 2023 Volume 2023:15 Pages 77—89
DOI https://doi.org/10.2147/EB.S409905
Checked for plagiarism Yes
Review by Single anonymous peer review
Peer reviewer comments 2
Editor who approved publication: Professor Margaret Wong-Riley
Brendan L Portengen,1,2 Giorgio L Porro,1,* Douwe Bergsma,3 Evert J Veldman,4 Saskia M Imhof,1 Marnix Naber2,*
1Department of Ophthalmology, University Medical Center Utrecht, Utrecht, the Netherlands; 2Experimental Psychology, Helmholtz Institute, Utrecht University, Utrecht, the Netherlands; 3HemianopsieStichting, Amersfoort, the Netherlands; 4Bartiméus Foundation, Zeist, the Netherlands
*These authors contributed equally to this work
Correspondence: Brendan L Portengen, Department of Ophthalmology, University Medical Center Utrecht, PO Box 85500, Room E 03.136, Utrecht, 3508 GA, the Netherlands, Email [email protected]
Purpose: We improve pupillary responses and diagnostic performance of flicker pupil perimetry through alterations in global and local color contrast and luminance contrast in adult patients suffering from visual field defects due to cerebral visual impairment (CVI).
Methods: Two experiments were conducted on patients with CVI (Experiment 1: 19 subjects, age M and SD 57.9 ± 14.0; Experiment 2: 16 subjects, age M and SD 57.3 ± 14.7) suffering from absolute homonymous visual field (VF) defects. We altered global color contrast (stimuli consisted of white, yellow, cyan and yellow-equiluminant-to-cyan colored wedges) in Experiment 1, and we manipulated luminance and local color contrast with bright and dark yellow and multicolor wedges in a 2-by-2 design in Experiment 2. Stimuli consecutively flickered across 44 stimulus locations within the inner 60 degrees of the VF and were offset to a contrasting (opponency colored) dark background. Pupil perimetry results were compared to standard automated perimetry (SAP) to assess diagnostic accuracy.
Results: A bright stimulus with global color contrast using yellow (p= 0.009) or white (p= 0.006) evoked strongest pupillary responses as opposed to stimuli containing local color contrast and lower brightness. Diagnostic accuracy, however, was similar across global color contrast conditions in Experiment 1 (p= 0.27) and decreased when local color contrast and less luminance contrast was introduced in Experiment 2 (p= 0.02). The bright yellow condition resulted in highest performance (AUC M = 0.85 ± 0.10, Mdn = 0.85).
Conclusion: Pupillary responses and pupil perimetry’s diagnostic accuracy both benefit from high luminance contrast and global but not local color contrast.
Keywords: perimetry, pupillometry, visual field, scotoma, color contrast, luminance contrast
Introduction
Pupil perimetry utilizes pupillary responses to light stimuli as a measure of visual field sensitivity. The greater the amplitude (or shorter the peak response latency) of a pupil response, the greater the chance that the stimulus was properly seen and processed by the observer.1–5 Pupil perimetry produces an objective, continuous and graded response, while standard automated perimetry (SAP) outputs a subjective threshold that measures the light intensity required to trigger sensory perception. As such, pupil perimetry could be useful for patients unable to reliably provide verbal and/or motor feedback during SAP (ie young or neurologically impaired individuals).6,7
Traditionally, pupil perimetry uses presentations of white stimuli with high brightness to evoke pupil responses. The reasoning behind this goes as follows: the brighter the stimulus, the more robust (ie, high signal-to-noise ratio) the pupil response, and the better the diagnostic performance. Interestingly, the pupil not only responds to luminance when a luminance contrast is created between a bright stimulus and a dark background. It also responds to other physiological, psychological, neurological factors and sensory modalities.8–16 In line with this, the pupil has been shown to respond to a multitude of contrast modalities, such as changes in luminance,17 spatial frequency,18 and color contrast.18–22 Moreover, the speed and amplitude of these so-called pupil orienting responses13 seem to scale with stimulus saliency.23–27 Hence, increased saliency through combined color and luminance contrast between stimulus and background results in stronger pupil responses because a substantial component of pupillary responses consists of color processing.28 Following this rationale, saliency of a stimulus can be increased by introducing an additional stimulus-background and intra-stimulus color contrast component. When salience improves, pupil responses are also expected to improve, and potentially the diagnostic accuracy of pupil perimetry may also be enhanced.28
Here we focus on assessing color pupil perimetry on patients with homonymous hemianopia caused by cerebral damage to the visual cortex. While hemianopic patients often suffer from large and mostly absolute scotomas, they are known to experience difficulties in reliably performing SAP tests.6 Only few studies showed that pupils of patients with homonymous hemianopia are unresponsive to color stimuli in their damaged hemifield.29 Most studies, however, showed reduced pupillary responses to white stimuli in the damaged visual field (VF).30 It is also important to stress that it is currently unclear whether better diagnostic performance of pupil perimetry can be achieved by enhancing pupil responses through stimulus enhancements like adding color. Conversely, while pupillary responses generally benefit from strong luminance contrasts by showing highly luminant stimuli superimposed on dark backgrounds,5,30 recent developments in pupil perimetry advocate less luminant stimuli with reduced blue content (ie yellow) to increase test performance of multifocal pupil perimetry in healthy subjects and patients with glaucoma and age-related macular degeneration.31,32 Between-subject variance to blue-containing stimuli is hypothesized to stem from lens brunescence and the variable density of blue-blocking macular pigment.33–35 Despite these great efforts to improve multifocal pupil perimetry, it is still unclear how luminance and color independently affect the diagnostic performance of flicker pupil perimetry in neurologically impaired individuals.
In this paper we report on a study that tested whether alterations to global and local color contrast and to luminance contrast affect not only pupil responses but also the diagnostic accuracy of pupil perimetry in patients suffering from cerebral visual impairment (CVI), a patient population in which SAP is not always suited. More specifically, the goal of this study is to investigate whether stimulus color, stimulus intra-color and stimulus luminance contrast effects positively impact diagnostic accuracy of pupil perimetry in patients suffering from homonymous visual field defects due to neurological impairment.
Methods
Participants
All participants (Experiment 1: 19, of which 4 female, age M and SD 57.9 ± 14.0; Experiment 2: 16, of which 3 female, age M and SD 57.3 ± 14.7) suffered from absolute homonymous visual field defects (VFDs) due to neurological impairment. This sample size was determined based on previous studies that showed significant effects of flicker pupil perimetry. See Table S1 for patient demographics. Two more participants were invited but were excluded because their VFDs were of a relative nature. Some participants did not complete both experiments due to personal reasons.
The experiments were approved by the local ethics committee of Utrecht University (approval number FETC19-006) and conformed to the tenets of the Declaration of Helsinki. Participants gave written informed consent prior to participation. Furthermore, they received financial reimbursement for participation (€12,50 per hour) and travel costs. Patients were requested to refrain from alcohol or caffeine consumption at least 2 hours before each session.
Apparatus and Stimuli
All experiments were conducted in a darkened room without ambient light. Stimuli were generated on a Dell desktop computer (Dell Technologies, Round Rock, TX) with the Windows 7 operating system (Microsoft, Redmond, WA), using MATLAB (MathWorks, Natick, MA) and the Psychtoolbox 3 and Eyelink toolbox extensions.36–39 We used a 143 by 63 cm LG OLED65B8PLA (LG Electronics, Seoul, South Korea) monitor with a resolution of 1920 by 1080 and a refresh rate of 60 Hz to display stimuli. Stimulus luminance was measured with a PR-650 SpectraScan Colorimeter (Photo Research Inc., Chatsworth, CA, USA). Pupil size and gaze angle were tracked with an EyeLink 1000 eye-tracker (SR Research, ON, Canada; 0.5-degree accuracy of gaze angle), which recorded only the right eye from above through a hot (infra-red reflecting) mirror (tower mount). The EyeLink toolbox extension for the Psychtoolbox37 on the presentation computer enabled communication and stimulus presentation synchronization with the pupil size recordings on the eye-tracking computer. Start and stop triggers and stimulus presentation messages were sent from the presentation computer to the eye-tracking computer by means of an Ethernet cable with negligible latency (for more details, see the SR Research manual). A participant’s head and viewing distance were fixed using a forehead- and chinrest at a 75-cm distance from the monitor. The eye-tracker calibration procedure consisted of a five-point grid and took ~1 min. The Eyelink tracker software outputs pupil size in arbitrary units rather than absolute pupil diameter in millimeters, and we refrained from converting the units as the current study only concerns within-subject comparisons.
Experiment 1 – Stimulus Color Contrast
The stimuli consisted of white, yellow, cyan and yellow-equiluminant-to-cyan (equi-yellow) colored wedges with 100% brightness (212 cd/m2, x, y: 276, 285; 212 cd/m2, x, y: 406, 554; 134 cd/m2, x, y: 179, 235, respectively, the equi-yellow differed per participant), each presented consecutively at one of the 44 stimulus locations (see Figure 1a and b). Subjectively equal brightness (equiluminance) between yellow and cyan was established using a flicker fusion calibration before start of the experiment; a cyan screen was presented continuously while a yellow color flickered on top of the background at a 30 Hz frequency. The luminance of the yellow color was adjusted until the flickering was the least noticeable. Subsequently, this yellow color was used as the yellow-equiluminant-to-cyan color condition. This equiluminance was introduced to control for the effect of the higher luminance of the yellow stimuli on the pupil when compared to the cyan stimuli. During the experiment, the size of a wedge was increased as a function of eccentricity using a cortical magnification factor (radial width = eccentricity1.12 in degrees) to activate approximately equal numbers of neurons by both central and peripheral stimuli (eg, see40). Stimuli flickered between colored and black at 2 Hz for 5 s per trial, and a red fixation point was placed at the center of the presentation monitor (see Figure 1b). A flicker paradigm was used as it is known to produce oscillatory pupil orienting responses with amplitudes reflecting the degree to which a stimulus onset is visually processed (ie, stimulus salience;5,30,41). The stimuli were superimposed on an opponency colored (ie, as modelled by the CIELAB color space, a three-dimensional color space that covers the entire gamut of human color perception, such as a yellow/ocher stimulus on a dark cyan background) background with 28% saturation.28 The pupil response thus consisted of both luminance and color components.
 |
Figure 1 Four stimulus color conditions (ie, white, cyan, yellow-equiluminant-to-cyan, and yellow) were tested, each with 44 different stimulus locations distributed across the inner 60-degrees of the visual field (a). On every stimulus location a wedge flickered color-to-black at a 2 Hz frequency for 5 seconds (b). To ensure accurate retinotopic stimulation, a gaze-contingent stimulus presentation was used (c), ie, online correction of stimulus locations for saccades from fixation target. Participants were instructed to report the appearance of cues around stimuli which appeared in ~40% of the trials for 0.25 seconds (d). |
Experiment 2 – Stimulus Luminance and Intra-Stimulus Color Contrast
The aim of Experiment 2 was to explore the effect of (i) local (intra-stimulus) color contrast (as opposed to global color contrast between stimulus and background) and (ii) stimulus luminance on pupillary responses and diagnostic accuracy. Experiment 2 was similarly set-up to Experiment 1 but the stimulus differed: a 100% (bright) and 75% (dark) brightness yellow and multicolor wedge flickered between colored and black (Figure 2a and b). The multicolor wedge consisted of nine smaller wedges colored white, red, green and yellow in a semirandom pattern that changed for every new appearance. All wedges were superimposed on a 28% brightness blue background.
 |
Figure 2 Four color and brightness conditions of Experiment 2: yellow and multicolor stimulus wedges at 100% and 75% brightness (a). Experiment set-up did not differ from Experiment 1; the same stimulus locations, gaze-contingent stimulus presentation and attention task were used. For the multicolor conditions, wedge color composition was comprised of smaller white, yellow, red and green wedges which semi-randomly varied at every appearance within a trial (b). |
Procedure
Participants were instructed to continuously gaze at the red fixation point in the middle of the screen. We additionally instructed participants to covertly attend the flickering stimuli, each presented in a gaze-contingent manner (see Figure 1c), and report the appearance of cues because attention to stimuli has been shown to evoke stronger pupil responses.5,42 These cues consisted of thin red edges around the flickering stimuli that appeared in ~40% of the trials for 0.25 s (see Figure 1d). If the eye tracker recorded less than 80% of the available data in a 5-s trial (eg, due to excessive blinking), the trial was recycled at the end of the experiment block. Participants were tested at varying times of the day. Only the right eye was recorded, the left eye was patched with an (adhesive) eye patch. Test duration for each stimulus variant was 220 s (5-s stimulus presentation, 44 stimulus regions). Recalibrations were performed after each block. Each experiment lasted 880 s (44 stimulus locations * 5 s per location * 4 stimulus colors), excluding (re)calibration and breaks.
Analysis
The continuous pupil recordings were analyzed in an event-related manner with the first stimulus onset per new location as start events. Blinks were detected and filtered using a speed threshold of 4 standard deviations (SD) above the mean. The detected blink periods shorter than 600ms were interpolated with a Piecewise Cubic Hermite Interpolating Polynomial (PCHIP) method (interp1 MATLAB function). Trials with less than 80% data were removed from analysis. To filter out low-frequency noise and create baseline corrected traces showing pupillary oscillation patterns around zero, we subtracted pupil traces filtered with a 2nd-order Butterworth filter with a 1 Hz cut-off frequency (ie, we applied a high-pass filter). High-frequency noise was removed by filtering the high-pass filtered pupil traces with a 5th-order Butterworth filter with a 15 Hz cut-off frequency. Pupil traces were filtered per event (ie, per stimulus location). Pupil traces were then converted to power spectral density estimates in the frequency domain using a fast Fourier transform (FFT) per trial. The power measurement at 2 Hz reflected the amplitude of the pupil oscillation pattern evoked by a stimulus and served as the main dependent variable. We now refer to this measurement as the pupil response amplitude. To determine statistical significance of differences in pupil response amplitudes across stimulus color conditions and stimulus luminance, we performed one- and two-way repeated-measures analyses of variance (ANOVA). Post-hoc paired double-sided t-tests were performed to test for differences in pupil response amplitudes and discriminative power across conditions.
Performance of each stimulus color and luminance condition was based on how well it distinguished between seen or not seen stimuli. Most recent standard automated perimetry (SAP) results served as ground truth to create subjective perimetry maps per subject; all stimulus locations were scored (0 = invisible, 1 = visible) to create a dichotomous outcome for analysis. Performance was then evaluated through calculation of the area under the curve (AUC) of the receiver operating characteristics (ROC) with visibility as dichotomous dependent variable and pupil oscillation power as independent variable. Using signal detection theory, the degree of overlap between pupil response amplitudes distributions of the intact versus defect visual field locations could be estimated. An AUC of 0.5 means that the compared distributions are not dissociable (ie low sensitivity), while an AUC of 1.0 means that the distributions do not overlap (ie high sensitivity). Normalized two-dimensional pupil sensitivity maps were created to graphically visualize visual field defects as measured with pupil perimetry. Experiment data and analysis files are available on https://osf.io/uj4gr
Results
Experiment 1
For Experiment 1, the aim was to assess the effect of four global color contrast conditions (ie white, yellow, cyan and yellow-equiluminant-to-cyan; see Figure 1a) on pupillary responses and discriminative power in CVI patients. First, pupil responses to on- and offsets of the 2 Hz flickering stimuli were inspected. Figure 3a shows the averaged pupillary response across all 44 stimulus locations for an exemplary subject when stimulated in the intact (black line) and damaged (red line) VF. For this particular subject, the oscillation amplitude appears greater for the intact as compared to the damaged VF. To estimate whether this effect generalized across color conditions, we computed pupil response amplitudes based on the FFT-estimated oscillation power at 2 Hz as a measure of pupil sensitivity per condition (for FFT-based power density estimates of the exemplary subject, see Figure 3b). When plotting the average pupil response amplitudes across trials for this subject, we indeed observed consistently stronger responses to stimuli presented in intact as compared with damaged VF regions (Figure 3c). This effect was also consistent across all four color conditions. To investigate statistical differences in pupil response amplitudes for intact regions across conditions for all subjects (Figure 4a), a one-way repeated measures ANOVA revealed a significant main effect of color on pupil response amplitudes (F3,18 = 2.93, p= 0.04). Post-hoc comparisons between conditions revealed that the pupil response amplitudes to yellow and white stimuli (presented on cyan and dark gray backgrounds, respectively) differed significantly from the yellow-equiluminant-to-cyan condition (see Table S2 for post-hoc tests), which evoked the weakest pupillary responses overall. As such, we observed potentially favorable pupil responses to white and fully luminant yellow stimuli.
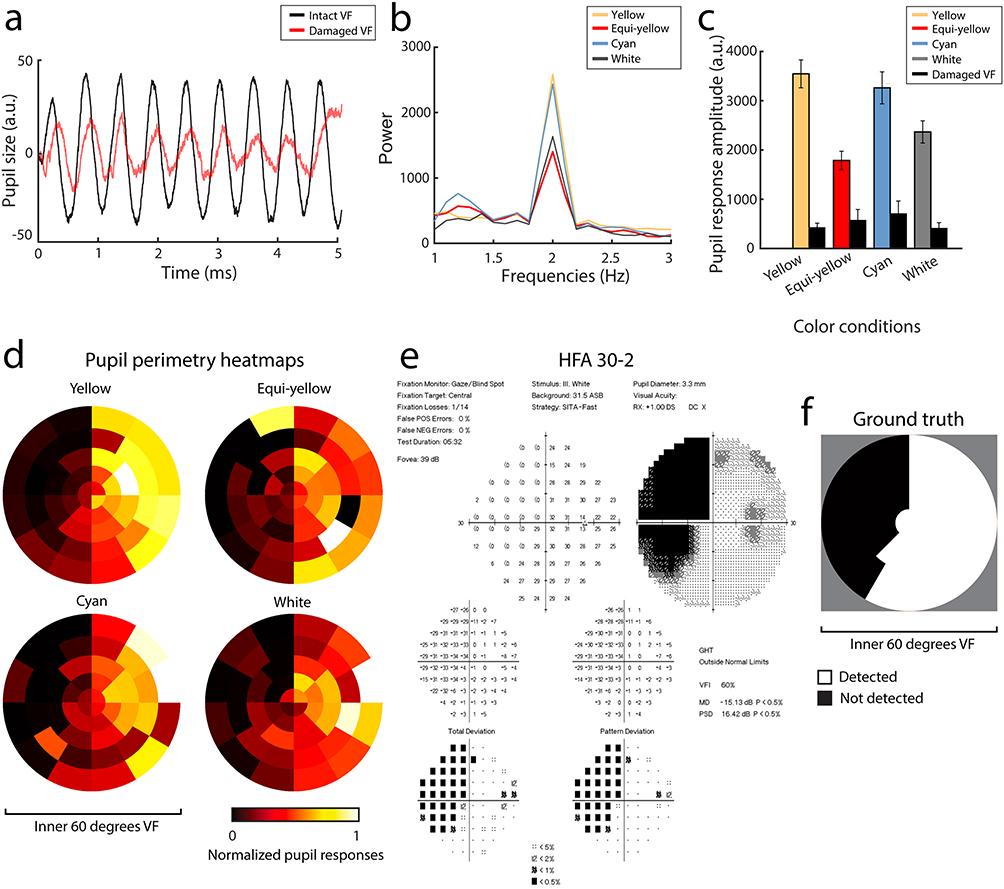 |
Figure 3 Results of an exemplary subject of Experiment 1. Relative pupil size over time (a) for intact (black line) and damaged (red line) visual field (VF) averaged across all 44 stimulus locations. The FFT computed pupil oscillation power (b) Peaks at 2 Hz across all conditions (yellow, yellow-equiluminant-to-cyan, cyan and white). (c) Shows the pupil response amplitude with standard errors, first averaged across stimuli and then divided between the intact and damaged VF (see panel f for an example of VF segmentation) across stimulus color conditions. Note that all pupil sizes are outputted in arbitrary units (a.u.) rather than absolute millimetres due to the Eyelink tracker software. Normalized pupil perimetry heatmaps (d) of the inner 60-degrees of the VF show pupil sensitivities per stimulus location (weak sensitivity: red to black, strong sensitivity: yellow to white). (e) Displays standard perimetry (SAP) Humphrey Field Analyzer (HFA) 30–2 results of the same subject. (f) Shows the converted SAP results (black = damaged VF, white = intact VF) which served as ground truth for the analysis in panel c. |
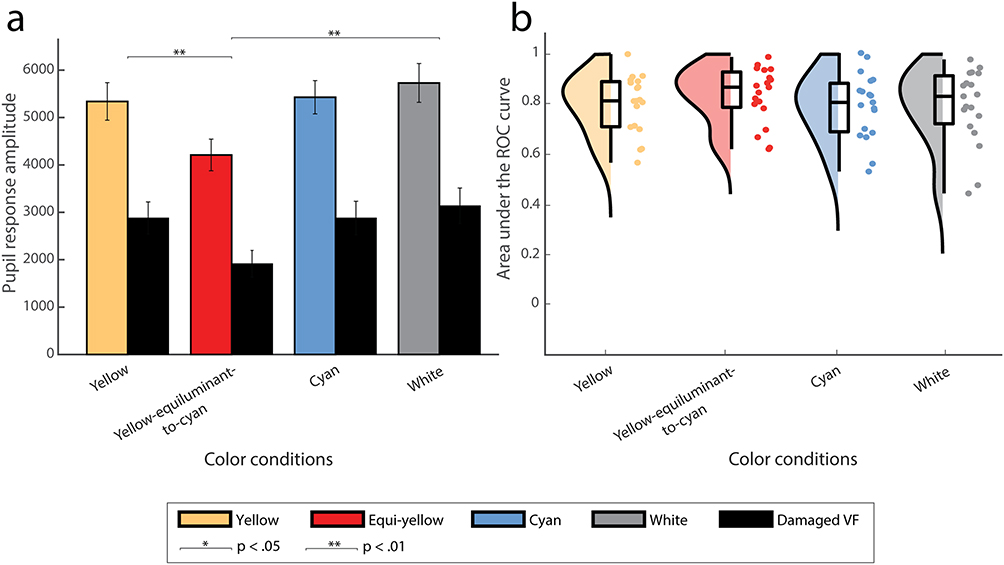 |
Figure 4 Pupil response amplitudes for intact and damaged VF, averaged across stimuli and subjects for all four stimulus color conditions, are plotted in (a). Asterisks reflect statistical significance between conditions (*for p< 0.05, **for p< 0.01). Raincloud plot (a hybrid plot consisting of a halved violin plot, a box-and-whisker plot with median, first and third quartile and standard errors, and scattered individual measurements) comparing discriminative performance (area under the receiver operating characteristics [AUC] curve) across conditions (yellow, yellow-equiluminant-to-cyan, cyan and white) is shown in (b). |
However, not only strong signals but also discriminative power matters for pupil perimetry. To further explore which color condition resulted in the best detection of damaged VF regions, we plotted the visual field maps. Figure 3d and e show visual field maps of one test subject (see Figure S1 for all subjects) for objective pupil perimetry and subjective conventional automated perimetry (ie SAP), respectively. Both pupil perimetry and Humphrey Field Analyzer (HFA) 30–2 revealed a similar partial left-side hemianopia. These similarities between the pupil perimetry conditions and SAP extended to most subjects, but some pupil perimetry maps revealed individual differences between conditions (eg for subject s14 the patterns were similar for the yellow and yellow-equiluminant-to-cyan conditions, but not for cyan and white). To examine discriminative power across conditions, AUC values were calculated by comparing pupil response amplitudes across trials for intact versus damaged regions per subject. The segmentation of intact and damaged VF regions was based on SAP results. Original SAP results (Figure 3e) were converted to dichotomous (binary) measures to create the two categories of intact versus damaged regions as ground truth (see Figure 3f for this conversion of the current exemplary subject and Figure S1 for all participants). Figure 4b displays a raincloud plot with AUC values that highlight the discriminative power of pupil perimetry between intact and damaged regions for all participants across conditions. The averaged AUCs did not significantly differ across color conditions (M and SD = 0.80 ± 0.12, 0.83 ± 0.11, 0.79 ± 0.13 and 0.79 ± 0.15; Mdn = 0.81, 0.86, 0.81, 0.83 for yellow, equi-yellow, cyan and white, respectively; F3,16 = 1.36, p = 0.27). This means that overall discriminative power was similar across conditions despite the differences in pupil response amplitudes.
Experiment 2
We were also interested in the effect of increases in local color contrast and decreases in brightness of stimuli on pupillary responses and the discriminative performance of pupil perimetry. As such, in Experiment 2 we compared four conditions in a 2-by-2 design, with two bright and two dark stimulus conditions, each with or without a local color contrast condition (see Figure 2). As in Experiment 1, pupil size of a different exemplary subject than that was presented for Experiment 1 showcased a stronger oscillatory pattern over time at 2Hz evoked by the flickering wedges presented at intact as compared with damaged regions (see Figure 5a and b). Again, this effect was consistent across all color and luminance conditions (ie, yellow and multicolor at 75% and 100% luminance). Pupil response amplitudes were also computed per condition for this exemplary subject, showing stronger pupil responses for bright as compared to dark stimuli (Figure 5c). To investigate whether a similar pattern was seen across all subjects, we performed a two-way repeated-measures ANOVA that revealed a significant main effect of brightness (F1 = 18.06, p< 0.001), but no significant effects were found for local color contrast. Post-hoc paired Student’s t-tests indicated that increased stimulus brightness enhances pupil responses (see Figure 6a and Table S3).
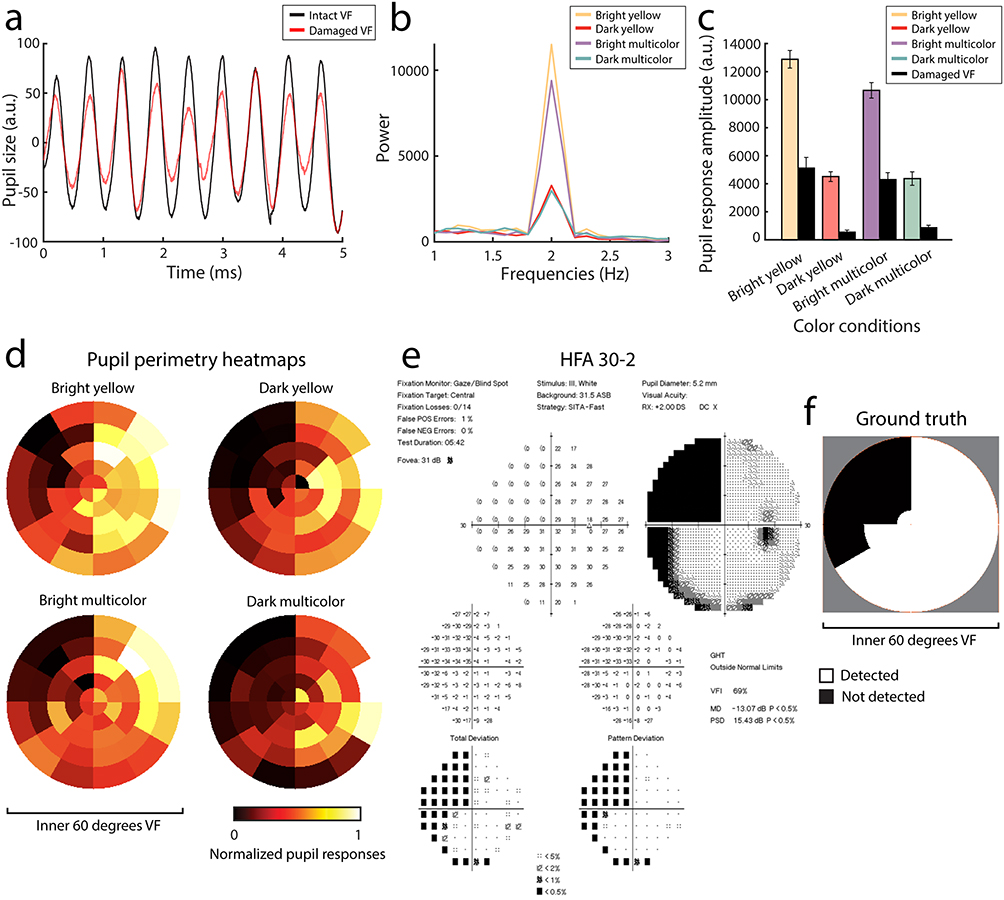 |
Figure 5 The same as Figure 3 but now for Experiment 2 with a new set of conditions (ie a 2-by-2 design with bright and dark yellow and multicolor conditions) and a different exemplary subject. Relative pupil size over time (a) For intact (black line) and damaged (red line) visual field (VF) averaged across all 44 stimulus locations. The FFT computed pupil oscillation power (b) Peaks at 2 Hz across all conditions (bright and dark yellow and multicolor). (c) Shows the pupil response amplitude with standard errors, first averaged across stimuli and then divided between the intact and damaged VF (see panel f for an example of VF segmentation) across stimulus color conditions. Note that all pupil sizes are outputted in arbitrary units (a.u.) rather than absolute millimeters due to the Eyelink tracker software. Normalized pupil perimetry heatmaps (d) Of the inner 60-degrees of the VF show pupil sensitivities per stimulus location (weak sensitivity: red to black, strong sensitivity: yellow to white). (e) Displays standard perimetry (SAP) Humphrey Field Analyzer (HFA) 30–2 results of the same subject. (f) Shows the converted SAP results (black = damaged VF, white = intact VF) which served as ground truth for the analysis in panel c. |
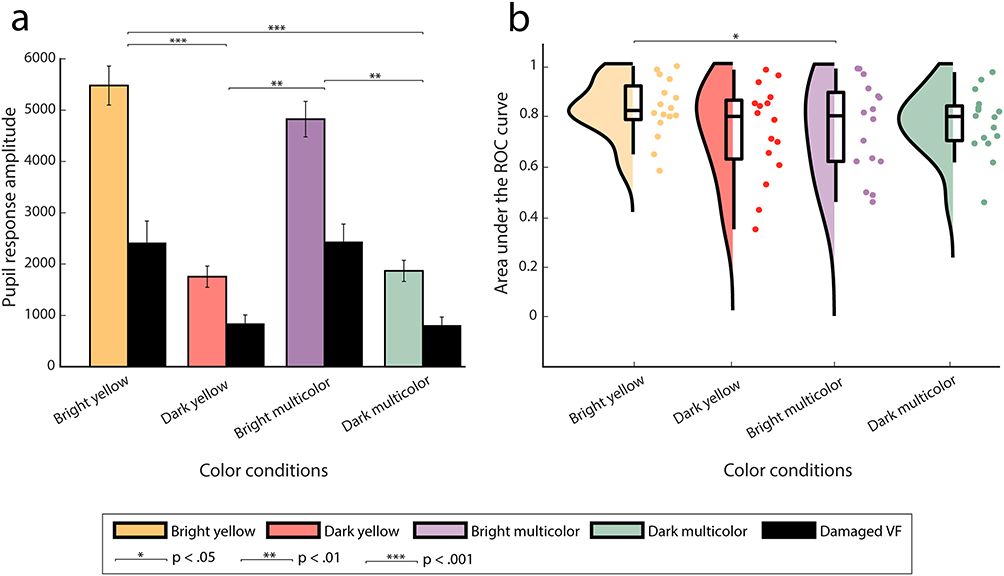 |
Figure 6 Similar plots to Figure 4 but now for the conditions used in Experiment 2. Pupil response amplitudes for intact and damaged VF, averaged across stimuli and subjects for all four conditions, are plotted in (a). Asterisks reflect statistical significance between conditions (*for p< 0.05, **for p< 0.01, ***for p< 0.001). Raincloud plot comparing discriminative performance (area under the receiver operating characteristics [AUC] curve) across conditions (bright and dark yellow and multicolor) is shown in (b). |
Figure 5d–f shows the conventional HFA 30–2 and pupil perimetry results for the aforementioned exemplary subject. These maps also showed an overlapping pattern, as was the case for most subjects (see Figure S2). Interestingly, some patients exhibited individual differences across conditions (eg in subjects s7 and s14 the dark yellow condition indeed shows an overlapping pattern, while the bright yellow condition did not). The calculated discriminative power across conditions is shown in Figure 6b. Average AUC values across subjects were highest for the bright yellow condition (M = 0.85 ± 0.10, Mdn = 0.85) as opposed to dark yellow (M = 0.78 ± 0.16, Mdn = 0.83), bright multicolor (M = 0.79 ± 0.15, Mdn = 0.83) and dark multicolor (M = 0.81 ± 0.11, Mdn = 0.83) conditions. The two-way repeated measures ANOVA revealed no significant main effects for local color contrast and brightness but did show a significant crossover interaction (F15 = 7.39, p= 0.02). Post-hoc analyses (Table S4) indicated that a bright yellow stimulus without local intra-color contrast enhanced pupil perimetry performance more than a stimulus with local intra-color contrast.
Discussion
The aim for this study was to test whether alterations to global and local color contrast and to luminance contrast affect not only pupil responses but also diagnostic performance of flicker pupil perimetry performance for detecting visual field defects in patients suffering from visual field defects due to cerebral visual impairment (CVI).
In Experiment 1, four stimulus color conditions (ie, white, yellow, cyan and yellow-equiluminant-to-cyan) with a complementary colored background were investigated. Although fully luminant yellow and white stimuli affected pupillary responses more strongly, discriminative power was similar across all conditions, including the cyan and yellow-equiluminant stimuli. This result is not fully in line with the hypothesis of Maeda et al4 stating that pupil responses to blue light presented in the damaged visual field may still occur when the subcortical intrinsically photosensitive retinal ganglion cell (ipRGC) pathway remains intact. Hypothetically, if blue-absent colors are used for stimuli and a blue-colored background was used to desensitize, it would be possible to more accurately distinguish the damaged from the intact visual field in patients only suffering from cortical damage (excluding ipRGC) but not retinal damage (including ipRGC). Residual blue light- and ipRGC-driven pupil responses then do not contaminate the impaired cortically driven pupil responses depending on feedback from the visual cortex. As such, the use of yellow rather than blue stimuli would be advocated in case of testing CVI patients, and several research groups have started using chromatic pupil perimetry to improve diagnostic performance of pupil perimetry.4,19,43,44 However, ipRGCs not only receive input from melanopsin but are also affected by rods and cones.45–48 Thus, rod- and cone-driven pupil responses can still be observed if blue-absent light is used. This may explain the homogeneous results across color conditions found in this study.
Although our results show that chromatic stimuli do not substantially impact diagnostic performance, chromatic pupil perimetry could provide additional information about another aspect of a patient’s visual system as opposed to a solely luminance-based pupil perimetry method. The pupil perimetry heatmaps of some patients (see Figures S1 and S2) were very similar across chromatic conditions. Interestingly, for others only a certain color condition resembled the SAP results (eg only the bright yellow or multicolor condition resulted in strong diagnostic performance, while other conditions showed differing patterns from SAP). This within-subject chromatic pupil sensitivity variability could stem from some form of blindsight, which causes the pupil to respond to only certain colors along the edge of the visual field defect. Future studies on a larger study population might provide insight regarding these possibly blindsight-like processes to not only motion, but also color. In time, not one but multiple chromatic variants per visual field location in a patient may portray visual field function most accurately with pupil perimetry.
Pupil orienting responses (ie, pupil responses to salient events such as onsets of bright stimuli) scale with stimulus saliency.13 Adding local color contrast and optimal spatial frequency to a stimulus should increase saliency and pupil responses therewith.28,49–51 Interestingly, our results show that an increase in local (intra-stimulus) color contrast (and thus saliency) did not improve the responses. Conversely, our results show that not local intra-stimulus color contrast, but more global contrast with a single-colored stimulus and a contrasting background color achieves greatest pupillary responses. Thus, color contrast of lower spatial frequency presumably contributes less to saliency than expected. Moreover, contrary to results from prior research using multifocal pupil perimetry,31,32 the flicker pupil perimetry method does not benefit from stimuli with decreased brightness. Specifically, fully luminant and single-color stimuli (regardless of choice of color) with an opponency colored background increases saliency and discriminative performance in the currently studied patient population.
The pupil perimetry method used in the current study was first proposed by Naber et al.30 Since then, several improvements were introduced: (i) luminance and color contrast components between stimulus and background,5,28 (ii) stimuli adjusted for the cortical magnification factor,41 and (iii) optimized analyses (ie, calculating FFT pupil power as opposed to standard deviation, coherence or signal-to-noise ratio, PCHIP interpolation as opposed to a cubic spline). All this has led to improved diagnostic performance. For example, the normalized pupil perimetry heatmaps of the current method showcased similarity to the standard automated perimetry (SAP) results. Also, a high discriminative power was achieved; a mean AUC of 0.85, the highest test performance when compared to prior research and other pupil perimetry methods assessed in CVI patients.2,3,30,52 Other methods that utilize pupillary responses to assess visual sensitivity consist of unifocal53–55 and multifocal56,57 stimulus presentations or multiple frequency tagging.58 Their attempts mainly focused on detecting glaucoma, a disease that asks for long-term monitoring to detect small decrements of function in the peripheral visual field. We suggest that pupil perimetry might be more suited to the screening of visual field defects (VFDs) caused by brain disease (eg cerebral infarction or tumor) which are more often larger and less prone to subtle changes. A limitation to this study (and other studies involving pupil perimetry) is the small sample size. It is important to assess pupil perimetry’s performance in larger study populations to truly objectivate its role in visual field assessment. It is also important to note that the pupil perimetry method is hindered by the larger stimuli needed to evoke robust pupillary responses, resulting in a visual sensitivity map with low spatial resolution. SAP provides a more precise estimation of visual field function due to the smaller stimuli used. Nevertheless, pupil perimetry might be a valuable addition to SAP in the diagnostic workup of suspected VFDs.
As a matter of fact, in certain situations, VF assessment with pupil perimetry has merit over SAP. The gaze-contingent presentation of stimuli ensures accurate retinotopic stimulation. Along with its apparent objectivity (thus eliminating the need for subjective motor responses), pupil perimetry might prove useful for patients suspected of malingering or for young and multi-handicapped patients unable to reliably provide verbal and/or motor feedback during SAP. Also, pupil perimetry can be used in a more patient-friendly way by using head-mounted apparatus.59 Future research might focus on the application of virtual reality technology as a cheap alternative to increase applicability in children,60 a patient demographic which is well known to have unreliable SAP measurements.7,61–63
Conclusion
In conclusion, high diagnostic performance was found using varying types of chromatic and non-chromatic flicker pupil perimetry for the assessment of visual field defects in patients with CVI. The addition of local color contrast did not positively impact pupil response sensitivity. As such, we recommend the use of bright stimuli without a local color contrast component offset to a darker and contrasting background to achieve best visual field test results.
Funding
This work was supported by the ODAS foundation (grant number 2017-03), the Rotterdamse Stichting Blindenbelangen (grant number B20170004), the F.P. Fischer Foundation (grant number 170511]) and a grant from the Janivo Foundation (grant number 2017170). M.N. is supported by a grant from UitZicht (grant 2018-10, fund involved Rotterdamse Stichting Blindenbelangen).
Disclosure
The authors report no conflicts of interest in this work.
References
1. Kardon RH, Kirkali PA, Thompson HS. Automated pupil perimetry pupil field mapping in patients and normal subjects. Ophthalmology. 1991;98(4):485–496. doi:10.1016/S0161-6420(91)32267-X
2. Skorkovská K, Wilhelm H, Lüdtke H, Wilhelm B. How sensitive is pupil campimetry in hemifield loss? Graefes Arch Clin Exp Ophthalmol. 2009;247(7):947–953. doi:10.1007/s00417-009-1040-7
3. Schmid R, Luedtke H, Wilhelm BJ, Wilhelm H. Pupil campimetry in patients with visual field loss. Eur J Neurol. 2005;12(8):602–608. doi:10.1111/j.1468-1331.2005.01048.x
4. Maeda F, Kelbsch C, Straßer T, et al. Chromatic pupillography in hemianopia patients with homonymous visual field defects. Graefes Arch Clin Exp Ophthalmol. 2017;255(9):1837–1842. doi:10.1007/s00417-017-3721-y
5. Portengen BL, Roelofzen C, Porro GL, Imhof SM, Fracasso A, Naber M. Blind spot and visual field anisotropy detection with flicker pupil perimetry across brightness and task variations. Vision Res. 2021;178(October2020):79–85. doi:10.1016/j.visres.2020.10.005
6. Goodwin D. Homonymous hemianopia: challenges and solutions. Clin Ophthalmol. 2014;8:1919–1927. doi:10.2147/OPTH.S59452
7. Portengen BL, Koenraads Y, Imhof SM, Porro GL. Lessons learned from 23 years of experience in testing visual fields of neurologically impaired children. Neuro-Ophthalmology. 2020;44(6):361–370. doi:10.1080/01658107.2020.1762097
8. Odgaard EC, Arieh Y, Marks LE. Cross-modal enhancement of perceived brightness: sensory interaction versus response bias. Percept Psychophys. 2003;65(1):123–132. doi:10.3758/BF03194789
9. Zele AJ, Adhikari P, Feigl B, Cao D. Cone and melanopsin contributions to human brightness estimation. JOpt Soc Am A. 2018;35(4):B19–B25. doi:10.1364/josaa.35.000b19
10. Donofrio RL. Review paper: the Helmholtz-Kohlrausch effect. J Soc Inf Disp. 2011;19(10):658. doi:10.1889/jsid19.10.658
11. Brown TM, Tsujimura SI, Allen AE, et al. Melanopsin-based brightness discrimination in mice and humans. Chem Biol. 2012;22(12):1134–1141. doi:10.1016/j.cub.2012.04.039
12. Drew P, Sayres R, Watanabe K, Shimojo S. Pupillary response to chromatic flicker. Exp Brain Res. 2001;136(2):256–262. doi:10.1007/s002210000605
13. Strauch C, Wang CA, Einhäuser W, Van der Stigchel S, Naber M. Pupillometry as an integrated readout of distinct attentional networks. Trends Neurosci. 2022;45(8):635–647. doi:10.1016/j.tins.2022.05.003
14. Knapen T, de Gee JW, Brascamp J, Nuiten S, Hoppenbrouwers S, Theeuwes J. Cognitive and ocular factors jointly determine pupil responses under equiluminance. PLoS One. 2016;11(5):e0155574. doi:10.1371/journal.pone.0155574
15. van Hooijdonk R, Mathot S, Schat E, Spencer H, van der Stigchel S, Dijkerman HC. Touch-induced pupil size reflects stimulus intensity, not subjective pleasantness. Exp Brain Res. 2019;237(1):201–210. doi:10.1007/S00221-018-5404-2/FIGURES/6
16. Wetzel N, Buttelmann D, Schieler A, Widmann A. Infant and adult pupil dilation in response to unexpected sounds. Dev Psychobiol. 2016;58(3):382–392. doi:10.1002/DEV.21377
17. Ukai K. Spatial pattern as a stimulus to the pupillary system. JOpt Soc Am A. 1985;2(7):1094–1100. doi:10.1364/josaa.2.001094
18. Barbur JL, Harlow AJ, Sahraie A. Pupillary responses to stimulus structure, colour and movement. Ophthalmic Physiol Opt. 1992;12(2):137–141. doi:10.1111/j.1475-1313.1992.tb00276.x
19. Kelbsch C, Stingl K, Kempf M, et al. Objective measurement of local rod and cone function using gaze-controlled chromatic pupil campimetry in healthy subjects. Transl Vis Sci Technol. 2019;8(6):6. doi:10.1167/tvst.8.6.19
20. Gamlin PDR, Zhang H, Harlow A, Barbur JL. Pupil responses to stimulus color, structure and light flux increments in the rhesus monkey. In: Vision Research. Vol. 38. Pergamon;1998:3353–3358. doi:10.1016/S0042-6989(98)00096-0
21. Walkey HC, Hurden A, Moorhead IR, Taylor JAF, Barbur JL, Harlow JA. Effective contrast of colored stimuli in the mesopic range: a metric for perceived contrast based on achromatic luminance contrast. JOpt Soc Am A. 2005;22(1):17–28. doi:10.1364/josaa.22.000017
22. Tsujimura SI, Wolffsohn JS, Gilmartin B. Pupil response to color signals in cone-contrast space. Curr Eye Res. 2006;31(5):401–408. doi:10.1080/02713680600681327
23. Naber M, Frässle S, Einhäuser W, O. P. de Beeck HP. Perceptual rivalry: reflexes reveal the gradual nature of visual awareness. PLoS One. 2011;6(6):e20910. doi:10.1371/journal.pone.0020910
24. Sperandio I, Bond N, Binda P. Pupil size as a gateway into conscious interpretation of brightness. Front Neurol. 2018;9:1070. doi:10.3389/fneur.2018.01070
25. Mathôt S, Van der Stigchel S. New light on the mind’s eye: the pupillary light response as active vision. Curr Dir Psychol Sci. 2015;24(5):374–378. doi:10.1177/0963721415593725
26. Laeng B, Endestad T. Bright illusions reduce the eye’s pupil. Proc Natl Acad Sci U S A. 2012;109(6):2162–2167. doi:10.1073/pnas.1118298109
27. Suzuki Y, Minami T, Laeng B, Nakauchi S. Colorful glares: effects of colors on brightness illusions measured with pupillometry. Acta Psychol. 2019;198:102882. doi:10.1016/j.actpsy.2019.102882
28. Portengen BL, Porro GL, Imhof SM, Naber M. The trade-off between luminance and color contrast assessed with pupil responses. Transl Vis Sci Technol. 2023;12(1):15. doi:10.1167/TVST.12.1.15
29. Barbur JL. Learning from the pupil: studies of basic mechanisms and clinical applications. Vis Neurosci. 2003;641–656. doi:10.7551/MITPRESS/7131.003.0046
30. Naber M, Roelofzen C, Fracasso A, et al. Gaze-contingent flicker pupil perimetry detects scotomas in patients with cerebral visual impairments or glaucoma. Front Neurol. 2018;9(July):558. doi:10.3389/fneur.2018.00558
31. Carle CF, James AC, Sabeti F, et al. Clustered volleys stimulus presentation for multifocal objective perimetry. Transl Vis Sci Technol. 2022;11(2):5. doi:10.1167/tvst.11.2.5
32. Ho YL, Wong SSY, Carle CF, et al. Multifocal pupillographic perimetry with white and colored stimuli. J Glaucoma. 2010;20(6):336–343. doi:10.1097/ijg.0b013e3181efb097
33. van de Kraats J, Berendschot TTJM, Valen S, van Norren D. Fast assessment of the central macular pigment density with natural pupil using the macular pigment reflectometer. J Biomed Opt. 2006;11(6):064031. doi:10.1117/1.2398925
34. Pokorny J, Smith VC, Lutze M. Aging of the human lens. Appl Opt. 1987;26(8):1437. doi:10.1364/ao.26.001437
35. Weale RA. Age and the transmittance of the human crystalline lens. J Physiol. 1988;395(1):577–587. doi:10.1113/jphysiol.1988.sp016935
36. Brainard DH. The psychophysics toolbox. Spat Vis. 1997;10(4):433–436. doi:10.1163/156856897X00357
37. Cornelissen FW, Peters EM, Palmer J. The eyelink toolbox: eye tracking with MATLAB and the psychophysics toolbox. Behav Res Methods Instrum Comput. 2002;34(4):613–617. doi:10.3758/BF03195489
38. Kleiner M, Brainard DH, Pelli DG, Broussard C, Wolf T, Niehorster D. What’s new in psychtoolbox-3? A free cross-platform toolkit for psychophysics with matlab and GNU/octave; 2007. Available from: http://www.psychtoolbox.org.
39. Pelli DG. The VideoToolbox software for visual psychophysics: transforming numbers into movies. Spat Vis. 1997;10(4):437–442. doi:10.1163/156856897X00366
40. Rosenholtz R. Capabilities and limitations of peripheral vision. Annu Rev Vis Sci. 2016;2:437–457. doi:10.1146/annurev-vision-082114-035733
41. Portengen BL, Porro GL, Imhof SM, Naber M. Comparison of unifocal, flicker, and multifocal pupil perimetry methods in healthy adults. J Vis. 2022;22(9):7. doi:10.1167/jov.22.9.7
42. Binda P, Murray SO. Spatial attention increases the pupillary response to light changes. J Vis. 2015;15(2):1. doi:10.1167/15.2.1
43. Carle CF, James AC, Maddess T. The pupillary response to color and luminance variant multifocal stimuli. Invest Ophthalmol Vis Sci. 2013;54(1):467–475. doi:10.1167/iovs.12-10829
44. Chibel R, Sher I, Ben Ner D, et al. Chromatic multifocal pupillometer for objective perimetry and diagnosis of patients with retinitis pigmentosa. Ophthalmology. 2016;123(9):1898–1911. doi:10.1016/j.ophtha.2016.05.038
45. Dacey DM, Liao HW, Peterson BB, et al. Melanopsin-expressing ganglion cells in primate retina signal colour and irradiance and project to the LGN. Nature. 2005;433(7027):749–754. doi:10.1038/nature03387
46. Gamlin PDR, McDougal DH, Pokorny J, Smith VC, Yau KW, Dacey DM. Human and macaque pupil responses driven by melanopsin-containing retinal ganglion cells. Vision Res. 2007;47(7):946–954. doi:10.1016/J.VISRES.2006.12.015
47. Young RSL, Kimura E. Pupillary correlates of light-evoked melanopsin activity in humans. Vision Res. 2008;48(7):862–871. doi:10.1016/J.VISRES.2007.12.016
48. Zele AJ, Feigl B, Adhikari P, Maynard ML, Cao D. Melanopsin photoreception contributes to human visual detection, temporal and colour processing. Sci Rep. 2018;8(1):1–10. doi:10.1038/s41598-018-22197-w
49. Young RSL, Kimura E, Delucia PR. A pupillometric correlate of scotopic visual acuity. Vision Res. 1995;35(15):2235–2241. doi:10.1016/0042-6989(94)00303-3
50. Slooter J, van Norren D. Visual acuity measured with pupil responses to checkerboard stimuli. Invest Ophthalmol Vis Sci. 1980;19(1):105–108.
51. Barbur JL, Thomson WD. Pupil response as an objective measure of visual acuity. Ophthalmic Physiol Opt. 1987;7(4):425–429. doi:10.1111/j.1475-1313.1987.tb00773.x
52. Yoshitomi T, Matsui T, Tanakadate A, Ishikawa S. Comparison of threshold visual perimetry and objective pupil perimetry in clinical patients. J Neuroophthalmol. 1999;19(2):89–99. doi:10.1097/00041327-199906000-00003
53. Asakawa K, Shoji N, Ishikawa H, Shimizu K. New approach for the glaucoma detection with pupil perimetry. Clin Ophthalmol. 2010;4(1):617–623. doi:10.2147/OPTH.S9936
54. Tatham AJ, Meira-Freitas D, Weinreb RN, Zangwill LM, Medeiros FA. Detecting glaucoma using automated pupillography. Ophthalmology. 2014;121(6):1185–1193. doi:10.1016/j.ophtha.2013.12.015
55. Kelbsch C, Maeda F, Strasser T, et al. Pupillary responses driven by ipRGCs and classical photoreceptors are impaired in glaucoma. Graefes Arch Clin Exp Ophthalmol. 2016;254(7):1361–1370. doi:10.1007/s00417-016-3351-9
56. Carle CF, James AC, Kolic M, Essex RW, Maddess T. Blue multifocal pupillographic objective perimetry in glaucoma. Invest Ophthalmol Vis Sci. 2015;56(11):6394–6403. doi:10.1167/iovs.14-16029
57. Carle CF, James AC, Kolic M, Essex RW, Maddess T. Luminance and colour variant pupil perimetry in glaucoma. Clin Exp Ophthalmol. 2014;42(9):815–824. doi:10.1111/ceo.12346
58. Ajasse S, Vignal-Clermont C, Mohand-Saïd S, Coen C, Romand C, Lorenceau J. One minute multiple pupillary frequency tagging test to assess visual field defects. medRxiv. 2022;2022. doi:10.1101/2022.01.24.22269632
59. Kimura T, Matsumoto C, Nomoto H. Comparison of head-mounted perimeter (imo®) and Humphrey field analyzer. Clin Ophthalmol. 2019;13:501. doi:10.2147/OPTH.S190995
60. Portengen BL, Naber M, Jansen D, et al. Maintaining fixation by children in a virtual reality version of pupil perimetry. J Eye Mov Res. 2022;15(3). doi:10.16910/JEMR.15.3.2
61. Morales J, Brown SM. The feasibility of short automated static perimetry in children. Ophthalmology. 2001;108(1):157–162. doi:10.1016/S0161-6420(00)00415-2
62. Patel DE, Cumberland PM, Walters BC, Russell-Eggitt I, Rahi JS, Thompson B; OPTIC study group O study. Study of Optimal Perimetric Testing in Children (OPTIC): feasibility, reliability and repeatability of perimetry in children. PLoS One. 2015;10(6):e0130895. doi:10.1371/journal.pone.0130895
63. Tschopp C, Safran AB, Viviani P, Bullinger A, Reicherts M, Mermoud C. Automated visual field examination in children aged 5–8 years: part I: experimental validation of a testing procedure. Vision Res. 1998;38(14):2203–2210. doi:10.1016/S0042-6989(97)00368-4
 © 2023 The Author(s). This work is published and licensed by Dove Medical Press Limited. The
full terms of this license are available at https://www.dovepress.com/terms
and incorporate the Creative Commons Attribution
- Non Commercial (unported, 3.0) License.
By accessing the work you hereby accept the Terms. Non-commercial uses of the work are permitted
without any further permission from Dove Medical Press Limited, provided the work is properly
attributed. For permission for commercial use of this work, please see paragraphs 4.2 and 5 of our Terms.
© 2023 The Author(s). This work is published and licensed by Dove Medical Press Limited. The
full terms of this license are available at https://www.dovepress.com/terms
and incorporate the Creative Commons Attribution
- Non Commercial (unported, 3.0) License.
By accessing the work you hereby accept the Terms. Non-commercial uses of the work are permitted
without any further permission from Dove Medical Press Limited, provided the work is properly
attributed. For permission for commercial use of this work, please see paragraphs 4.2 and 5 of our Terms.
Recommended articles
Virtual Reality Visual Field Testing in Glaucoma: Benefits and Drawbacks
Babel AT, Soumakieh MM, Chen AY, Wong C, R da Costa D, Almeida DR
Clinical Ophthalmology 2025, 19:933-937
Published Date: 17 March 2025
Peripherex Home Visual Field Demonstrates High Test-Retest Reliability, Validity
Schweitzer J, Ibach M, Berdahl J, Daoud M, Daoud YA, Kempinski Y, Goldberg JL
Clinical Ophthalmology 2025, 19:1877-1884
Published Date: 17 June 2025
Comparison of Visual Field Assessments Between the Humphrey Field Analyzer, Tempo, and Virtual Eye Elite Perimeters
Blehm C, Hall B
Clinical Ophthalmology 2025, 19:4535-4542
Published Date: 9 December 2025