Back to Journals » Nature and Science of Sleep » Volume 15
Effects of Sleep Reactivity on Sleep Macro-Structure, Orderliness, and Cortisol After Stress: A Preliminary Study in Healthy Young Adults
Authors Feng YZ ![]() , Chen JT
, Chen JT ![]() , Hu ZY
, Hu ZY ![]() , Liu GX
, Liu GX ![]() , Zhou YS
, Zhou YS ![]() , Zhang P
, Zhang P ![]() , Su AX
, Su AX ![]() , Yang S
, Yang S ![]() , Zhang YM, Wei RM, Chen GH
, Zhang YM, Wei RM, Chen GH ![]()
Received 2 April 2023
Accepted for publication 29 June 2023
Published 6 July 2023 Volume 2023:15 Pages 533—546
DOI https://doi.org/10.2147/NSS.S415464
Checked for plagiarism Yes
Review by Single anonymous peer review
Peer reviewer comments 2
Editor who approved publication: Prof. Dr. Ahmed BaHammam
Yi-Zhou Feng,1,* Jun-Tao Chen,1,2,* Zhen-Yu Hu,1,* Gao-Xia Liu,1 Yu-Shun Zhou,1 Ping Zhang,1 Ai-Xi Su,1 Shuai Yang,1 Yue-Ming Zhang,1 Ru-Meng Wei,1 Gui-Hai Chen1
1Department of Neurology (Sleep Disorders), Chaohu Hospital of Anhui Medical University, Hefei, Anhui, 238000, People’s Republic of China; 2Department of Neurology, Shangyu People’s Hospital of Shaoxing, Shaoxing, Zhejiang, 312000, People’s Republic of China
*These authors contributed equally to this work
Correspondence: Gui-Hai Chen, Department of Neurology (Sleep Disorders), Chaohu Hospital of Anhui Medical University, Hefei, Anhui, 238000, People’s Republic of China, Tel +86-13956094425, Email [email protected]
Purpose: To investigate changes and links of stress and high sleep reactivity (H-SR) on the macro-structure and orderliness of sleep and cortisol levels in good sleepers (GS).
Patients and Methods: Sixty-two GS (18– 40 years old) were recruited, with 32 in the stress group and 30 in the control group. Each group was further divided into H-SR and low SR subgroups based on the Ford Insomnia Response to Stress Test. All participants completed two nights of polysomnography in a sleep laboratory. Before conducting polysomnography on the second night, the stress group completed the Trier Social Stress Test and saliva was collected.
Results: The duration of NREM sleep stages 1, 2 (N1, N2) and rapid eye movement sleep (REM) decreased, and the values of approximate entropy, sample entropy, fuzzy entropy, and multiscale entropy increased under stress and SR effects. Stress increased rapid eye movement density, and H-SR increased cortisol reactivity.
Conclusion: Stress can damage the sleep and increase cortisol release in GS, especially those with H-SR. N1, N2 and REM sleep are more easily affected, while NREM sleep stage 3 sleep is relatively stable.
Keywords: cortisol, entropy, insomnia, polysomnography, sleep reactivity, stress
Introduction
Insomnia, which is a widespread sleep disorder accompanied by a public health issue, has attracted an increasing amount of attention in recent years.1 Nowadays, the number of people with insomnia is increasing and the average age of people with insomnia is getting lower; this situation is of great concern.2,3 Good and sufficient sleep are crucial for maintaining normal physiological and psychological functions. Patients with long-term insomnia often show severe impairments of physical and mental functions, including decreased immunity, underpowered academic performance, memory loss, impaired glucose tolerance, increased risks of cardiovascular disease and stroke, and a greater risk of mental disorders.4–7 Therefore, it is very important to improve the quality of sleep and reduce the incidence of insomnia; therefore, preventing the onset and development of insomnia should be a top priority. However, it remains difficult to complete these tasks as the pathogenesis of insomnia remains unclear.
Many hypotheses have been proposed to understand the mechanisms underlying insomnia. The “3P” model emphasizes the interaction of three factors (predisposing, precipitating, and perpetuating factors) in the onset and development of insomnia.8 The point of the neurocognitive model is basically the same as the “3P” model, but it emphasizes the concept of cortical arousal.9 Hyperarousal is a comprehensive concept, which believes that insomnia is the result of the interaction between cognitive-behavioral and neurobiological factors.10 Adverse cognition leads to insomnia, and maladaptive behaviors maintain acute insomnia, turning it to a chronic state. Correspondingly, the changes in cortisol and other neurotransmitters after stress events will change the activity of neurons in sleep-related brain regions, and eventually lead to long-term cortical hyperarousal. The abnormal cortisol and elevated high frequencies of electroencephalogram (EEG) power in insomnia patients suggesting the existence of somatic arousal and cortical arousal, indicating that insomnia patients have characteristic sleep markers.11,12 However, these biological markers have not been well characterized in those predisposed for insomnia. Research on this problem may help us to understand the pathogenesis of insomnia.
Sleep reactivity (SR), the degree of sleep disturbance caused by stress exposure, has been used to reflect susceptibility to insomnia.13 The response of the sleep system to stress is affected by multiple factors, including genetic factors, family history, female gender, and environmental stress.14 Thus, differences in SR stem from a person’s innate and heritable diatheses. Individuals with different SRs show different characteristics due to their diverse physical and psychological diatheses in the face of the same stress conditions. For people with low SR (L-SR), their sleep is relatively stable; even if they are hit by stress during the day, their sleep condition may not be disturbed continuously. For people with high SR (H-SR), experiencing stress during the day is more likely to lead to sharp changes in their sleep at night, and prolong the duration of disturbed sleep.15 However, little information is available on the neurobiological basis of H-SR. It is speculated that it may be potentially related to the disruption of cortical network, and the imbalance of the autonomic nervous system and hypothalamus–pituitary–adrenal (HPA) axis.14
Bruno et al demonstrated that emotional impairment secondary to poor sleep quality determines the shift towards maladaptive coping strategies under stress of the COVID19-related lockdown.16 Recently, a prospective study on nurses by Yoo et al found that both H-SR and “stress reactivity” can predict insomnia, and the ability to predict insomnia is stronger when the two are combined.17,18 However, the “stress reactivity” in this study referred to the stress response that occurs under condition of sleep disturbance. The stress reactivity and its interaction with sleep reactivity in H-SR good sleepers (GS) have received little attention before the onset of insomnia. The HPA axis is traditionally a physiological marker of stress and arousal. Cortisol, as the main effector of the HPA axis, can reflect the stress reactivity of individuals.19 At present, the results of the cortisol curves in H-SR GS and insomnia patients are mixed, leading to inconclusive results.20–22 However, hyperactivity of the HPA axis is still considered as an important indicator of insomnia, which has attracted widespread attention.21 Thus, it is interesting to study the cortisol secretion curve after exposure to stress in the individuals with different SRs.
Polysomnography (PSG), a common standard method to evaluate sleep, can display the macro-structure of sleep, and the electroencephalogram (EEG) components of PSG allow for measurement of oscillations on a continuum of sleep–wake states, which is the micro-structure of sleep.23 Most studies used a linear analysis to evaluate the micro-structure, for example, using a spectrum analysis to measure EEG frequency. However, existing studies have shown that brain oscillations are not a linear combination of arbitrary frequency components, but rather have nonlinear characteristics.24 The quantification of nonlinear characteristics of sleep physiology shows a substantial advantage in monitoring the changes in normal sleep physiology with age and pathological conditions.25 Therefore, it is possible to use a nonlinear analysis method to study the sleep microstructure using sleep EEG in H-SR GS.
Entropy is a nonlinear analysis method that can be used to evaluate the repeatability of EEG waveforms; that is, it can describe the complexity of EEG signals. The more complex the EEG signals are, the greater the entropy will be. The characteristics of entropy responses vary in different stages of the sleep–wake state. Due to the high complexity of EEG signals, the entropy value of EEG signals during wakefulness and rapid eye movement (REM) sleep are significantly higher than that during non-REM (NREM) sleep,26,27 implying that the increased value of entropy represents the disorder of orderliness.28 Therefore, individuals with poor sleep quality should have higher values of EEG entropy than GS. Some indicators of sleep structure based on entropy are positively correlated with the arousal index, total sleep time (TST), and sleep efficiency (SE), and have advantages over these indexes in capturing additional sleep time patterns.29 Abnormal plasticity of intrinsic function, as indicated by entropy, is significantly linked to the insomniac severity in patients with insomnia.30 Compared with L-SR GS, H-SR GS are more likely to have difficulty in falling asleep and increased number of arousals (NA),31 which is similar to the high arousal state in insomnia patients. Thus, H-SR GS may have a more activated brain state and disordered sleep orderliness at night, especially after stress. However, changes in the values of entropy, which represent sleep orderliness, have not been reported in H-SR GS after stress.
The Trier Social Stress Test (TSST) is a reliable bio-psychological tool used to detect the effects of acute stress on human psychological and physiological functions.32 It is suitable for healthy people and has been used in many studies since the early 1990s.32 Compared with some exogenous stressors, the TSST can induce endogenous stress responses and reliably increase the activation of the HPA axis;33,34 therefore, the TSST is robust and credible.
In the present study, we hypothesized that stress exposure may affect the macro-structure and orderliness of sleep, and salivary cortisol levels in H-SR GS, which may be related to the interaction between stress and H-SR. We used the TSST as a stressor and monitored changes in salivary cortisol levels in the GS as well as their sleep during the night after stress in an attempt to investigate the changes and links of the macro-structure and orderliness of sleep and cortisol levels in healthy young adults under SR and stress effects.
Materials and Methods
Participants
In this study, 64 healthy volunteers were recruited (most were graduate students). Participants were randomly divided into two groups, a stress group (n = 32) and a control group (n = 32). The healthy volunteers who participated in the experiment were recruited via social media platforms. The inclusion criteria were as follows: (1) aged between 18 and 40 years; (2) satisfaction with their own sleep and reported normal sleep for at least 1 year, with a Pittsburgh Sleep Quality Index (PSQI) < 7;35 (3) good physical and psychological health; and (4) good sleep habits. The exclusion criteria were as follows: (1) cardiovascular disease, liver or kidney disease, endocrine disease, nervous system disease, mental disease, or sleep disorders; (2) night-shift workers or those with abnormal schedules; (3) pregnancy or lactation; (4) infectious or inflammatory diseases in the prior 2 weeks; and (5) a history of smoking or alcohol abuse. According to the exclusion criteria, two volunteers in the control group were excluded because of obstructive sleep apnea syndrome, and a total of 62 volunteers finally participated in the experiment.
Experimental Flow
Before the experiment, professionals collected the general data of all participants (including age, sex, and body mass index [BMI]) and had a conversation with them to understand the sleep and emotional status of each participant in the past year and complete all scales. The experiment was divided into two nights: the first night of PSG was used to help participants adapt to the laboratory environment to exclude first-night effects. Participants were asked to keep a regular sleep schedule for 1 week prior to the experiment and to not use alcohol, caffeine, tobacco, and other sleep-affecting substances within 24 h before the experiment. Participants arrived at the laboratory 2 h before their habitual sleep time. All participants in the stress group completed the TSST test in the second night before PSG evaluation.
Sleep Reactivity Assessment
Assessment of SR was completed using the Ford Stress Insomnia Response Test (FIRST),36 consisting of nine questions. Participants self-assessed the possibility of sleep difficulties after experiencing nine common stress situations. The scale is divided into four scores (1–4 points), ranging from none to severe. The higher the score, the higher the SR. Referring to previous studies, we used a score of 16 as the criterion to distinguish between susceptible and non-susceptible participants.37
Assessment of Emotional State
Depression
The 17-item Hamilton Depression Rating Scale (HAMD-17) was used to evaluate the degree of depression of the participants. The total score of HAMD-17 ranges from 0 to 52. The higher the score, the more severe the depressive symptoms. HAMD-17 < 7 indicates that the participants have no depressive symptoms.38
Anxiety
The 14-item Hamilton Anxiety Scale (HAMA-14) were used to evaluate the degree of anxiety of the participants. The total score of HAMA-14 ranges from 0 to 56. Higher scores reflect greater anxiety. HAMA-14 < 7 indicates that the participants have no anxiety symptoms.39
Assessment of Sleep
Subjective Sleep
The PSQI was used to evaluate sleep quality in the participants over the prior month. The 19 items comprising in the score included sleep quality, sleep latency (SL), sleep duration, habitual SE, sleep disturbances, use of sleep medication, and daytime dysfunction over the prior month. Each component is scored on a scale of 0–3, and the cumulative score of the components is the total PSQI score, ranging from 0 to 21. The higher the score, the worse the sleep quality. In China, PSQI < 7 indicates good sleep quality.35
Objective Sleep
All participants completed PSG (Grael, Condi, Australia) during their habitual bedtimes. The next day, the same professionally trained staff uploaded the data to the computer and composed sleep reports according to the standard of the American Academy of Sleep Medicine Manual for the Scoring of Sleep and Associated Events (version 2.4) frame by frame (30 s/frames). We monitored the TST; the total duration of wakefulness after sleep onset (WASO); SE; SL; REM sleep latency (REM-L); duration of REM sleep and NREM sleep stages 1, 2, and 3 (N1, N2, and N3), and their relative percentages of the TST; and REM density (the number of rapid eye movements divided by the REM sleep duration40). Wakefulness is the time window between the start of EEG recording and sleep onset.
Approximate entropy (ApEn) was used to assess the irregularity of the time sequence data. Sample entropy (SampEn) was used as an improvement on ApEn, which was designed to reduce the error of ApEn, so that it was more accurate. Fuzzy entropy (FuzzEn) further improves the limitations of SampEn and retains the consistency of SampEn with a reduced data processing time. Multiscale entropy (MSE) analysis was based on SampEn to quantify the entropy over different time scales. These four entropies have similar physical meanings.24,26 This study was performed on C3-M2 signaling. The calculation formula can be found in these references.26,41
Stress Assay
The TSST was used as a stressor (the process is shown in Figure 1). It mainly includes three aspects: cortisol measurement, a 5-min speech task, and a 5-min surprise mental arithmetic task. After arriving in the laboratory, the participants rested in room 1 and gargled glucose solution. After 20 min, the participants were brought into room 2. The staff introduced the task to the participants and gave them 5 min to prepare. Then, the participants performed the speech task in front of three staff members for 5 min. A 5-min mental arithmetic task was performed immediately after the speech task was over. The participants were asked to count down from 1022 in intervals of 13. A quick and accurate completion of this task was required. They were asked to restart from the beginning if they committed any errors. After the experiment, the staff took the participants back to room 1, explained the purpose of the experiment to them, and give the participants a 35-min period for recovery. During the experiment, we collected saliva specimens at the following time points: −20 min, +1 min, +15 min, +30 min (“−20 min” means 20 min before the end of the TSST, “+1 min” means 1 min after the end of the TSST).42
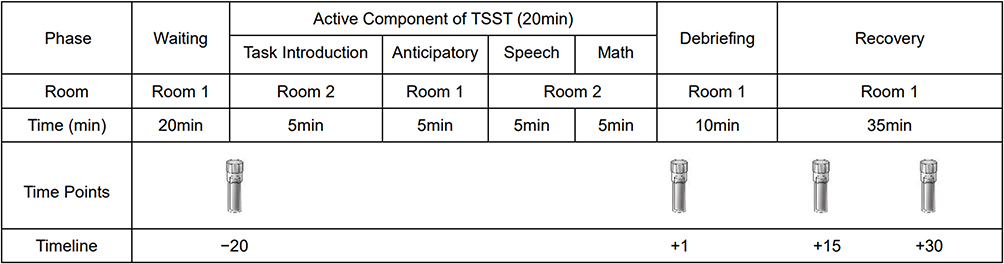 |
Figure 1 The operation process of the Trier Social Stress Test. |
Salivary Cortisol Measurement
All participants in the stress group were instructed to not eat and drink (except water), perform strenuous exercise, or use dental floss or brush their teeth within 1 h before the start of the experiment. Women were asked to avoid the usage of any contraceptives and were tested during the same period in the menstrual cycle. Saliva specimens were collected at time points using a saliva collection device (Salivettes®; Sarstedt, Nümbrecht, Germany) following the TSST. Specimens were stored at −20 °C until testing. Before analysis, specimens were thawed and centrifuged at 1000 × g for 5 min. Cortisol levels were determined according to the manufacturer’s instructions (ELISA®; ALPCO Diagnostics, Salem, NH, USA) using an enzyme-linked immunosorbent assay.
Statistical Analysis
SPSS software (v21.0; IBM Corp., Armonk, NY, USA) was used to analyze the data. All data were screened for outliers and missing values before statistical analysis and tested for normality and homogeneity of variance. The data that followed a normal or an approximately normal distribution are expressed by mean ± standard deviation, and those that did not follow a normal distribution are expressed in quartiles [P50 (P25, P75)]. Differences between background data were assessed using the chi-squared test, one-way analysis of variance (ANOVA), and the Kruskal–Wallis H-test. Differences between objective sleep parameters and entropy values were compared using a two-way ANOVA and the Scheirer–Ray–Hare test. A two-way repeated measures of analysis of covariance (ANCOVA) was used to analyze salivary cortisol levels. The t-test was used to analyze differences in cortisol levels at each time points between the H-SR and L-SR groups after stress.
Results
Background Data
Participant background information is shown in Table 1. There were no significant differences in sex, age, BMI, or PSQI among the four groups (P > 0.05). There were significant differences in the FIRST scores among the groups [H (3,62) = 46.081, P < 0.001]; FIRST scores were significantly higher in the H-SR stress group than in the L-SR stress group [H (1,32) = 4.567, P < 0.001], and FIRST scores in the H-SR control group was significantly higher than in the L-SR control group [H (1,30) = 5.022, P < 0.001].
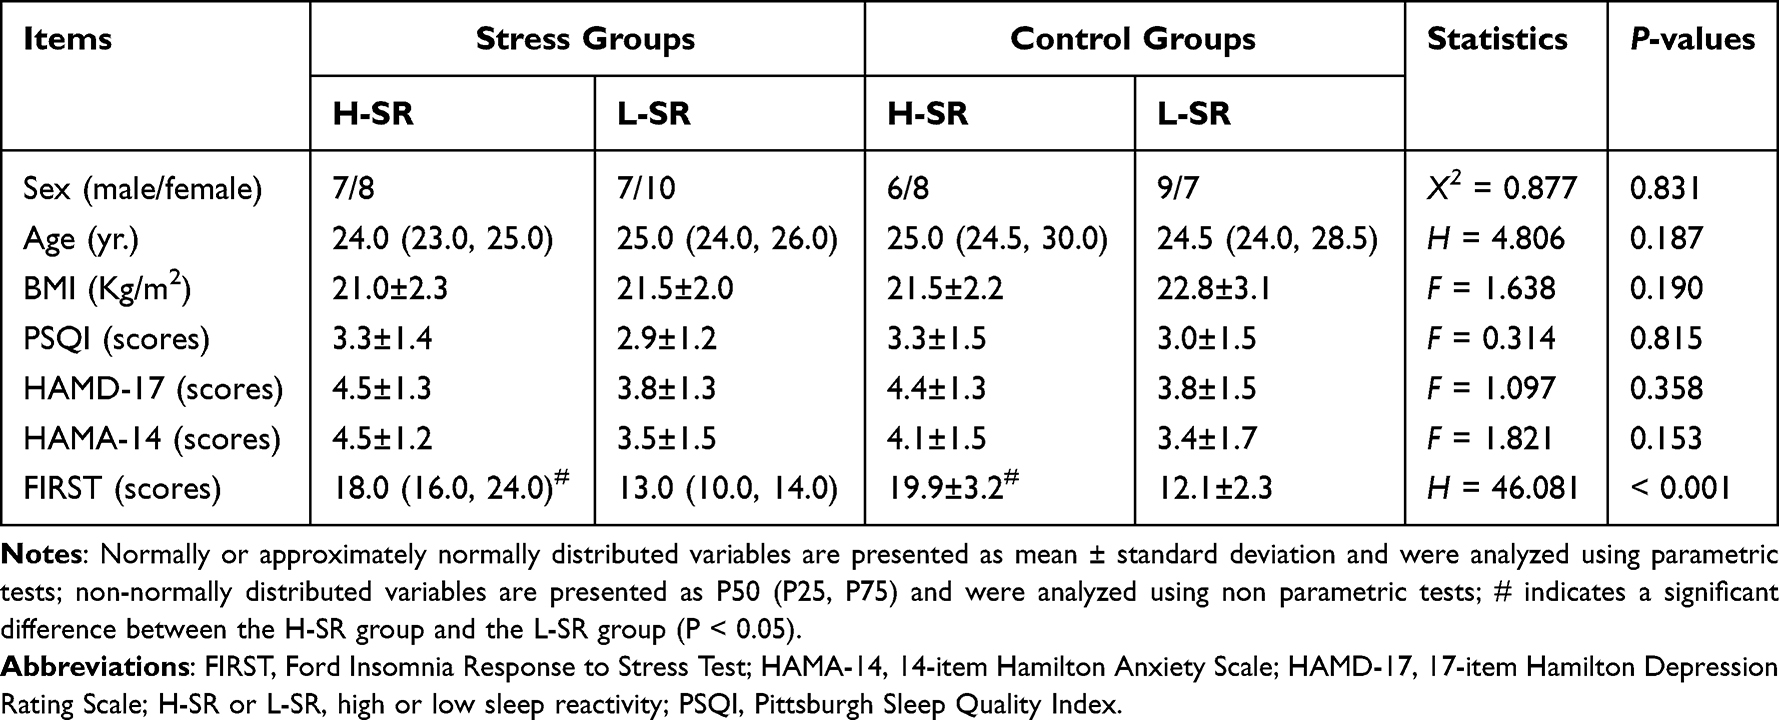 |
Table 1 Background Data of All Participants |
Objective Sleep Parameters
Stress Effect
There were significant stress effects on the TST [F (1,62) = 14.130, P < 0.001], SL [H (1,62) = 6.000, P = 0.014], N1 [F (1,62) = 4.344, P = 0.042], N2 [H (1,62) = 6.915, P = 0.009], REM-L [H (1,60) = 4.011, P = 0.045], REM% [F (1,60) = 4.362, P = 0.041], and REM density [F (1,58) = 8.155, P = 0.006]. Compared with the non-stressed group, stressed participants showed significantly lower TST, N1, N2, and REM%, and increased SL, REM-L, and REM density.
SR Effect
There were significant SR effects on the TST [F (1,62) = 18.383, P < 0.001], WASO [H (1,62) = 22.523, P < 0.001], SL [H (1,62) = 4.760, P = 0.029], SE [H (1,62) = 22.805, P < 0.001], N1% [F (1,62) = 9.709, P = 0.003], N2 [H (1,62) = 9.116, P = 0.003], REM-L [H (1,60) = 4.854, P = 0.028], and REM% [F (1,60) = 4.566, P = 0.037]. Compared with participants with L-SR, those with H-SR had significantly lower TST, N2, and REM%, and increased WASO, N1%, SL, and REM-L, as well as poorer SE.
A significant interaction of stress × SR on REM was observed [F (1,60) = 4.811, P = 0.032]. A further simple effect analysis showed that REM was significantly lower after stress in participants with H-SR, while there was no significant change in REM after stress in participants with L-SR. In the unstressed conditions, there were no significant difference in REM between H-SR and L-SR groups; however, REM was significantly shorter in participants with H-SR than in those with L-SR after stress (Table 2 and Figure 2).
 |
Table 2 The Effects of Stress and Sleep Reactivity on Objective Sleep Parameters |
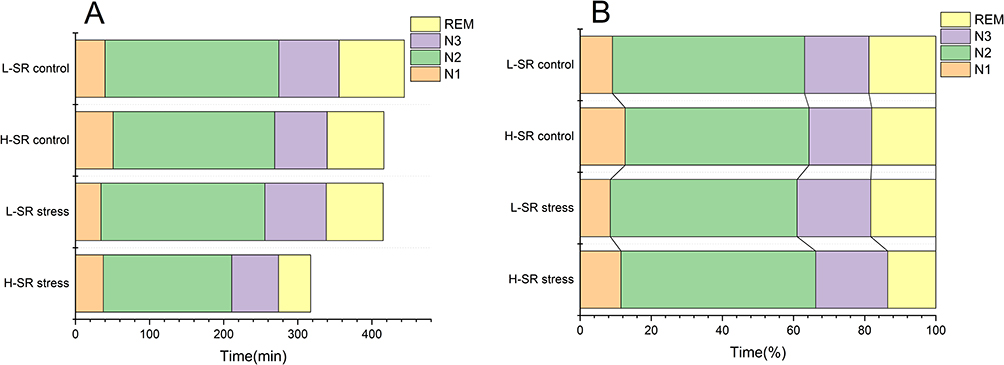 |
Figure 2 Sleep structure of the four groups; (A) time and (B) percentage. Abbreviations: H-SR or L-SR, high or low sleep reactivity; N1–3, non-rapid eye movement sleep stage 1–3; REM, rapid eye movement sleep. |
Entropy Values
Stress Effect
There were significant stress effects on the ApEn [F (1,62) = 6.733, P = 0.012], SampEn [F (1,62) = 5.338, P = 0.024], FuzzEn [H (1,62) = 4.447, P = 0.035], and MSE [F (1,54) = 8.834, P = 0.005] during wakefulness; ApEn [F (1,62) = 5.805, P = 0.019], SampEn [F (1,62) = 6.148, P = 0.016], FuzzEn [H (1,62) = 4.805, P = 0.028], and MSE [F (1,54) = 11.929, P = 0.001] during N1 sleep; and MSE [H (1,54) = 3.901, P = 0.048] during N2 sleep. Compared with the non-stressed participants, stressed participants showed an increase in these entropy values.
SR Effect
There were significant SR effects on the ApEn [F (1,62) = 15.993, P < 0.001], SampEn [F (1,62) = 7.981, P = 0.006], FuzzEn [H (1,62) = 3.913, P = 0.048], and MSE [F (1,54) = 13.797, P < 0.001] during wakefulness; ApEn [F (1,62) = 4.276, P = 0.043] and MSE [F (1,54) = 6.822, P = 0.012] during N1 sleep; and ApEn [F (1,62) = 4.222, P = 0.044], SampEn [H (1,62) = 4.728, P = 0.030], FuzzEn [H (1,62) = 4.061, P = 0.044], and MSE [H (1,54) = 9.830, P = 0.002] during N2 sleep. Compared to participants with L-SR, those with H-SR showed an increase in these entropy values (Table 3).
 |
Table 3 The Effects of Stress and Sleep Reactivity on EEG Entropy |
Salivary Cortisol Levels in the Stressed Group
The statistical comparisons of the participants’ salivary cortisol levels at the four time points are shown in Figure 3. Two-way repeated measures of ANCOVA with sex and age as covariates suggested a significant main effect of time [F (1,31) = 4.480, P < 0.05]. The differences between the groups were statistically significant (P < 0.05). For the H-SR group, the salivary cortisol levels at “+15” and “+30” were significantly higher than those at “−20”; however, those at “+1” were not. For the L-SR group, the salivary cortisol levels at “+15” were significantly higher than those at “−20”, and those at “+1” and “+30” were not. Salivary cortisol levels in both groups peaked at “+15” and were higher than at “+30”. There was no difference in cortisol levels between the two groups at “−20” and “+1”, and cortisol levels in the H-SR group were significantly higher than those in the L-SR group at “+15” and “+30” (Table 4).
 |
Table 4 Differences in Cortisol Levels at Each Time Points Between the H-SR and L-SR Groups |
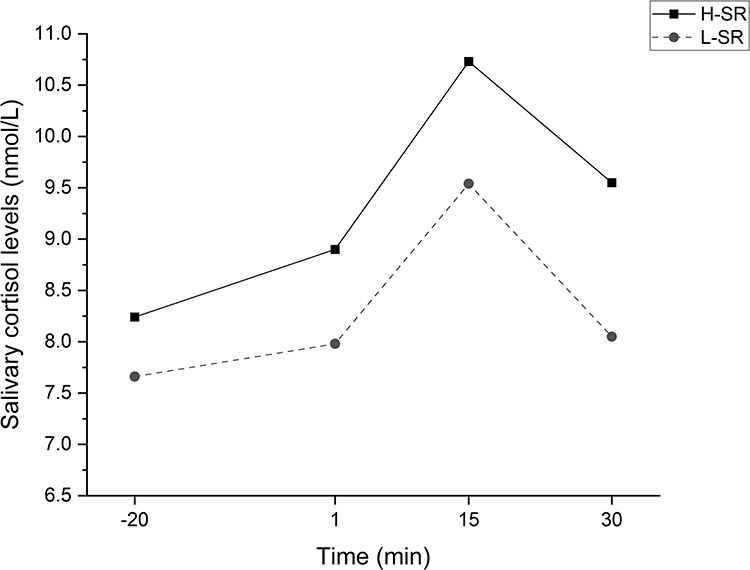 |
Figure 3 Changes in salivary cortisol levels at four time points during the Trier Social Stress Test. Abbreviation: H-SR or L-SR, high or low sleep reactivity. Notes: Statistical analysis was performed using Two-way repeated measures of ANCOVA; The four time points are −20 min, 1 min, 15 min, and 30 min relative to the end of the test. |
Discussion
The present study confirmed that there are differences in sleep among healthy people with different SR. The participants with H-SR were more likely to have decreased N1 and N2, fragmented REM, reduced sleep orderliness, and a stronger cortisol response after acute stress.
Changes in Objective Sleep in GS Under Stress and SR Effects
Previous studies have shown that increased stress in daily life can lead to a prolongation of SL, an increase of WASO, and a decrease of SE.43 Healthy people with H-SR were more likely to show these phenomena under more stress and had an increased risk of acute insomnia.44 Moreover, studies have found that stress can significantly shorten REM in GS with H-SR and tended to shorten N1 and N2.45 In the present study (Table 2), the shortening of TST in GS with H-SR after stress was mainly caused by a decrease in N1, N2, and REM, but it was not related to N3. However, N1% had increased with unchanged in N2%. We speculate that the reason for this result may be related to the lack of sleep stability in the H-SR people. Sleep instability causes frequent night awakenings, leading to continuous interruption of sleep and usually company repeated onset of sleep from the beginning. These results suggested that shallow sleep and REM are more likely to be affected, while deep sleep is relatively stable These results were consistent with previous studies.43–45
What is most interesting to us is the shortening of REM, which has many unfavorable effects. First, poor REM causes subjectively poor sleep, resulting in complaints and concerns about sleep.46 Second, REM, as a very important sleep stage, can regulate negative emotions,47 transform and integrate daytime memories,48,49 and consolidate learning outcomes during the day.50 Changes in REM can cause mood swings, weaken the stability of memory, and affect learning efficiency. For the present sample, which consisted of young people, those with H-SR were more likely to have shortened REM sleep duration and were more susceptible to these adverse consequences after stress.
REM density refers to the frequency of eye movements during REM, which is an indicator of sleep quality.51 REM density increases when sleep time is too long, and the arousal threshold decreases. When entering deep sleep, the REM density is also reduced. Hence, REM density may be related to the level of arousal.52 In the present study, the REM density of healthy people increased significantly after stress (Table 2). This suggests that REM sleep in GS may be more likely to be interrupted, and that they were more susceptible awakening in the night after stress.
The present results (decreases in REM sleep duration and increases in REM density) indicated that GS with H-SR usually experience REM fragmentation after stress, which is an important feature of chronic insomnia.53 In other words, because GS with H-SR have a constitutional predisposition to insomnia, the additive effects of stressful events will greatly increase the incidence of insomnia.54 One reason for REM fragmentation in GS with H-SR may be the increase of cortisol levels before bedtime. Another possible explanation for this is that REM fragmentation is associated with emotional impairment. Bruno et al have pointed out that this impairment may lead to maladaptive coping strategies, making acute insomnia become chronic.16 However, their participants received long-term chronic stress of the COVID19-related lockdown, while in our study, we used one-time acute stress. So further research is needed to prove this view. For patients with chronic insomnia, it was found that those with H-SR usually showed lower resilience, and their ability to overcome stress was also relatively weak, which might also have a negative impact on the regulation of mood and arousal. It may be possible to prevent the onset of stress-induced insomnia with interventions, such as meditation and exercise, among others, to help those with a high-risk for insomnia to enhance their stress resilience.55–57
Changes in Sleep Orderliness in GS Under Stress and SR Effects
As an indicator of EEG complexity, entropy can be used to quantify levels of awareness and consciousness, especially regarding differences between normal waking consciousness and states of reduced consciousness. As a result, when consciousness is weakened, EEG complexity decreases.58 Entropy can also help to evaluate the repeatability of EEG waveforms, such that it could reflect the orderliness and regularity of EEG waveforms during sleep. When the dimensional values of entropy increase, the orderliness of EEG decreases, and the waveforms become more irregular.58 Although entropy is an important measure in the study of EEG signals, there are few studies in the field of somnology at present. The current results (Table 3) showed that healthy people had increased ApEn, SampEn, FuzzEn, and MSE during wakefulness; ApEn and MSE during N1; and MSE during N2 in both conditions of stress and H-SR. Increases in SampEn and FuzzEn during N1 only occurred under stress, and increases in FuzzEn during N2 only occurred in participants with H-SR. It has been suggested that the GS with H-SR show disrupted sleep orderliness and regularity, more complex brain activity, and more hyper-excitability before falling asleep after stress. The increase of entropy during wakefulness and sleep after stress may be due to the higher level of pre-sleep cortisol and slower recovery in the H-SR people, leaving the brain in a state of high arousal. The increase of SL under stress and H-SR effects also support this point. However, these changes may be reversible. It has been shown that after superficial acupuncture treatment for patients with primary insomnia, the value of ApEn was lowered relative to in the resting state.59 In another study, the MSE value decreased in people with insomnia symptoms during wakefulness and stage 1 of NREM sleep after experiencing beat frequency vibrations.60
Interestingly, in the current study, we found that N3 may be more stable than other sleep stages. Similar to the PSG parameters of the N3 stage, the dimensional values of entropy during N3 did not change significantly (Table 2 and Table 3). This indicated that, in GS with H-SR, N1, N2, and REM sleep are the first to be affected after stress, and stressful events in daily life, as brought about by the TSST, do not affect deep sleep. However, in our related clinical works, we found that patients with chronic insomnia disorder often show shortened stage N3, and some patients even show no N3 stage during sleep.61 These findings may suggest a natural trajectory of insomnia development in healthy individuals, that is, N1, N2, and REM sleep are the components disrupted first in prodromal period of insomnia disorder, and N3 may be conserved until the later stage of illness process.
Cortisol Responses in GS with H-SR After Stress
Activation of the HPA axis is an important indicator explaining the hyperarousal hypothesis of insomnia. Cortisol, as the main product of the HPA axis, has attracted considerable attention. Therefore, the cortisol response curves in healthy young people under stress can help us to understand the pathophysiological changes in patients with prodromal insomnia.
The present results showed that there was no difference in baseline cortisol levels between H-SR and L-SR before stress. GS with H-SR showed stronger salivary cortisol responses than those with L-SR after experiencing the same stress. Furthermore, even after the same recovery time, salivary cortisol levels in the GS with H-SR did not return to baseline levels as quickly as those in the GS with L-SR (Figure 3). This further suggested that people with different SR may have different stress reactivity. For GS with H-SR, the resilience of their stress system may be less than that of GS with L-SR. Therefore, before the H-SR GS develop into insomnia patients, there may express dysregulation of the stress system. Although our study showed such results, the literature on the response of salivary cortisol under stressor exposure in H-SR GS and insomnia patients are mixed, due to the different subtypes of insomnia and stressors. Vgontzas et al hypothesized that hyperactivity of the HPA axis mainly exists in the insomnia subtypes who have objective short sleep duration. This hypothesis is consistent with the relevant evidence, that is, the high level of 24-h urinary cortisol is related to the increase in total wake time in patients with chronic insomnia. Patients with insomnia whose objective sleep duration is less than 5 h have higher levels of cortisol in the morning than those who sleep more than 5 h.21 In a study by Chen et al, it was found that the cortisol response in H-SR GS tended to increase compared with L-SR GS after stress.20 However, in the study of Reffi et al, it was believed that cortisol response was passivated in people with a higher risk of insomnia.22 In fact, this situation may be caused by over-activation of the HPA axis under the action of long-term stress experiences, a state existing in people with chronic insomnia disorder, resulting in allostatic overload and blunted stressor reactivity.62–64 In our study, the towering cortisol response curve of the H-SR GS may be because the participants are younger and have not experienced long-term sleep disorders and stress. Moreover, the personality characteristics of H-SR GS may be the key mediating factors. A more “neurotic” personality magnifies the emotions they perceive in the face of stress events, which causes emotional arousal. This leads to physiological activation and makes their stress reactivity stronger.21,54,65
Limitations
The primary limitation of the present study is the sample size; it was small, and we did not conduct a follow-up of the participants to determine whether their sleep returned to normal after undergoing stress. This was due to complications from the COVID-19 pandemic. It is also impossible to know the likelihood and severity of insomnia in people with different SR in the future. Second, most of the participants in the present study were graduate students who have received a long-term good education and were relatively young in age, thus, our results cannot easily be generalized to other populations. Finally, the exploration of the neurobiological mechanisms of insomnia was limited in the present study. These should be improved upon in later studies.
Conclusion
In the present study, we found that under both the stress effect and the SR effect, the duration of shallow sleep was shortened in GS, and entropy values during wakefulness and shallow sleep increased. In particular, REM sleep was fragmented under the interaction of the two effects. However, WASO, SL, and SE were only affected by the SR effect. Under mild-to-moderate stress, cortisol responses were stronger in participants with H-SR compared to those with L-SR. Stress and H-SR play driving roles in the development of insomnia.
Data Sharing Statement
Due to ethical restrictions related to protecting patient privacy, data cannot be made publicly available.
Ethics Approval and Informed Consent
All participants signed provided written informed consent and received appropriate subsidies. This study was approved by the Clinical Trial Ethics Committee of the Affiliated Chaohu Hospital of Anhui Medical University (KYXM-202108-005). This study complies with the Declaration of Helsinki.
Acknowledgments
The authors thank the volunteers who participated in this study.
Disclosure
The authors report no conflicts of interest in this work.
References
1. Sutton EL. Insomnia. Ann Intern Med. 2021;174(3):ITC33–ITC48. doi:10.7326/AITC202103160
2. Aernout E, Benradia I, Hazo JB, et al. International study of the prevalence and factors associated with insomnia in the general population. Sleep Med. 2021;82:186–192. doi:10.1016/j.sleep.2021.03.028
3. Chowdhury AI, Ghosh S, Hasan MF, Khandakar KAS, Azad F. Prevalence of insomnia among university students in South Asian Region: a systematic review of studies. J Prev Med Hyg. 2021;61(4):E525–E529. doi:10.15167/2421-4248/jpmh2020.61.4.1634
4. Perez MN, Salas RME. Insomnia. Continuum. 2020;26(4):1003–1015. doi:10.1212/CON.0000000000000879
5. Khan MS, Aouad R. The Effects of insomnia and sleep loss on cardiovascular disease. Sleep Med Clin. 2022;17(2):193–203. doi:10.1016/j.jsmc.2022.02.008
6. Blackwelder A, Hoskins M, Huber L. Effect of inadequate sleep on frequent mental distress. Prev Chronic Dis. 2021;18:E61. doi:10.5888/pcd18.200573
7. Chen JT, Zhang P, Kong XY, et al. Changed serum levels of CD62E+, angiotensin II and copeptin in patients with chronic insomnia disorder: a link between insomnia and stroke? Sleep Med. 2022;91:96–104. doi:10.1016/j.sleep.2022.02.017
8. Spielman AJ, Caruso LS, Glovinsky PB. A behavioral perspective on insomnia treatment. Psychiatr Clin North Am. 1987;10(4):541–553. doi:10.1016/S0193-953X(18)30532-X
9. Perlis ML, Giles DE, Mendelson WB, Bootzin RR, Wyatt JK. Psychophysiological insomnia: the behavioural model and a neurocognitive perspective. J Sleep Res. 1997;6(3):179–188. doi:10.1046/j.1365-2869.1997.00045.x
10. Perlis ML, Ellis JG, Kloss JD, Riemann DW. Etiology and pathophysiology of insomnia. In: Kryger MH, Roth T, Dement WC, editors. Principles and Practice of Sleep Medicine.
11. Perlis ML, Merica H, Smith MT, Giles DE. Beta EEG activity and insomnia. Sleep Med Rev. 2001;5(5):363–374. doi:10.1053/smrv.2001.0151
12. van Dalfsen JH, Markus CR. The influence of sleep on human hypothalamic-pituitary-adrenal (HPA) axis reactivity: a systematic review. Sleep Med Rev. 2018;39:187–194. doi:10.1016/j.smrv.2017.10.002
13. Drake CL, Pillai V, Roth T. Stress and sleep reactivity: a prospective investigation of the stress-diathesis model of insomnia. Sleep. 2014;37(8):1295–1304. doi:10.5665/sleep.3916
14. Kalmbach DA, Anderson JR, Drake CL. The impact of stress on sleep: pathogenic sleep reactivity as a vulnerability to insomnia and circadian disorders. J Sleep Res. 2018;27(6):e12710. doi:10.1111/jsr.12710
15. Jarrin DC, Chen IY, Ivers H, Morin CM. The role of vulnerability in stress-related insomnia, social support and coping styles on incidence and persistence of insomnia. J Sleep Res. 2014;23(6):681–688. doi:10.1111/jsr.12172
16. Bruno S, Bazzani A, Marantonio S, et al. Poor sleep quality and unhealthy lifestyle during the lockdown: an Italian study. Sleep Med. 2022;90:53–64. doi:10.1016/j.sleep.2022.01.002
17. Kalmbach DA, Fernandez-Mendoza J, Drake CL. Stress and sleep reactivity increase risk for insomnia: highlighting the dynamic interplay between sleep-wake regulation and stress responsivity. Sleep. 2023;46(2):zsac302. doi:10.1093/sleep/zsac302
18. Yoo J, Slavish D, Dietch JR, Kelly K, Ruggero C, Taylor DJ. Daily reactivity to stress and sleep disturbances: unique risk factors for insomnia. Sleep. 2023;46(2):zsac256. doi:10.1093/sleep/zsac256
19. Nicolaides NC, Vgontzas AN, Kritikou I, et al. HPA Axis and Sleep. In: Feingold KR, Anawalt B, Blackman MR, editors. Endotext. South Dartmouth (MA): MDText.com, Inc.; 2020.
20. Chen IY, Jarrin DC, Ivers H, Morin CM. Investigating psychological and physiological responses to the trier social stress test in young adults with insomnia. Sleep Med. 2017;40:11–22. doi:10.1016/j.sleep.2017.09.011
21. Dressle RJ, Feige B, Spiegelhalder K, et al. HPA axis activity in patients with chronic insomnia: a systematic review and meta-analysis of case-control studies. Sleep Med Rev. 2022;62:101588. doi:10.1016/j.smrv.2022.101588
22. Reffi AN, Cheng P, Kalmbach DA, et al. Is a blunted cortisol response to stress a premorbid risk for insomnia? Psychoneuroendocrinology. 2022;144:105873. doi:10.1016/j.psyneuen.2022.105873
23. Cudney LE, Frey BN, McCabe RE, Green SM. Investigating the relationship between objective measures of sleep and self-report sleep quality in healthy adults: a review. J Clin Sleep Med. 2022;18(3):927–936. doi:10.5664/jcsm.9708
24. Ma Y, Shi W, Peng CK, Yang AC. Nonlinear dynamical analysis of sleep electroencephalography using fractal and entropy approaches. Sleep Med Rev. 2018;37:85–93. doi:10.1016/j.smrv.2017.01.003
25. Stam CJ. Nonlinear dynamical analysis of EEG and MEG: review of an emerging field. Clin Neurophysiol. 2005;116(10):2266–2301. doi:10.1016/j.clinph.2005.06.011
26. Zhao D, Wang Y, Wang Q, Wang X. Comparative analysis of different characteristics of automatic sleep stages. Comput Method Program Biomed. 2019;175:53–72. doi:10.1016/j.cmpb.2019.04.004
27. Li H, Peng C, Ye D. A study of sleep staging based on a sample entropy analysis of electroencephalogram. Biomed Mater Eng. 2015;26(Suppl 1):S1149–S1156. doi:10.3233/BME-151411
28. Richman JS, Moorman JR. Physiological time-series analysis using approximate entropy and sample entropy. Am J Physiol Heart Circ Physiol. 2000;278(6):H2039–H2049. doi:10.1152/ajpheart.2000.278.6.H2039
29. Kirsch MR, Monahan K, Weng J, Redline S, Loparo KA. Entropy-based measures for quantifying sleep-stage transition dynamics: relationship to sleep fragmentation and daytime sleepiness. IEEE Trans Biomed Eng. 2012;59(3):787–796. doi:10.1109/TBME.2011.2179032
30. Zhou F, Huang S, Gao L, Zhuang Y, Ding S, Gong H. Temporal regularity of intrinsic cerebral activity in patients with chronic primary insomnia: a brain entropy study using resting-state fMRI. Brain Behav. 2016;6(10):e00529. doi:10.1002/brb3.529
31. Bonnet MH, Arand DL. Situational insomnia: consistency, predictors, and outcomes. Sleep. 2003;26(8):1029–1036. doi:10.1093/sleep/26.8.1029
32. Vors O, Marqueste T, Mascret N, Nater UM. The trier social stress test and the trier social stress test for groups: qualitative investigations. PLoS One. 2018;13(4):e0195722. doi:10.1371/journal.pone.0195722
33. Goodman WK, Janson J, Wolf JM. Meta-analytical assessment of the effects of protocol variations on cortisol responses to the Trier Social Stress Test. Psychoneuroendocrinology. 2017;80:26–35. doi:10.1016/j.psyneuen.2017.02.030
34. Allen AP, Kennedy PJ, Cryan JF, Dinan TG, Clarke G. Biological and psychological markers of stress in humans: focus on the Trier Social Stress Test. Neurosci Biobehav Rev. 2014;38:94–124. doi:10.1016/j.neubiorev.2013.11.005
35. Tsai PS, Wang SY, Wang MY, et al. Psychometric evaluation of the Chinese version of the Pittsburgh Sleep Quality Index (CPSQI) in primary insomnia and control subjects. Qual Life Res. 2005;14(8):1943–1952. doi:10.1007/s11136-005-4346-x
36. Dieck A, Helbig S, Drake CL, Backhaus J. Validation of the German version of the ford insomnia response to stress test. J Sleep Res. 2018;27(3):e12621. doi:10.1111/jsr.12621
37. Kalmbach DA, Pillai V, Arnedt JT, Drake CL. Identifying at-risk individuals for insomnia using the ford insomnia response to stress test. Sleep. 2016;39(2):449–456. doi:10.5665/sleep.5462
38. Hamilton M. A rating scale for depression. J Neurol Neurosurg Psychiatry. 1960;23(1):56–62. doi:10.1136/jnnp.23.1.56
39. Maier W, Buller R, Philipp M, Heuser I. The Hamilton anxiety scale: reliability, validity and sensitivity to change in anxiety and depressive disorders. J Affect Disord. 1988;14(1):61–68. doi:10.1016/0165-0327(88)90072-9
40. Bottary R, Seo J, Daffre C, et al. Fear extinction memory is negatively associated with REM sleep in insomnia disorder. Sleep. 2020;43(7):zsaa007. doi:10.1093/sleep/zsaa007
41. Zhang XD. Entropy for the complexity of physiological signal dynamics. Adv Exp Med Biol. 2017;1028:39–53.
42. Labuschagne I, Grace C, Rendell P, Terrett G, Heinrichs M. An introductory guide to conducting the Trier Social Stress Test. Neurosci Biobehav Rev. 2019;107:686–695. doi:10.1016/j.neubiorev.2019.09.032
43. Metlaine A, Sauvet F, Gomez-Merino D, et al. Sleep and biological parameters in professional burnout: a psychophysiological characterization. PLoS One. 2018;13(1):e0190607. doi:10.1371/journal.pone.0190607
44. Walker JL, Vargas I, Drake CL, Ellis JG, Muench A, Perlis ML. The natural history of insomnia: high sleep reactivity interacts with greater life stress to predict the onset of acute insomnia. Sleep. 2022;45(9):zsac149. doi:10.1093/sleep/zsac149
45. Petersen H, Kecklund G, D’Onofrio P, Nilsson J, Åkerstedt T. Stress vulnerability and the effects of moderate daily stress on sleep polysomnography and subjective sleepiness. J Sleep Res. 2013;22(1):50–57. doi:10.1111/j.1365-2869.2012.01034.x
46. Pérusse AD, Pedneault-Drolet M, Rancourt C, Turcotte I, St-Jean G, Bastien CH. REM sleep as a potential indicator of hyperarousal in psychophysiological and paradoxical insomnia sufferers. Int J Psychophysiol. 2015;95(3):372–378. doi:10.1016/j.ijpsycho.2015.01.005
47. Wassing R, Lakbila-Kamal O, Ramautar JR, Stoffers D, Schalkwijk F, Van Someren EJW. Restless REM sleep impedes overnight amygdala adaptation. Curr Biol. 2019;29(14):2351–2358.e4. doi:10.1016/j.cub.2019.06.034
48. Boyce R, Glasgow SD, Williams S, Adamantidis A. Causal evidence for the role of REM sleep theta rhythm in contextual memory consolidation. Science. 2016;352(6287):812–816. doi:10.1126/science.aad5252
49. Werner GG, Schabus M, Blechert J, Wilhelm FH. Differential effects of REM sleep on emotional processing: initial evidence for increased short-term emotional responses and reduced long-term intrusive memories. Behav Sleep Med. 2021;19(1):83–98. doi:10.1080/15402002.2020.1713134
50. Tamaki M, Wang Z, Barnes-Diana T, et al. Complementary contributions of non-REM and REM sleep to visual learning. Nat Neurosci. 2020;23(9):1150–1156. doi:10.1038/s41593-020-0666-y
51. Barbato G. REM sleep: an unknown indicator of sleep quality. Int J Environ Res Public Health. 2021;18(24):12976. doi:10.3390/ijerph182412976
52. Feinberg I, Floyd TC, March JD. Effects of sleep loss on delta (0.3-3 Hz) EEG and eye movement density: new observations and hypotheses. Electroencephalogr Clin Neurophysiol. 1987;67(3):217–221. doi:10.1016/0013-4694(87)90019-8
53. Riemann D, Spiegelhalder K, Nissen C, Hirscher V, Baglioni C, Feige B. REM sleep instability--a new pathway for insomnia? Pharmacopsychiatry. 2012;45(5):167–176. doi:10.1055/s-0031-1299721
54. Kobasa SC, Maddi SR, Courington S. Personality and constitution as mediators in the stress-illness relationship. J Health Soc Behav. 1981;22(4):368–378. doi:10.2307/2136678
55. Palagini L, Moretto U, Novi M, et al. Lack of resilience is related to stress-related sleep reactivity, hyperarousal, and emotion dysregulation in insomnia disorder. J Clin Sleep Med. 2018;14(5):759–766. doi:10.5664/jcsm.7100
56. Bostock S, Crosswell AD, Prather AA, Steptoe A. Mindfulness on-The-go: effects of a mindfulness meditation app on work stress and well-being. J Occup Health Psychol. 2019;24(1):127–138. doi:10.1037/ocp0000118
57. Pedersen BK, Saltin B. Exercise as medicine - evidence for prescribing exercise as therapy in 26 different chronic diseases. Scand J Med Sci Sports. 2015;25(Suppl 3):1–72. doi:10.1111/sms.12581
58. Lau ZJ, Pham T, Chen SHA, Makowski D. Brain entropy, fractal dimensions and predictability: a review of complexity measures for EEG in healthy and neuropsychiatric populations. Eur J Neurosci. 2022;56(7):5047–5069. doi:10.1111/ejn.15800
59. Qi SY, Lin D, Lin LL, et al. Using nonlinear dynamics and multivariate statistics to analyze EEG signals of insomniacs with the intervention of superficial acupuncture. Evid Based Complement Alternat Med. 2020;2020:8817843. doi:10.1155/2020/8817843
60. Himes BJ, Blotter JD, Kay DB, et al. The effect of beat frequency vibration on sleep latency and neural complexity: a pilot study. IEEE Trans Neural Syst Rehabil Eng. 2021;29:872–883. doi:10.1109/TNSRE.2021.3076983
61. Feige B, Baumgartner B, Meyer D, Riemann D. The relationship between PSG and morning/evening emotional parameters in patients with insomnia disorder and good sleepers. Front Psychol. 2019;9:2712. doi:10.3389/fpsyg.2018.02712
62. Hansen DA, Satterfield BC, Layton ME, Van Dongen HPA. Sleep deprivation and sleep-onset insomnia are associated with blunted physiological reactivity to stressors. Mil Med. 2021;186(Suppl 1):246–252. doi:10.1093/milmed/usaa464
63. Miller GE, Chen E, Zhou ES. If it goes up, must it come down? Chronic stress and the hypothalamic-pituitary-adrenocortical axis in humans. Psychol Bull. 2007;133(1):25–45. doi:10.1037/0033-2909.133.1.25
64. Fries E, Hesse J, Hellhammer J, Hellhammer DH. A new view on hypocortisolism. Psychoneuroendocrinology. 2005;30(10):1010–1016. doi:10.1016/j.psyneuen.2005.04.006
65. van de Laar M, Verbeek I, Pevernagie D, Aldenkamp A, Overeem S. The role of personality traits in insomnia. Sleep Med Rev. 2010;14(1):61–68. doi:10.1016/j.smrv.2009.07.007
 © 2023 The Author(s). This work is published and licensed by Dove Medical Press Limited. The
full terms of this license are available at https://www.dovepress.com/terms
and incorporate the Creative Commons Attribution
- Non Commercial (unported, 3.0) License.
By accessing the work you hereby accept the Terms. Non-commercial uses of the work are permitted
without any further permission from Dove Medical Press Limited, provided the work is properly
attributed. For permission for commercial use of this work, please see paragraphs 4.2 and 5 of our Terms.
© 2023 The Author(s). This work is published and licensed by Dove Medical Press Limited. The
full terms of this license are available at https://www.dovepress.com/terms
and incorporate the Creative Commons Attribution
- Non Commercial (unported, 3.0) License.
By accessing the work you hereby accept the Terms. Non-commercial uses of the work are permitted
without any further permission from Dove Medical Press Limited, provided the work is properly
attributed. For permission for commercial use of this work, please see paragraphs 4.2 and 5 of our Terms.
Recommended articles
Mediating Roles of Psychological Distress, Insomnia, and Body Image Concerns in the Association Between Exercise Addiction and Eating Disorders
Ahorsu DK, Imani V, Potenza MN, Chen HP, Lin CY, Pakpour AH
Psychology Research and Behavior Management 2023, 16:2533-2542
Published Date: 5 July 2023
Performance of Four Screening Tools for Identifying Obstructive Sleep Apnea Among Patients with Insomnia
Shi C, Wang Y, Luo J, Huang R, Xiao Y
Nature and Science of Sleep 2025, 17:379-390
Published Date: 3 March 2025