Back to Journals » Nature and Science of Sleep » Volume 11
Effects of red light on sleep inertia
Authors Figueiro MG ![]() , Sahin L, Roohan C, Kalsher M
, Sahin L, Roohan C, Kalsher M ![]() , Plitnick B, Rea MS
, Plitnick B, Rea MS
Received 22 November 2018
Accepted for publication 8 March 2019
Published 3 May 2019 Volume 2019:11 Pages 45—57
DOI https://doi.org/10.2147/NSS.S195563
Checked for plagiarism Yes
Review by Single anonymous peer review
Peer reviewer comments 3
Editor who approved publication: Dr Steven Shea
Mariana G Figueiro,1 Levent Sahin,1 Charles Roohan,1 Michael Kalsher,2 Barbara Plitnick,1 Mark S Rea1
1Lighting Research Center, Rensselaer Polytechnic Institute, Troy, NY 12180, USA; 2Department of Cognitive Sciences, Rensselaer Polytechnic Institute, Troy, NY 12180, USA
Introduction: Sleep inertia, broadly defined as decrements in performance and lowering of alertness following waking, lasts for durations ranging between 1 min and 3 hrs. This study investigated whether, compared to a dim light condition (the control), exposure to long-wavelength (red) light delivered to closed eyelids during sleep (red light mask) and to eyes open upon waking (red light goggles) reduced sleep inertia.
Methods: Thirty participants (18 females, 12 males; mean age=30.4 years [SD 13.7]) completed this crossover, within-subjects, counterbalanced design study. Self-reported measures of sleepiness and objective measures of auditory performance and cortisol levels were collected on 3 Friday nights over the course of 3 consecutive weeks.
Results: Performance improved significantly during the 30-min data collection period in all experimental conditions. Subjective sleepiness also decreased significantly with time awake in all experimental conditions. As hypothesized, performance of some tasks was significantly better in the red light mask condition than in the dim light condition. Performance scores in the red light goggles condition improved significantly after a few minutes of wearing the light goggles.
Discussion: The results show that saturated red light delivered through closed eyelids at levels that do not suppress melatonin can be used to mitigate sleep inertia upon waking.
Keywords: sleep inertia, cognitive performance, alertness, red light, closed eyelids
Introduction
Sleep inertia is broadly defined as decrements in performance and lowering of alertness following waking.1 Sleep inertia has been shown to negatively impact short-term memory, vigilance, response times, the ability to resist sleep, and grip strength, with the duration of its effects lasting for as little as 1 min to as long as 3 hrs.2–4 Although sleep inertia has been reported to be most pronounced near the time of the core body temperature minimum,4,5 research has also shown that sleep inertia can occur upon waking at all times of day,6,7 including after daytime naps.2 Partial and total sleep deprivation will increase the intensity of sleep inertia, most likely due to the greater sleep pressure being experienced by those who are sleep deprived.8 Jewett et al showed that the time constant for sleep inertia dissipation in subjective alertness is 0.67 hrs, and the time constant for cognitive throughput is 1.17 hrs.8 One study demonstrated that light from a dawn simulator, delivered 30 mins prior to waking, decreased subjective sleepiness, and increased subjective activation.9 The dawn simulator accelerated the decline in both skin temperature and the distal-to-proximal skin temperature gradient after waking, which the study’s authors found to be coincident with (but not necessarily causally related to) an observed dissipation of sleep inertia. The study’s authors did not find any other effects of the dawn simulator on performance, core body temperature, or cortisol levels. More recently, Gabel et al showed that a dawn-simulating light exposure (30 mins prior to waking) improved subjective measures of well-being and mood, as well as objective measures of cognitive performance.10
Previous studies have demonstrated the impacts of short-wavelength (blue) light on well-established circadian system biomarkers (cortisol11 and melatonin12,13), circadian phase,14,15 and electroencephalogram (EEG) recordings.16,17 Long-wavelength (red) light has been shown to have an impact on some of these biomarkers and subjective measures of alertness.17–20 The impact of red light on alertness, specifically, has significant implications for shift workers because receiving low levels of red light increases measures of alertness without affecting melatonin levels. Blue light exposure at night has also been associated with increased alertness, but even low levels of blue light (eg, 40 lx at the eye) will suppress melatonin. Melatonin has been shown to be an anti-oxidant, and the suppression of melatonin by light at night has been linked to negative health consequences.21 While the impact of red light at night on cortisol levels remains unclear, one study showed that nighttime exposure to red light increased cortisol levels while daytime exposure did not.22
The literature is also more or less clear on the magnitude and duration of sleep inertia after waking during different stages of sleep.6,7 Sleep inertia is greatest and longest lasting after waking from slow-wave sleep, which is prevalent in the first hours of a sleep episode. It has been suggested that environmental factors, such as light exposure after waking, can reduce sleep inertia by elevating sympathetic system response.1 The impact of controlled light exposures (ie, in terms of spectrum, amount, duration, and timing) on sleep inertia, however, is not as clear. While positive results were observed with a dawn simulator,9,10,23 it is known that these devices deliver only very low light levels to the retina through closed eyelids.24,25 No studies to date have investigated the delivery of light during sleep via a light mask to mitigate sleep inertia. Toward that end, Bierman et al developed a technique to measure and model the human eyelid’s spectral transmittance.25 Given the relatively high transmission of red light through closed eyelids, and that very high levels of red light are required to suppress melatonin and promote circadian phase shifts, we hypothesized that delivery of modest levels of red light through closed eyelids might be useful for reducing sleep inertia without affecting concentrations of melatonin.
In the present study, we assessed the impact of controlled red light exposures on sleep inertia while participants were awake and when they were asleep. It was hypothesized that measures of performance (auditory performance testing) and alertness (subjective sleepiness) would improve with time awake due to the natural reduction in sleep inertia.8 It was also hypothesized that sleep inertia, especially upon waking, would be reduced with exposure to red light. Specifically, compared to a dim light condition (the control), it was hypothesized that those who experienced red light while asleep (via a light mask delivering light through closed eyelids) would have the least sleep inertia at the start of the performance testing, while those experiencing red light upon waking (via light goggles delivering light soon after waking) would exhibit less sleep inertia for a shorter period.
Materials and methods
Participant selection and sleep schedule
Of the 33 participants recruited through Rensselaer Polytechnic Institute campus email notices and word of mouth, 30 participants (18 females, 12 males; mean age =30.4 years [SD 13.7]) completed the protocol. All participants were prescreened for major health problems such as bipolar disorder, seasonal depression, cardiovascular disease, diabetes, and high blood pressure. Participants were excluded from the study if they were taking over-the-counter melatonin or any prescription medications (eg, blood pressure medicine, antidepressants, sleep medicine, or beta-blockers). They were also excluded if they reported any type of eye disease (eg, cataracts, glaucoma, etc.) or had scheduled trans-meridian travel during the course of the study.
One week prior to the study, participants attended an orientation session in which they were trained on the auditory performance tasks employed in the experiment. Because the experimenters were only capable of administering all 3 conditions to a maximum of 12 participants during any given experimental session, the participants were divided into 3 study cohorts. The first cohort of 12 participants was divided into 3 equal groups who experienced the 3-week protocol between 25 March 2016 and 8 April 2016. The second cohort of 7 participants was divided into 2 groups (one group of 4 and one group of 3 participants) who experienced the 3-week protocol between 15 July 2016 and 29 July 2016. The third cohort of 11 participants was divided into 3 groups (2 groups of 4 and one group of 3 participants) who experienced the 3-week protocol in August 2018.
Participants were asked to maintain a regular sleep schedule during the 3-week study period, having them in bed by 23:00 each night and out of bed by 08:00 each morning, with a time-in-bed between 7 hrs and 9 hrs per night. In order to monitor sleep-schedule compliance, participants were asked to keep a sleep log of their estimated times of sleeping and waking. Participants were also asked to wear an actigraph (Actiwatch Spectrum Plus, Philips Respironics, Murrysville, Pennsylvania, USA) to monitor their movement and permit verification of their compliance with the sleep schedule prior to each experimental session. Prior to each session, the actigraphs were inspected for compliance with the imposed bed and wake times. All of the participants complied with the requirement and thus were included in the study nights. The actigraph data were not otherwise used in the study’s analyses, except for the third cohort of participants (see Procedures), who wore the actigraph while sleeping in the laboratory. This allowed the experimenters to ascertain that the participants’ sleep efficiency was not negatively affected by wearing the sleep mask.
All participants provided written informed consent. The research was approved by Rensselaer Polytechnic Institute’s Institutional Review Board and was performed in compliance with the principles outlined in the Declaration of Helsinki.26 The study did not meet the criteria for a ClinicalTrials.gov registration.
Experimental conditions
The study’s participants experienced 3 experimental conditions: (1) “red light mask” (RM) worn during sleep prior to auditory performance testing, (2) “red light goggles” (RG) worn upon waking and during auditory performance testing, and (3) “dim light” (D) during auditory performance testing (the control).
For the RM condition, participants received red light through closed eyelids during the experiment’s 90-min sleep opportunity but were not exposed to red light during the performance testing. The red light masks housed 60 red LEDs (maximum wavelength [λmax]=628 nm, full width at half maximum [FWHM]=13 nm), with 30 LEDs directed at each eye. Each mask was capable of creating 688 lx, on average, at the eyelid of the wearer, which was targeted to deliver 56 lx at the corneas after transmittance through the eyelid (see Devices Calibration Procedure).25 The red light masks were fastened to participants’ heads with a headband (Figure 1), and participants were instructed to keep their eyes closed at all times during the sleep opportunity. The red light mask was removed for the performance testing.
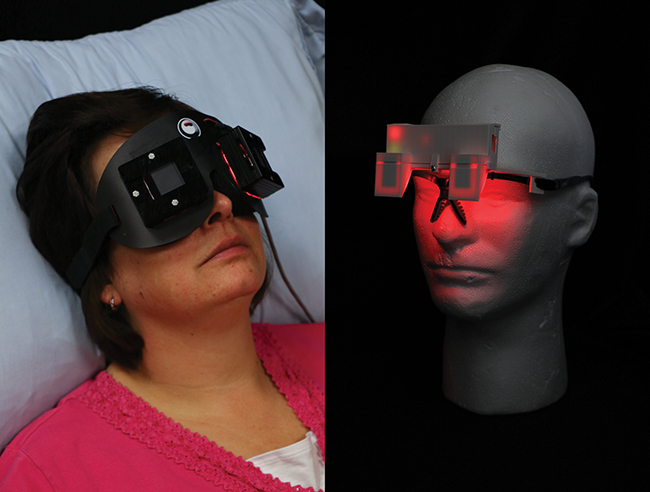 | Figure 1 The red light mask (left) used for the RM experimental condition while participants were asleep, and the red light goggles (right) used for the RG experimental condition immediately after waking. |
For the RG condition, participants were in bed and in darkness during the 90-min sleep opportunity, and upon waking put on the red light goggles and wore them during the performance testing. The red light goggles housed 2 red LEDs (λmax =631, FWHM =14 nm), with one LED directed at each eye. Each LED was targeted to deliver 55 lx on average at the eye (see Figure 1).
For the D condition, participants were not exposed to any light treatment, both while in bed during the 90-min sleep opportunity and during the performance testing.
During the performance testing for all 3 experimental conditions, the laboratory lighting was provided by dim white light (<5 lx at the eyes) generated by a single fluorescent lamp torchiere placed in the corner of each room, approximately 3 m from the participants.
Calibration procedures
The red light goggles, placed on a mannequin head, were calibrated using a spectrometer (Red Tide 650, Ocean Optics, Largo, Florida, USA). The spectrometer’s sensor was placed at the eye of the mannequin and the illuminance levels at each eye were measured at a distance of 4.45 cm.
The red light goggles were calibrated to deliver 55±3 lx. The red light masks were calibrated using an illuminance meter (model LMT B 360, LMT Lichtmessteshnik GMBH Berlin, Berlin, DE). The illuminance levels at each eye were measured at a distance of 1.9 cm. The light masks were also calibrated to deliver 55±3 lx at the corneas, after taking into account the mean eyelid transmittance value derived from Bierman et al.25
Subjective sleepiness
Subjective sleepiness data were obtained from participants through self-assessment using the Karolinska Sleepiness Scale (KSS) questionnaire developed by Åkerstedt and Gillberg.27 During each experimental session, a KSS response was obtained just after waking and after each of the 4 auditory performance test blocks (see Procedures). The KSS measure rates each participant’s current feelings of sleepiness on a scale that ranges from 1 to 9 points, with 1=“extremely alert” and 9=“very sleepy, great effort to keep awake, fighting sleep.” Five KSS questionnaires were administered to the participants during each study session.
Biomarkers
Saliva samples were collected to measure cortisol levels using the Sarstedt Salivette system (Sarstedt AG, Nümbrecht, DE) immediately upon waking, 15 mins after waking (the middle of the 30-min data collection period), and at the end of the data collection period (see Procedures). Three saliva samples were obtained from the participants during each study session. Salivary free cortisol levels were measured for all 3 study cohorts (see Participant Selection and Sleep Schedule) using the Cortisol Saliva ELISA kit (Labor Diagnostika Nord, Nordhorn, DE). The assay range is 0–30 μg/dL, with intra-assay and inter-assay coefficients of variability of 3.8% and 6.4%, respectively.
Melatonin concentrations were determined for participants in cohorts 1 and 2 by radioimmunoassay using the Melatonin Saliva Direct RIA kit (Labor Diagnostika Nord, Nordhorn, DE). The lower limit of detection is 1.4 pg/mL and the intra-assay and inter-assay coefficients of variability are 10.3% and 11.4%, respectively. Consistent with a previous study,22 and given that results from cohorts 1 and 2 showed that melatonin concentrations were not affected by either lighting intervention, as well as due to the study’s budgetary constraints, melatonin concentrations were not determined for cohort 3.
Auditory performance tasks
The experimental software for the auditory performance tasks was developed by the experimenters using Python (Python Software Foundation, Beaverton, Oregon, USA), an open-source computer programming language, and Pygame (an open-source set of Python modules designed for writing computer games). Participants wore identical, individual sets of headphones during the performance testing. Performance and hearing were screened prior to the experiment to ensure that participants understood the tasks and could hear the stimuli. Two auditory performance tests were administered to participants over the course of the experiment. Performance testing was conducted on identical computers running the Microsoft Windows 7 operating system (Microsoft Corporation, Redmond, WA, USA). All auditory stimuli were generated using the beep function of Winsound (a Python module that provides sounds on the Windows platform) with each computer’s volume mixer level set at 40. The experimenters set the duration, frequency, and volume of the experimental auditory stimuli to be audible but not easily detectable. The performance testing lasted approximately 30 mins and was divided into 4 test blocks (numbered 1–4) of 7–8 mins each.
The first performance test was a “go/no-go” (GNG) task,28 which occurred during blocks 1 and 2, and the second performance test was a “target detection” (TD) task,29 which occurred during blocks 3 and 4. It was expected that participant boredom would be a factor if only one type of test were employed for the entire 30-min data collection period. The decision to place the GNG and TD tasks in their respective blocks was arbitrary. Prior to each test block, participants were briefly reminded of the instructions for the task and were given control to begin each block. Computer screens were adjusted to the lowest brightness setting and covered with 2 layers of orange filter medium (Roscolux #21 golden amber, Rosco Laboratories, Stamford, Connecticut, USA). In all 3 experimental conditions, participants were instructed to keep their eyes open and look directly at the screen. The sound levels for the auditory performance tasks were set prior to each session by the experimenters, and no volume adjustments were made during the data collection.
GNG task
For the GNG task, participants were presented with 2 types of tones through their headphones, a target (“go”) tone and an inhibitor (“no-go”) tone. The target stimulus was a lower frequency tone presented for 150 ms. The inhibitor stimulus was a higher frequency tone presented for 150 ms. The interstimulus interval (ISI) between trials was randomly generated between 600 and 2,300 ms. Each GNG block consisted of 280 trials; 224 (80%) of those trials were “go” and 56 (20%) were “no-go.” Prior to each experimental session, the order of the GNG trials was randomly generated. Participants were instructed to respond as quickly as possible to the “go” tones by pressing the spacebar on the test computer keyboard. Participants were instructed not to respond to “no-go” tones. The trials were presented continuously, regardless of the participant’s actions. If the participant responded to a “no-go” tone, a “false positive” was recorded. If the participant did not respond to a “go” tone, a “lapse” was recorded.
TD task
The TD task consisted of 2 different stimulus types (ie, warned and unwarned). Warned trials presented both the warning stimulus and the target stimulus, while the unwarned trials presented only the target stimulus. The warning stimulus, a higher frequency tone presented for 200 ms, informed participants that a target stimulus would soon be presented. After a variable cue-target interval of 400–1,090 ms, the target stimulus (a lower frequency tone) was presented for 150 ms. Participants were instructed to respond as quickly as possible to the target stimulus by pressing the spacebar on the test computer keyboard. Participants were instructed to wait until the target stimulus had been presented before responding. If participants responded prematurely during a given trial, a “false start” error was recorded. If the participant did not respond to either the warning stimulus or the target stimulus, a “lapse” was recorded. The trials were presented continuously, regardless of the participants’ actions. Each TD block consisted of 45 (50%) warning trials and 45 (50%) unwarned trials. The randomly generated time between trials was between 1 and 8 s.
Procedures
Except for one participant who completed only 2 conditions (D and RG) and whose data were nonetheless included in the analyses, all of the other participants experienced all 3 experimental conditions on separate, consecutive Friday nights during the course of the study (Figure 2). The conditions were counterbalanced across participant groups (within cohorts) to avoid order effects.
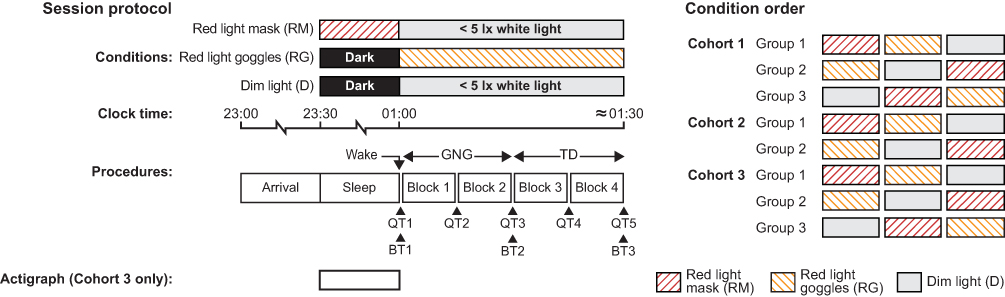 | Figure 2 Schematic diagram of the within-subjects, crossover design schedule for lighting conditions, auditory performance testing (GNG and TD tasks), sleep questionnaire administration (QT1–QT5), and circadian system biomarker measurements (cortisol and melatonin, BT1–BT3) for all experimental sessions. The 90-min sleep opportunity period included a 30-min window for the participants to fall asleep, and participants were expected to sleep for at least 1 hr. During the red light mask condition, participants’ eyes were closed during the sleep period and the light stimulus was received through their eyelids. The order of conditions for each of the study cohorts is shown on the right.Abbreviations: BT, biomarker time; GNG, go/no-go task; QT, questionnaire time; TD, target detection task. |
The participants arrived at the laboratory between 23:00 and 23:15 and were directed to their individual mattresses by 23:30, which was 30 mins after the latest scheduled bedtime requested by the experimenters. The experiment was scheduled to ensure that participants would be tired when given the sleep opportunity. The laboratory thermostat was set to 72 °F (22.2 °C) on all experimental nights. Participants in the RG and D conditions were in complete darkness while in bed. Darkness was ensured by de-energizing all lighting and using blackout curtains in laboratories with windows. As noted (see Experimental Conditions), participants in the RM condition received the light through closed eyelids during the sleep opportunity.
After being directed to bed at 23:30, the participants were given a 90-min sleep opportunity. The experimenters verified that the participants were asleep between 24:00 and 01:00 through direct visual and auditory monitoring. Participants were wakened at 01:00, directed to record a KSS score and provide the first of 3 saliva samples (for cortisol and melatonin), and instructed to keep their eyes open for the rest of the experimental session. Participants then began the auditory performance tasks, which were divided into the 4 blocks described above (see Auditory Performance Tasks). Participants recorded additional KSS scores after each test block and provided single saliva samples upon completion of the GNG (end of block 2) and TD (end of block 4) performance tasks. After all participants had completed the auditory performance testing and provided their final saliva sample and KSS score, they affirmed to the researchers that they had fallen asleep between 24:00 and 01:00 (no objective sleep measures were collected). The participants experiencing the RM condition were also specifically asked whether the condition had affected their ability to fall asleep and/or the quality of their sleep. After these questions were answered and participants’ responses were recorded by the experimenters, the participants were free to leave the laboratory. Participants were not permitted to use self-luminous electronic devices of any kind during the experimental sessions.
Data analyses
The GNG and TD responses were scored as valid for participants response times (RTs) >150 ms, which represents the threshold for stimulus perception and human motor response.30 The software developed for the performance testing started recording participants’ RTs after a 150-ms stimulus offset, thus potentially excluding any participant responses that occurred during the presentation of the following stimulus tones. To account for this, 150 ms were added to each RT. Furthermore, GNG trials that were preceded by an ISI ≤1,000 ms were excluded from the GNG analysis to avoid conflating RTs for shorter ISI durations with false starts on the preceding trial.
Given that the effects of sleep inertia can last for as little as 1 min,1 as well as our hypothesis that the RM would be most effective condition for reducing sleep inertia at beginning of the data collection period, we also examined data from the first and the last 2-min periods in each test block. The experimenters determined that a 2-min period was the shortest duration for providing sufficient data to perform the analyses. Therefore, the RTs (in seconds) for each condition registered during the first and the last 2-min time periods (T) of each test block (eg, block 1 and block 2) were grouped and then averaged for each participant and defined as T1 and T2 for block 1, and T3 and T4 for block 2. The same procedure and naming convention were employed for block 3 (T1 and T2) and block 4 (T3 and T4).
Using the average of the 2-min data, the following outcome measures were calculated for the auditory performance tasks (both GNG and TD, unless otherwise indicated): (1) score (ie, number of valid responses divided by the mean RT in seconds); (2) response speed (RS) (ie, 1/RT in seconds); (3) 10% best and 10% worst RTs in seconds (GNG only); (4) number of false starts (FS); (5) false positive (FP) rate (ie, number of responses divided by the number of no-go trials, GNG only); (6) hit rate (HR) (ie, the number of valid responses divided by the number of go trials); (7) lapses; and (8) lapse probability (ie, number of lapses divided by the number of valid stimuli, excluding false starts, multiplied by 100). Lapses were defined as RTs ≥500 ms.
These outcomes are based on those used by Basner and Dinges in their systematic investigation of the psychomotor vigilance test’s (PVT) duration and performance, and the capacity for the visual PVT to discriminate sleep-deprived participants from alert participants.31 It should be noted that these outcomes were not validated in the auditory PVT. In the auditory PVT, the ISIs were reduced to account for the shorter test duration employed in our study (7 mins rather than the 10-min test duration employed by Basner and Dinges) and the fact that RTs in auditory performance testing are generally shorter than RTs in visual performance testing.30
Statistical analyses
Statistical analyses were performed using the open-source statistical programming language R and an integrated development environment for that language, Rstudio (The R Foundation for Statistical Computing, Vienna, AT). The GNG and TD task data were entered into linear mixed effect models in which participant was entered as a random factor, and lighting condition (ie, RG, RM, and D) and time period (ie, T1, T2, T3, and T4) were entered as fixed factors. In the TD task model, trial type (ie, warned or unwarned) was also entered as a fixed factor.
For the KSS data, linear mixed effect models used KSS scores as the outcome measure. Participant was entered as a random factor, and lighting condition and questionnaire time were entered as fixed factors. The linear mixed effect models for biomarkers used cortisol (in μg/dL) and melatonin (in pg/mL) levels as the outcomes, with participant entered as a random factor and lighting condition and biomarker time entered as fixed factors. Note that the melatonin results only include data from cohorts 1 and 2 (see Biomarkers), which were composed of 19 (11 females, 8 males) participants whose ages ranged from 18 to 52 years (mean age =26.9 years [SD 12.2]).
It was hypothesized that performance in all 3 lighting conditions (RG, RM, and D) would improve over the course of the 30-min data collection period due to the natural dissipation of sleep inertia. It was also hypothesized that, compared to the D condition, performance in the RM condition would be better, especially at the start of the testing, and that performance in the RG condition would improve over the course of the entire 30-min data collection period. These a priori hypotheses were tested using 1-tailed paired Student’s t-tests comparing performance under the RM and RG conditions to the D (control) condition. Two-tailed paired Student’s t-tests (with Bonferroni corrections when appropriate) were used when the observed effect was not in the direction of our a priori hypotheses.
Results
Auditory performance tasks
GNG task
Linear mixed effects models for the GNG task showed a significant main effect of lighting condition for score, RS values, and FS values (Table 1). The scores and the RS values were significantly greater in the RM condition than in the D condition (t27=2.67, P<0.01 and t27=2.77, P<0.01, respectively [Figure 3]). The FS values were also significantly lower in the RM and RG conditions compared to the D condition (t27=2.07, P=0.02 and t29=2.02, P=0.03, respectively). There was no significant interaction between lighting condition and time period for score, RS values, and FS values (Figure 3) nor any of the other GNG task outcome measures (see Table 1).
 | Table 1 Linear mixed effects model for the GNG task outcome measures |
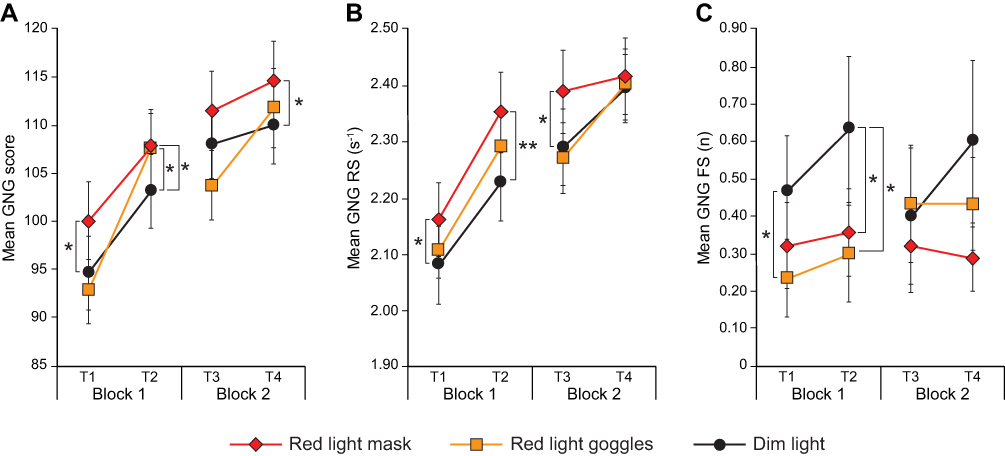 | Figure 3 Results recorded for the GNG task under the study’s 3 lighting conditions: (A) mean scores, (B) mean RS values, and (C) mean FS values. The error bars represent SEM. Statistical significance: *P<0.05, **P<0.01. See data analyses.Abbreviations: GNG, go/no-go task, RS, response speed; FS, number of false starts. |
Consistent with our hypothesis that performance would increase over the course of the experiment, significant main effects of time period were observed for score, RS values, 10% best RT, 10% worst RT, FP, lapses, and lapse probability (see Table 1). One-tailed paired Student’s t-tests (with Bonferroni corrections) revealed that participants’ performance improved significantly over successive time periods in almost all of the GNG outcome measures; the sole exception was the FP outcome, with FP values increasing, rather than decreasing (ie, improving) over the course of the 30-min data collection period (Figure 4).
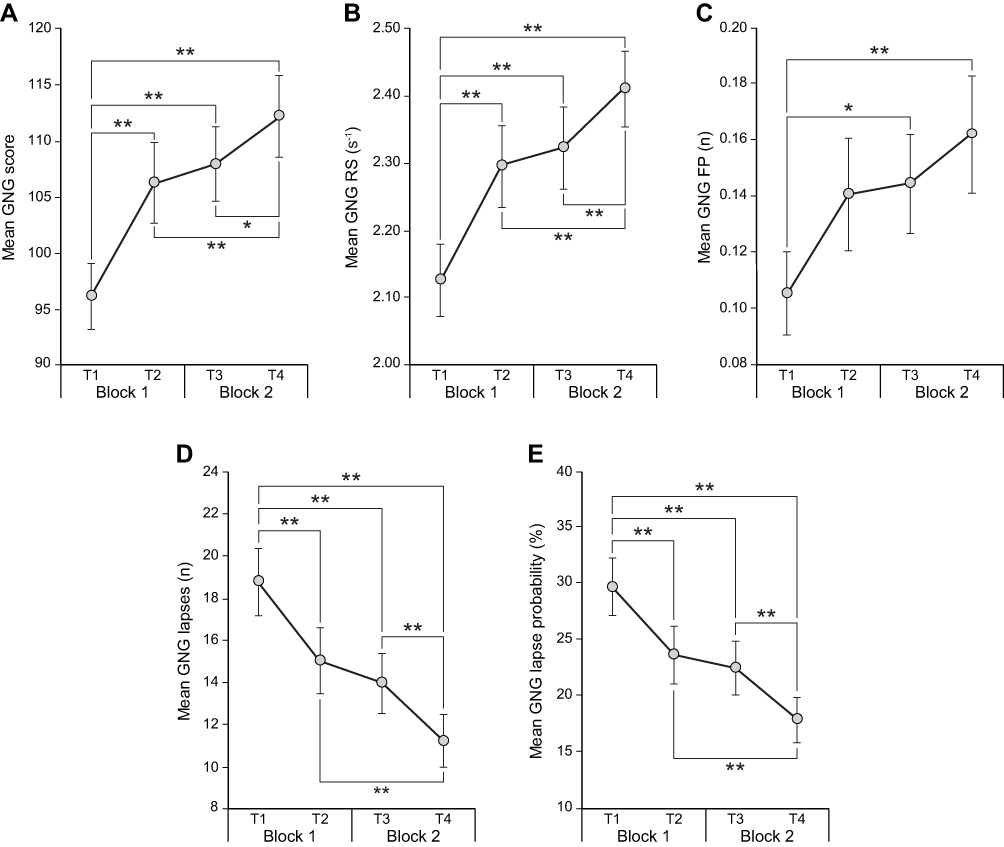 | Figure 4 Results recorded for the GNG task under all lighting conditions at the first (T1 and T2) and last (T3 and T4) 2-min time periods during each performance testing block: (A) mean scores, (B) mean RS values, (C) mean FP values, (D) mean number of lapses, and (E) mean lapse probability. The error bars represent SEM. Statistical significance: *P<0.05, **P<0.01. See data analyses.Abbreviations: GNG, go/no-go task; RS, response speed; FP, false-positive rate. |
TD task
For the TD task, which occurred in the last 15 mins of the 30-min data collection period, linear mixed effects models showed a significant main effect of stimulus type (ie, unwarned vs warned) for score, RS values, FS values, lapses, and lapse probability (Table 2). Two-tailed paired Student’s t-tests revealed significant differences between unwarned and warned stimuli type for score (t30=8.66, P<0.01); RS values (t30=10.73, P<0.01); FS values (t30=2.24, P=0.03); lapses (t30=11.06, P<0.01); and lapse probability (t30=10.59, P<0.01). There was also a significant main effect of time period for score (see Table 2), in which participants’ scores were significantly higher during the second half of the TD task period (block 4) than during its first half (block 3 [Figure 5]).
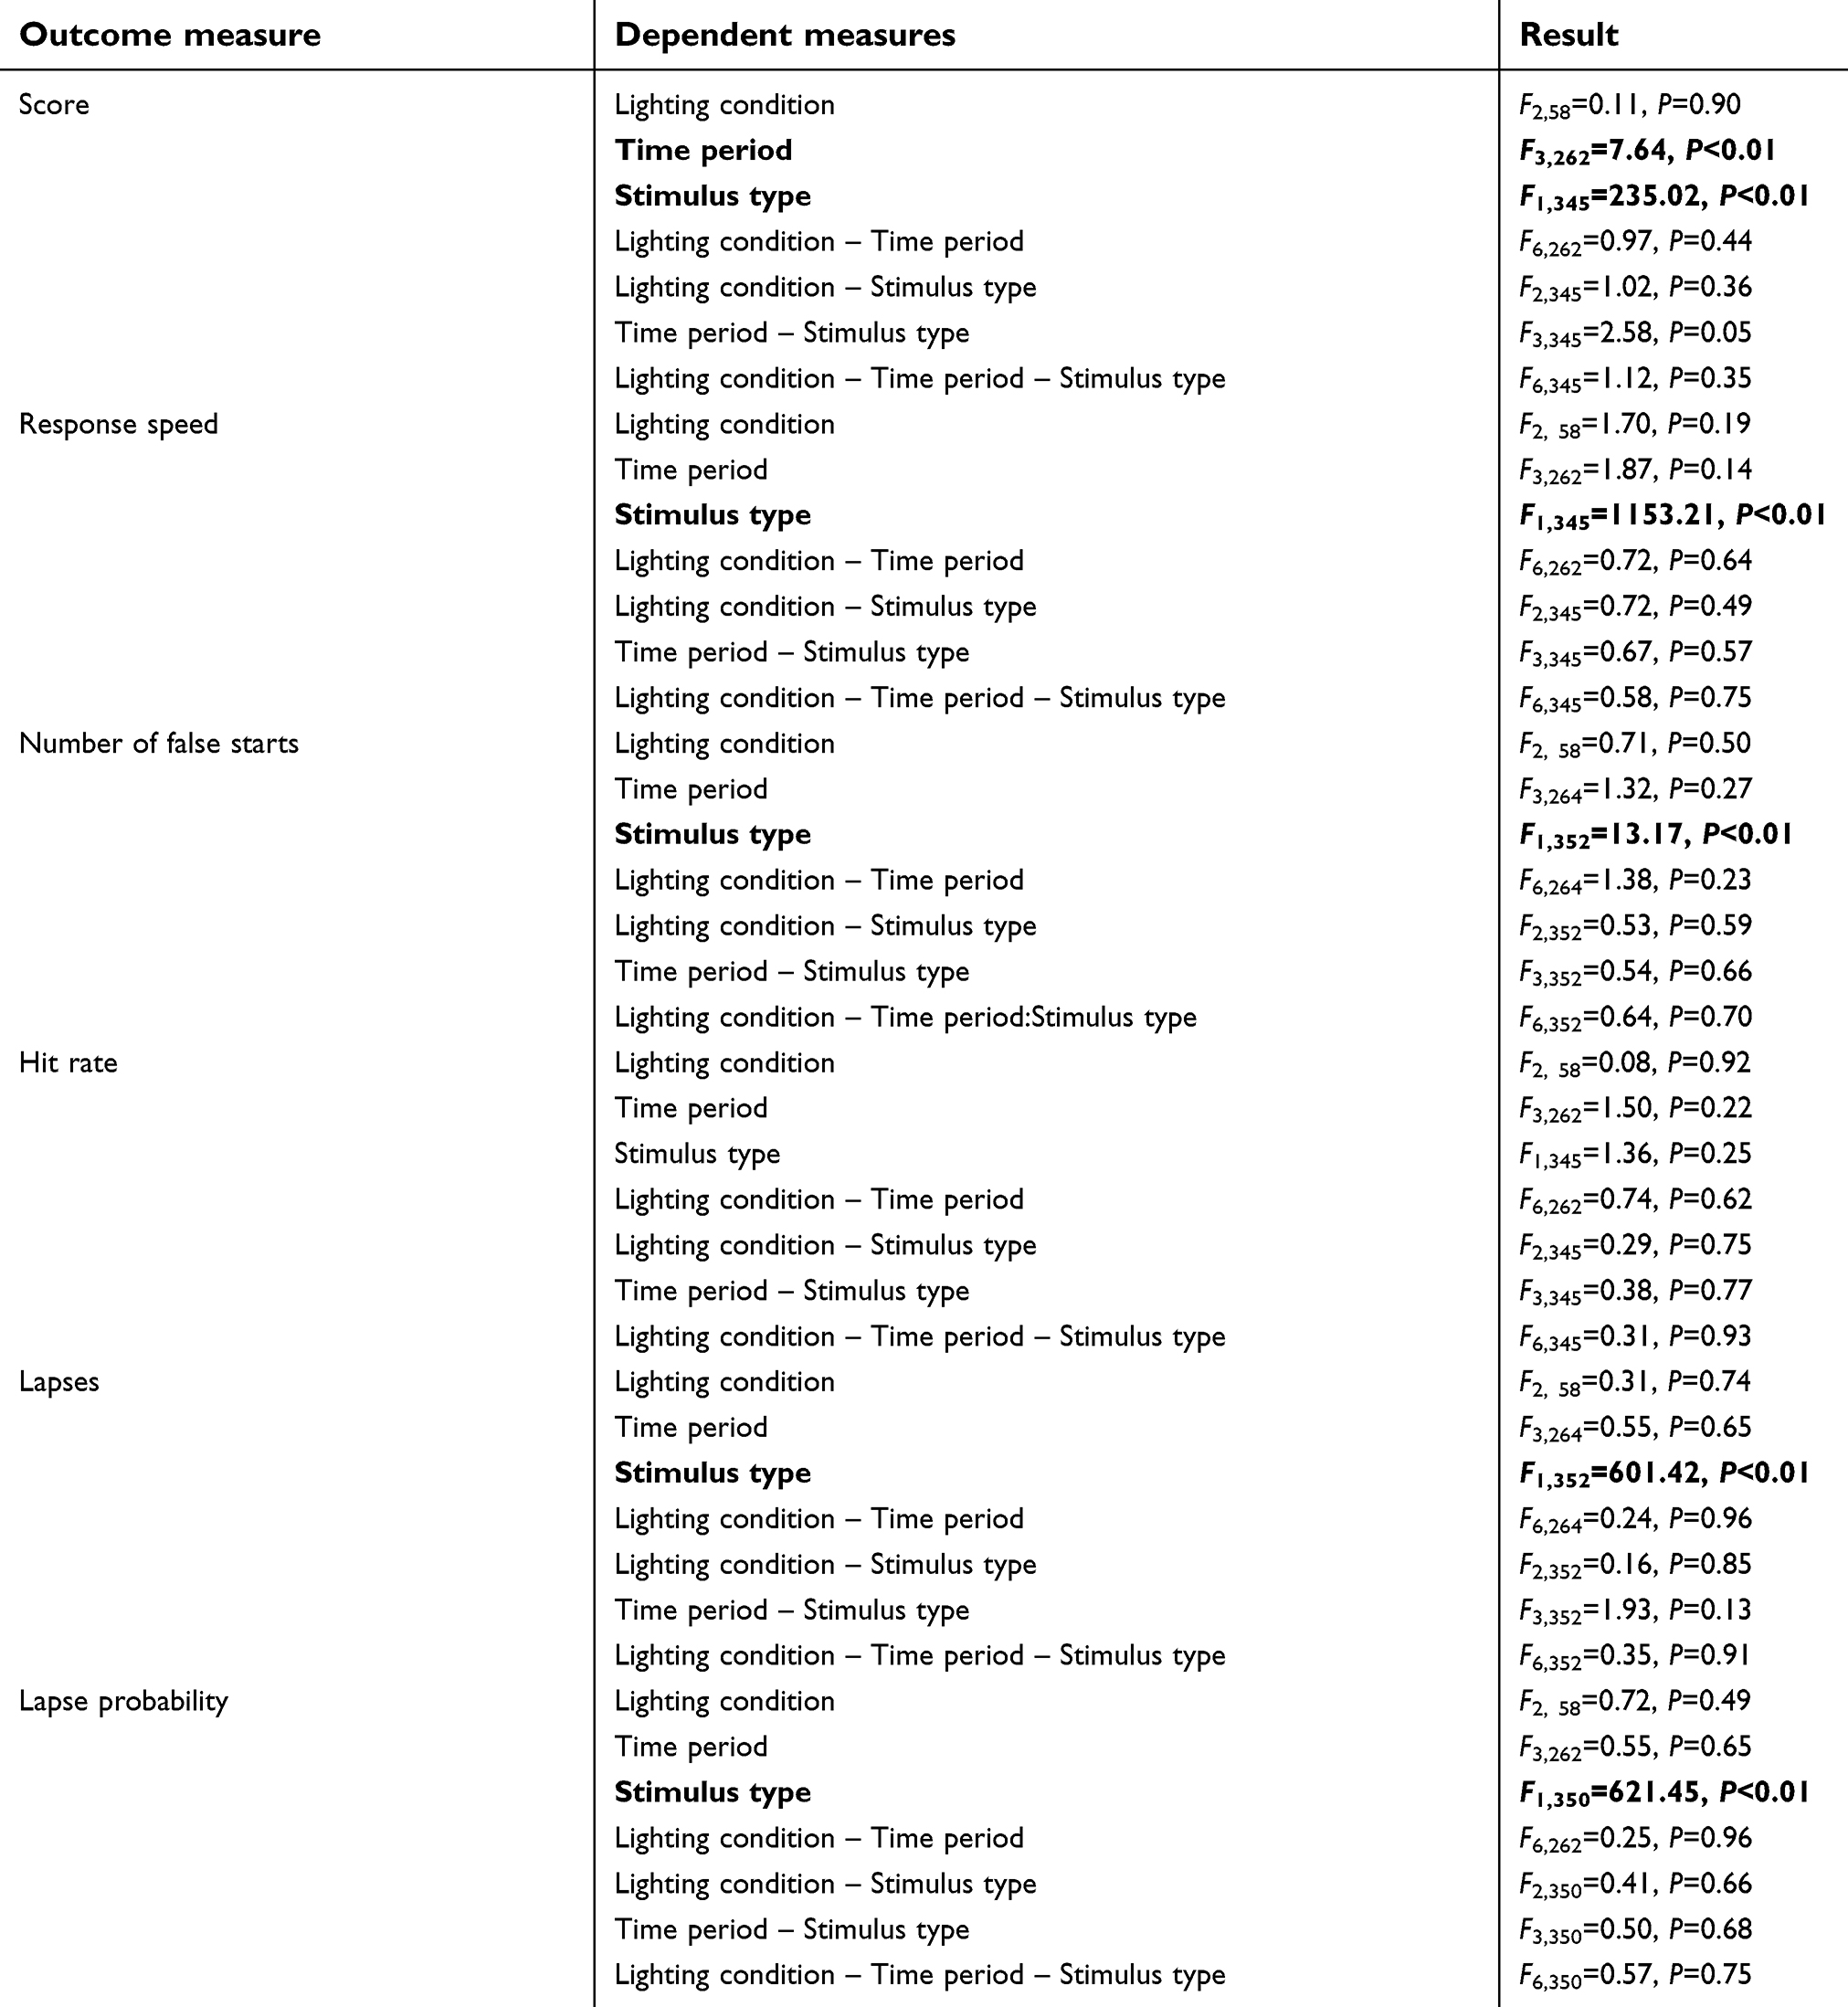 | Table 2 Linear mixed effects model for the TD task outcome measures |
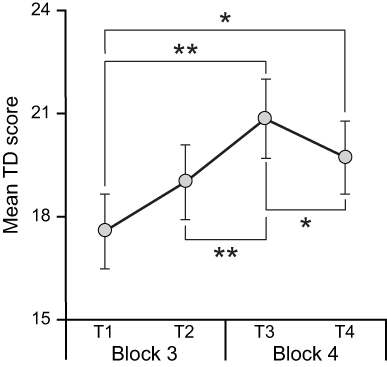 | Figure 5 Mean TD results for all conditions at the first (T1 and T2) and last (T3 and T4) 2-min time periods during each TD performance testing block. The error bars represent SEM. Statistical significance: *P<0.05, **P<0.01. See data analyses. Abbreviations: TD, target detection task. |
Subjective sleepiness (KSS) scores
Linear mixed effects models for the KSS analysis showed a significant main effect of questionnaire time (F4,364=4.025, P<0.01). Consistent with a dissipation of sleep inertia with time awake, participants reported feeling less sleepy over the course of the 30-min data collection period. None of the post hoc comparisons, however, reached statistical significance after Bonferroni corrections.
Biomarker measurements
Linear mixed effects models for the cortisol analysis showed significant effects of biomarker time for cortisol levels (F2,184=72.712, P<0.01). Linear mixed effects models for melatonin concentrations showed a significant effect of biomarker time (F2,88=6.185, P<0.05). As time progressed through each test block, cortisol and melatonin concentrations increased significantly, but light through either closed (RM) or open (RG) eyelids did not affect the concentrations of these biomarkers.
Discussion
The present study investigated whether exposure to long-wavelength (red) light, which has been shown to improve measures of alertness and certain types of performance,18 could be used to reduce sleep inertia, operationally defined here as an improvement in short-term performance measures after a 90-min sleep opportunity. More specifically, it was hypothesized that compared to dim light (D, the control condition), red light exposures either during sleep (RM condition) or upon waking (RG condition) would reduce performance in 2 short-term auditory performance tasks (GNG and TD). It was also hypothesized that performance in all 3 lighting conditions (RM, RG, and D) would improve over the 30-min data collection period due to a dissipation of sleep inertia. Finally, it was further hypothesized that compared to the D condition, performance in the early part of the data collection period would be better for participants in the RM condition, while improved performance in the RG condition would only be observed a few minutes after the red light goggles were energized.
The results showed that performance improved significantly in the RM condition compared to D condition. Moreover, when performing secondary analyses using GNG score as an outcome measure, post hoc 1-tailed t-tests showed that participants responded more quickly and made fewer errors at the beginning of the data collection period after exposure to the red light mask during sleep. The positive impact of the RG condition was mostly observed during T2 (ie, 7–8 mins after commencement of the testing). It should be noted, however, that although the red light mask worn during sleep resulted in better performance than keeping participants in darkness during sleep, the present study lacks participants’ baseline measures of sleepiness or performance (ie, collected when they are well rested). Future studies should investigate whether such interventions at night can bring performance close to normative, well-rested performance and subjective sleepiness levels.
The significant effect of time period in the performance testing and the KSS analysis, and the lack of a significant effect of lighting condition in the TD performance task (performed in the last 15 mins of the 30-min data collection period) were likely due to dissipation of sleep inertia as time awake increased. As time awake increased, sleep inertia dissipated and all participants’ performance improved. These results are consistent with other studies showing that sleep inertia, as measured by cognitive throughput and reaction times of correct responses in a visual search task, was reduced 10–30 mins after waking.4,32 Our hypothesis that performance in the RG condition would be better than in the D condition at the end of the data collection period was not confirmed, however, perhaps because the impact of the sleep inertia dissipation was more pronounced. This dissipation, therefore, washed out any positive effect of the RG condition compared to the D condition.
Other studies have shown the benefits of delivering light prior to sleep or upon waking to reduce sleep inertia,3,23,33,34 although a recent review of studies exploring reactive countermeasures to sleep inertia suggests that the evidence is not yet convincing and more research is required.35 Hayashi et al exposed participants to 2,000 lx at the eye for 1 min after waking from a 20-min daytime nap without an observed effect on performance but noted a small effect on subjective responses after 45 mins of waking.34 The present results are not consistent with those of Santhi et al, who investigated the impact of 4 lighting conditions (dim, 200 lx at the eye of a 2700 K light source, 195 lx at the eye of a 17,000 K light source, and 750 lx at the eye of a 17,000 K light source) on sleep inertia.3 That study measured performance and subjective sleepiness just prior to, and at regular intervals for 4 hrs after waking from, a 6.5 hr nocturnal sleep opportunity. Santhi et al did not observe significant differences between the conditions in terms of subjective sleepiness or performance, measured every 30 mins for the first 2 hrs and then every hour up to 4 hrs after waking. The differences between results from that study and the present study might be attributable to differences in the experimental protocol (ie, longer sleep duration and testing during the early morning hours). Van de Werken et al exposed participants to a dawn simulator delivering light that increased to 300 lx (measured at eye level) in the 30 mins prior to waking.9 Unlike the present results, that study’s investigators observed an improvement in subjective sleepiness (KSS) at 15 mins after waking compared to a control condition, but no improvement in post-sleep performance on an addition task and a simple reaction time task. The present study is novel and extends from previous studies because, first, it tightly controlled the corneal illuminance experienced by the participants and, second, its results are the first to suggest that saturated red light, which has been shown not to suppress melatonin, can be used to mitigate sleep inertia.
The present study did not select participants based on chronotype. A recent study by Ritchie et al showed that performance after waking for earlier chronotypes took approximately 10–20 mins to improve, while it took approximately 30 mins or longer to see a significant improvement in the performance of later chronotypes.4 While participants’ chronotypes may have impacted our results, it should be noted that all of the participants maintained regular sleep schedules and all data were collected early in the night. Future studies should investigate whether light exposures would have a different impact on different chronotypes when waking at different times of the night.
One major limitation of our study was that we did not collect any objective measures of sleep (polysomnography [PSG]), and therefore, we do not know whether those wearing the red light mask during sleep had lower sleep quality or duration, both of which could have impacted their sleep inertia and their performance during testing. Our observations during the study and our informal interviews with participants at the end of the data collection period suggest that participants slept during the 90-min sleep opportunity periods in all experimental sessions. The 11 participants in the third and final study cohort (see Participant Selection and Sleep Schedule) wore actigraphs during the sleep opportunity periods. Although not statistically significant, their sleep efficiency was greater during the RM condition (95% efficiency) than during the D condition (90% efficiency). Except for 3 participants in the D condition, all other participants in all 3 conditions had sleep efficiency >80%, and all but 2 participants in the RM condition had sleep efficiency >90%. These results are consistent with our previously published studies,36–38 where PSG measurements, collected during the first 90 mins of sleep, did not reveal any significant effect of light exposure from the light mask on sleep duration and quality. Future studies should employ an objective measure of sleep to reaffirm our previous findings that the quality and quantity of sleep are not affected while sleeping with the red light mask.
Another limitation of the present study that is worth noting is the fact that data were collected in 2 different seasons (spring and summer). We do not believe, however, this seasonal difference may have impacted our results because the participants had regular schedules and were likely to experience similar daytime light exposures. Moreover, there is no evidence in the literature suggesting that seasons can have an impact on sleep inertia severity.
Conclusion
The present study reports on a novel, practical countermeasure for sleep inertia that can have important implications for first responders, medical residents, or those who have extended overnight shifts and are permitted to take naps at work.
Acknowledgments
The authors would like to acknowledge Kassandra Gonzales, Dennis Guyon, Geoffrey Jones, Ryan Kutler, Sharon Lesage, Rebekah Mullaney, Rohan Nagare, David Pedler, and Greg Ward for their technical and editorial assistance. The person shown in Figure 1 has provided written informed consent for the image to be published. This research was funded by the Office of Naval Research (Grant # N00014-14-1-0480). Light mask development was funded by the National Institute on Aging (NIA R01AG042602). The results of this research (the cortisol and melatonin analyses) were presented in a poster displayed at the World Sleep 2017 Congress conference in Prague, Czech Republic, in October 2017. The poster abstract was published in Sleep Medicine, volume 40, supplement 1, in December 2017 (
Disclosure
Dr Mariana G. Figueiro reports a patent pending for the light mask. The authors report no other conflicts of interest in this work.
References
1. Tassi P, Muzet A. Sleep inertia. Sleep Med Rev. 2000;4(4):341–353. doi:10.1053/smrv.2000.0098
2. Hofer-Tinguely G, Achermann P, Landolt HP, et al. Sleep inertia: performance changes after sleep, rest and active waking. Brain Res Cogn Brain Res. 2005;22(3):323–331. doi:10.1016/j.cogbrainres.2004.09.013
3. Santhi N, Groeger JA, Archer SN, et al. Morning sleep inertia in alertness and performance: effect of cognitive domain and white light conditions. PLoS One. 2013;8(11):e79688. doi:10.1371/journal.pone.0079688
4. Ritchie HK, Burke TM, Dear TB, Mchill AW, Axelsson J, Wright KPJ. Impact of sleep inertia on visual selective attention for rare targets and the influence of chronotype. J Sleep Res. 2017;26(5):551–558. doi:10.1111/jsr.12525
5. Burke TM, Scheer FAJL, Ronda JM, Czeisler CA, Wright KP. Sleep inertia, sleep homeostatic and circadian influences on higher-order cognitive functions. J Sleep Res. 2015;24(4):364–371. doi:10.1111/jsr.12291
6. Naitoh P, Kelly T, Babkoff H. Sleep inertia: best time not to wake up? Chronobiol Int. 1993;10(2):109–118.
7. Tassi P, Nicolas A, Dewasmes G, et al. Effects of noise on sleep inertia as a function of circadian placement of a one-hour nap. Percept Mot Skills. 1992;75(1):291–302. doi:10.2466/pms.1992.75.1.291
8. Jewett ME, Wyatt JK, Ritz-De Cecco A, Khalsa SB, Dijk DJ, Czeisler CA. Time course of sleep inertia dissipation in human performance and alertness. J Sleep Res. 1999;8(1):1–8.
9. van de Werken M, Giménez MC, de Vries B, Beersma DG, van Someren EJ, Gordijn MC. Effects of artificial dawn on sleep inertia, skin temperature, and the awakening cortisol response. J Sleep Res. 2010;19(3):425–435. doi:10.1111/j.1365-2869.2010.00828.x
10. Gabel V, Maire M, Reichert CF, et al. Effects of artificial dawn and morning blue light on daytime cognitive performance, well-being, cortisol and melatonin levels. Chronobiol Int. 2013;30(8):988–997. doi:10.3109/07420528.2013.793196
11. Selmaoui B, Touitou Y. Reproducibility of the circadian rhythms of serum cortisol and melatonin in healthy subjects: a study of three different 24-h cycles over six weeks. Life Sci. 2003;73(26):3339–3349.
12. Geoffriau M, Brun J, Chazot G, Claustrat B. The physiology and pharmacology of melatonin in humans. Horm Res. 1998;49(3–4):136–141. doi:10.1159/000023160
13. Figueiro MG, Rea MS. Sleep opportunities and periodic light exposures: impact on biomarkers, performance and sleepiness. Light Res Technol. 2011;43(3):349–369. doi:10.1177/1477153511404175
14. Appleman K, Figueiro MG, Rea MS. Controlling light-dark exposure patterns rather than sleep schedules determines circadian phase. Sleep Med. 2013;14(5):456–461. doi:10.1016/j.sleep.2012.12.011
15. Figueiro MG, Plitnick B, Rea MS. The effects of chronotype, sleep schedule and light/dark pattern exposures on circadian phase. Sleep Med. 2014;15(12):1554–1564. doi:10.1016/j.sleep.2014.07.009
16. Figueiro MG, Bullough JD, Bierman A, Fay CR, Rea MS. On light as an alerting stimulus at night. Acta Neurobiol Exp (Warsz). 2007;67(2):171–178.
17. Sahin L, Figueiro MG. Alerting effects of short-wavelength (blue) and long-wavelength (red) lights in the afternoon. Physiol Behav. 2013;116–117:1–7. doi:10.1016/j.physbeh.2013.03.014
18. Figueiro MG, Sahin L, Wood B, Plitnick B. Light at night and measures of alertness and performance: implications for shift workers. Biol Res Nurs. 2016;18(1):90–100. doi:10.1177/1099800415572873
19. Young CR, Jones GE, Figueiro MG, et al. At-sea trial of 24-h-based submarine watchstanding schedules with high and low correlated color temperature light source. J Biol Rhythms. 2015;30(2):144–154. doi:10.1177/0748730415575432
20. Figueiro MG, Bierman A, Plitnick B, Rea MS. Preliminary evidence that both blue and red light can induce alertness at night. BMC Neurosci. 2009;10:105. doi:10.1186/1471-2202-10-105
21. Stevens RG, Rea MS. Light in the built environment: potential role of circadian disruption in endocrine disruption and breast cancer. Cancer Causes Control. 2001;12(3):279–287.
22. Figueiro MG, Rea MS. The effects of red and blue lights on circadian variations in cortisol, alpha amylase, and melatonin. Int J Endocrinol. 2010;2010:829351. doi:10.1155/2010/829351
23. Thompson A, Jones H, Gregson W, Atkinson G. Effects of dawn simulation on markers of sleep inertia and post-waking performance in humans. Eur J Appl Physiol. 2014;114(5):1049–1056. doi:10.1007/s00421-014-2831-z
24. Avery DH, Bolte MAP, Wolfson JK, Kazaras AL. Dawn simulation compared with a dim red signal in the treatment of winter depression. Biol Psychiatry. 1994;36(3):181–188. doi:10.1016/0006-3223(94)91223-8
25. Bierman A, Figueiro MG, Rea MS. Measuring and predicting eyelid spectral transmittance. J Biomed Optics. 2011;16(6):067011. doi:10.1117/1.3593151
26.
27. Åkerstedt T, Gillberg M. Subjective and objective sleepiness in the active individual. Int J Neurosci. 1990;52(1–2):29–37.
28. Gomez P, Ratcliff R, Perea M. A model of the go/no-go task. J Exp Psychol Gen. 2009;136(3):389–413. doi:10.1037/0096-3445.136.3.389
29. Lim J, Dinges DF. Sleep deprivation and vigilant attention. Ann N Y Acad Sci. 2008;1129(1):305–322. doi:10.1196/annals.1417.002
30. Welford AT. Choice reaction time: basic concepts. In: Welford AT, editor. Reaction Times. New York: Academic Press; 1980:73–128.
31. Basner M, Dinges DF. Maximizing sensitivity of the psychomotor vigilance test (PVT) to sleep loss. Sleep. 2011;34(5):581–591.
32. Sallinen M, Härmä M, Åkerstedt T, Rosa R, Lillqvist O. Promoting alertness with a short nap during a night shift. J Sleep Res. 1998;7(4):240–247.
33. Giménez M, Hessels M, van de Werken M, de Vries B, Beersma DG, Gordijn M. Effects of artificial dawn on subjective ratings of sleep inertia and dim light melatonin onset. Chronobiol Int. 2010;27(6):1219–1241. doi:10.3109/07420528.2010.496912
34. Hayashi M, Masuda A, Hori T. The alerting effects of caffeine, bright light and face washing after a short daytime nap. Clin Neurophysiol. 2003;114(12):2268–2278.
35. Hilditch CJ, Dorrian J, Banks S. Time to wake up: reactive countermeasures to sleep inertia. Ind Health. 2016;54(6):528–541. doi:10.2486/indhealth.2015-0236
36. Figueiro MG, Rea MS. Preliminary evidence that light through the eyelids can suppress melatonin and phase shift dim light melatonin onset. BMC Res Notes. 2012;5(1):221. doi:10.1186/1756-0500-5-221
37. Figueiro MG, Plitnick B, Rea MS. Pulsing blue light through closed eyelids: effects on phase shifting of dim light melatonin onset in older adults living in a home setting. Nat Sci Sleep. 2014;6:149–156. doi:10.2147/NSS.S73856
38. Figueiro MG. Individually tailored light intervention through closed eyelids to promote circadian alignment and sleep health. Sleep Health. 2015;1(1):75–82. doi:10.1016/j.sleh.2014.12.009
 © 2019 The Author(s). This work is published and licensed by Dove Medical Press Limited. The
full terms of this license are available at https://www.dovepress.com/terms
and incorporate the Creative Commons Attribution
- Non Commercial (unported, 3.0) License.
By accessing the work you hereby accept the Terms. Non-commercial uses of the work are permitted
without any further permission from Dove Medical Press Limited, provided the work is properly
attributed. For permission for commercial use of this work, please see paragraphs 4.2 and 5 of our Terms.
© 2019 The Author(s). This work is published and licensed by Dove Medical Press Limited. The
full terms of this license are available at https://www.dovepress.com/terms
and incorporate the Creative Commons Attribution
- Non Commercial (unported, 3.0) License.
By accessing the work you hereby accept the Terms. Non-commercial uses of the work are permitted
without any further permission from Dove Medical Press Limited, provided the work is properly
attributed. For permission for commercial use of this work, please see paragraphs 4.2 and 5 of our Terms.