")
Back to Journals » Diabetes, Metabolic Syndrome and Obesity » Volume 16
Effects of NKT Cells on Metabolic Disorders Caused by High-Fat Diet Using CD1d-Knockout Mice
Authors Ishikawa H , Nagashima R, Kuno Y, Sasaki H, Kohda C, Iyoda M
Received 29 June 2023
Accepted for publication 14 September 2023
Published 19 September 2023 Volume 2023:16 Pages 2855—2864
DOI https://doi.org/10.2147/DMSO.S428190
Checked for plagiarism Yes
Review by Single anonymous peer review
Peer reviewer comments 2
Editor who approved publication: Professor Gian Paolo Fadini
Hiroki Ishikawa,1 Ryuichi Nagashima,1 Yoshihiro Kuno,1,2 Hiraku Sasaki,3 Chikara Kohda,1 Masayuki Iyoda1,2
1Department of Microbiology and Immunology, Showa University School of Medicine, Tokyo, 142-8555, Japan; 2Division of Nephrology, Department of Medicine, Showa University School of Medicine, Tokyo, 142-8666, Japan; 3Department of Health Science, Faculty of Health and Sports Science, Juntendo University, Inzai, Chiba, 270-1695, Japan
Correspondence: Hiroki Ishikawa, Department of Microbiology and Immunology, Showa University School of Medicine, 1-5-8 Hatanodai, Shinagawa-ku, Tokyo, 142-8555, Japan, Tel +81-3-3784-8131, Fax +81-3-3784-3069, Email [email protected]
Purpose: The purpose of this study was to investigate whether NKT cells play an important role in preventing or exacerbating diseases caused by high-fat diet (HFD) using CD1d-knockout (KO) mice which lack NKT cells.
Methods: Five-week-old male Balb/c (wild-type; WT) or CD1dKO mice were fed with control-diet (CTD) or HFD for 16 weeks.
Results: The present study revealed four main findings. First, CD1dKO mice were susceptible to obesity caused by HFD in comparison to WT mice. Second, clinical conditions of fatty liver caused by HFD were comparable between CD1dKO mice and WT mice. Third, HFD-fed WT mice showed high levels of serum biochemical markers, involved in lipid metabolisms, in comparison to WT mice fed a CTD. Notably, the serum concentrations of ALT, T-CHO, TG and HDL-C in CD1dKO mice fed a HFD were almost comparable to those of CD1dKO mice fed a CTD. Fourth, the expression of peroxisome proliferator-activated receptor (PPAR) γ, low-density lipoprotein receptor (LDLR), CD36 of epididymal adipose tissue enhanced and proprotein convertase subtilisin/kexin type (PCSK) 9 in serum decreased.
Conclusion: NKT cells were responsible for protection against HFD-induced obesity. However, CD1dKO mice were resistant to serum biochemical marker abnormalities after HFD feeding. One possible explanation is that the epididymal adipose tissue of CD1dKO mice could take up greater amounts of excess lipids in serum in comparison to WT mice.
Keywords: NKT cells, high-fat diet, obesity, serum biochemical markers, adipose tissue
Introduction
The incidence of obesity caused by excessive consumption, including a high-fat diet (HFD), has been exponentially increasing over the past 30–50 years in not only developed countries but also developing countries and is becoming an important global problem.1 Diseases caused by overnutrition are associated with metabolic syndrome, including obesity, hyperlipidemia and hyperglycemia. Thus, metabolic syndrome is a risk factor for the development of type 2 diabetes, fatty liver disease, coronary heart diseases and various other diseases resulting in chronic health problems and death.2–4
Natural killer T (NKT) cells are a bridge between innate immunity and adaptive immune system.5,6 NKT cells present in various peripheral organs, especially, the liver where they represent 30–50% of the total liver lymphocytes in a steady state,7,8 and in murine adipose tissues, where they represent 10–25% of adipose T cells, or 2–8% of all adipose lymphocytes.9–11 NKT cells in adipose tissue are a unique subset of NKT cells that produce IL-10 and IL-4, as anti-inflammatory cytokines, rather than IFN-γ,12–14 and prevent the development of an inflammatory environment. Furthermore, CD1d molecules, which can present α-galactosylceramide to activate NKT cells, express not only professional antigen-presenting cells but also hepatocytes and adipocytes.9,10,15 Therefore, CD1d expressing cells, including hepatocytes and adipose tissue, can directly interact with NKT cells. However, whether NKT cells are associated with the exacerbation or prevention of diseases caused by a HFD is still controversial.16,17
Recently, it has reported that the number of NKT cell in adipose tissue is reduced in mice with obesity caused by HFD feeding in comparison to lean mice and that the reduction is similar to the reduction in the number of NKT cell observed in obese human patients in comparison to age-matched lean controls.9,18 On the other hand, adoptive transfer of NKT cells induced the body weight loss in mice with obesity caused by diet in NKT-deficient mice as well as in ob/ob mice.9,19 The administration of α-galactosylceramide to activate NKT cells in obese WT mice also reduced the body weight increase caused by HFD feeding.9,14 Thus, we hypothesized that NKT cells can regulate the body weight of mice with diet-induced obesity and improve obesity-related disorders resulting in the maintenance of metabolic homeostasis. To investigate the effects of NKT cells on obese mice, CD1dKO mice, which lack NKT cells because of impairment of NKT cell development in the thymus,20–22 were used. Mice were fed for 16 weeks with a CTD or a HFD to induce obesity. The effects of NKT cells on metabolic disorders caused by HFD feeding were investigated.
Materials and Methods
Mice and Their Diets
For wild-type (WT) mice, 5-week-old male Balb/c mice were purchased from Oriental Yeast Co., Ltd. (Tokyo, Japan). CD1d-knockout (KO) mice, bred on a Balb/c background, were bred in our experimental animal facility (protocol No. BM4-112); male mice of the same age as the WT mice were used in the present study. All mice were housed under specific pathogen-free conditions according to the animal protocol guidelines of the Institutional Animal Care and Use Committee of Showa University (protocol No. 03041, 04007 and 05011). A high-fat diet (HFD) (Cat# D12492) and a control diet (CTD) of equivalent caloric content to the HFD (Cat# D12450J) were purchased from Research Diet Inc. (NJ, USA). Mice were given ad libitum access to the diet for 16 weeks. Mice were fasted for 18 h before sacrifice. The weights of the mice were measured at every week. The weight of each mouse on week 0 was considered to be 100%.
Serum and Histopathology of the Liver Tissue
For the histopathological examination of the liver, WT mice or CD1dKO mice fed for 16 weeks with a CTD or HFD were sacrificed under CO2 gas inhalation after fasting for 18 h. Blood was collected from the heart and centrifuged to obtain the serum. The serum was frozen until measurement of biochemical marker levels. After blood sampling, the left lobe of livers was removed for histopathology from each mouse. Tissues were directly embedded in OTC compound (Sakura Finetek Japan Co., Ltd., Tokyo, Japan) and quickly frozen for histological examination. The frozen OTC-embedded tissues were cut into sections with a microtome and then stained with oil red O at Soshiki Kagaku, Lab. Inc. (Kanagawa, Japan). The histology was evaluated by a pathologist.
Purification of mRNA from Liver and Adipose Tissue
At the time of removing the left lobe of the liver for histopathological examination, the right lobe of liver and both of the epididymal adipose tissues were removed from each mouse. After measurement of the epididymal adipose tissue weight, the tissues were homogenized in bead-based tissue homogenizer using MagNA Lyser Green Beads (Roche Diagnostics, Mannheim, Germany) and Micro Smash™ (TOMY Seiko Co. Ltd., Tokyo, Japan). Total RNA from the liver or the epididymal adipose tissue was purified using an RNeasy® Mini kit (Qiagen, Hilden, Germany) or RNeasy® Lipid Tissue Mini kit (Qiagen), respectively, according to the manufacturer’s protocol.23
Synthesis of Complementary DNA (cDNA) and Quantitative Real-Time Polymerase Chain Reaction (PCR)
cDNA derived from RNA was synthesized using QuantiTect® Reverse Transcription (Qiagen), according to the manufacturer’s instructions. The probes and primers for quantitative real-time PCR were TaqMan gene expression assays for mouse IL-1β (Assay ID: Mm00434228_m1), mouse IL-6 (Assay ID: Mm00446190_m1), mouse TNF-α (Assay ID: Mm00443258_m1), mouse COL1A1 (Assay ID: Mm00801666_g1), mouse peroxisome proliferator-activated receptor (PPAR) α (Assay ID: Mm00440939_m1), mouse PPARγ (Assay ID: Mm00440940_m1), mouse LDLR (Assay ID: 01177349_m1), mouse CD36 (Assay ID: Mm00432403_m1) and mouse GAPDH (Assay ID: Mm99999915_g1) (Thermo Fisher Scientific, MA, USA). Quantitative real-time PCR was performed using a LightCycler 480 probe Master and LightCycler 480 instrument with the included software program (Roche Diagnostics). Each sample was calibrated to GAPDH as the internal standard and normalized to the average value of control samples using ΔΔCT method.
Serum Biochemistry
The alanine amino transferase (ALT), total cholesterol (T-CHO), triglyceride (TG), low-density lipoprotein cholesterol (LDL-C), high-density lipoprotein cholesterol (HDL-C) and glucose levels in serum were measured at Oriental Yeast Co., Ltd. (Tokyo. Japan). In brief, the serum ALT, T-CHO and TG levels were determined by an enzymatic assay, the concentrations of LDL-C and HDL-C were measured by a direct assay, and the serum glucose levels were determined by a HK-G6PDH assay.
Measurement of the Serum Proprotein Convertase Subtilisin/Kexin Type 9 (PCSK9) Concentration by ELISA
Serum levels of PCSK9 were measured using CircuLex mouse/rat PCSK9 ELISA kit (MBL, CA, USA) according to the manufacturer’s protocol.
Statistical Analyses
Statistical analyses were performed using the Microsoft Excel software program (Microsoft, WA, USA). The statistical significance of the findings was calculated using the unpaired t-test for all experimental analyses. P-values of <0.05 were considered to indicate statistical significance. All values are presented as the mean ± standard deviation (S.D.).
Results
HFD Feeding Caused a Greater Increase in Body Weight Gain in CD1dKO Mice in Comparison to WT Mice
First, as shown in Figure 1A, the body weight of mice fed a HFD significantly increased in comparison to that of mice fed a CTD in both WT mice and CD1dKO mice from week 1 to week 16. Furthermore, the body weight of CD1dKO mice fed a HFD was significantly higher than that of WT mice fed a HFD from week 10 to week 16 and the body weight gain of WT mice fed a HFD leveled off from week 8 to week 16. On the other hand, the body weight gain of both WT mice and CD1dKO mice fed a CTD was comparable. Also, when fed a HFD, the body weight gain (in grams) of both mouse strains significantly increased in comparison to mice fed a CTD (Figure 1B). The body weight gain (in grams) of CD1dKO mice fed a HFD was significantly higher than that of WT mice fed a HFD for 16 weeks and the body weight gain (in grams) of CD1dKO mice represented an almost 150% increase in comparison to that of WT mice. Moreover, the epididymal adipose tissue index (Figure 1C) and epididymal adipose tissue gain (in grams) (Figure 1D) at 16 weeks showed results that were in line with the indicated body weight gain. Of note, 10% of the body weight gain (in grams) with HFD feeding was attributed to the epididymal adipose tissue gain (in grams). In other words, the epididymal adipose tissue gain (in grams) of CD1dKO mice also represented an almost 150% increase in comparison to that of WT mice.
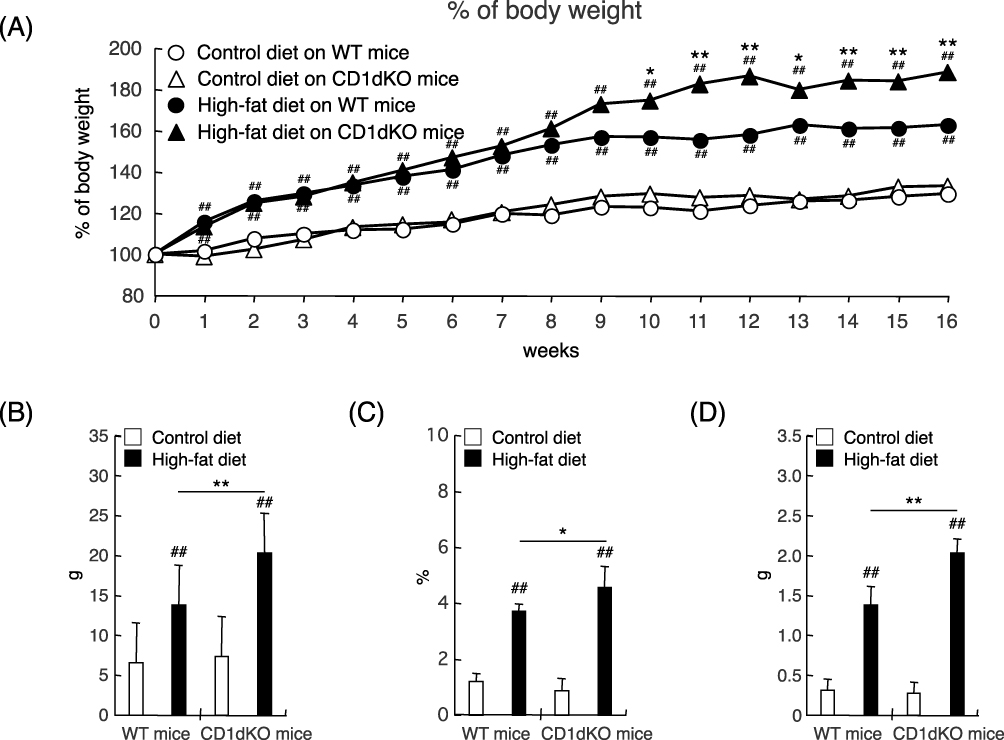 |
Figure 1 Body weight curve and epididymal adipose tissue volume after 16 weeks of CTD or HFD feeding. Mice were fed a CTD or HFD for 16 weeks. The body weights of mice were monitored every week (A). The body weight gain (in grams) of mice was measured at 16 weeks (B). The epididymal adipose tissue index of mice at 16 weeks (C). The epididymal adipose tissue gain (in grams) of mice was measured at 16 weeks (D). Five to six mice were evaluated per group. ##p<0.01 in comparison to the CTD-fed mouse group of the same mouse strain on the same day. **p<0.01, *p<0.05 in comparison to the HFD-fed mouse group, between WT mice and CD1dKO mice on the same day. |
HFD Feeding Caused Fatty Liver, Inflammation, and Liver Fibrosis in Both Mouse Strains
Next, we evaluated whether or not HFD feeding affects the liver condition in both mouse strains. At 16 weeks, as shown in Figure 2A, both strains of mice demonstrably showed positive of oil red O staining after HFD feeding but not after CTD feeding. These results demonstrated that HFD feeding for 16 weeks caused fatty liver in both of mouse strains. Consistent with these pathologic results, in both strains of mice, HFD feeding was associated with a tendency toward increased mRNA expression levels of liver inflammation and fibrosis markers (eg, IL-1β, IL-6, TNF-α and COL1A1) in comparison to CTD feeding (Figure 2B), although these differences were not statistically significant. These results indicated that HFD feeding caused comparable levels of fatty liver, inflammation, and liver fibrosis in WT and CD1dKO mice.
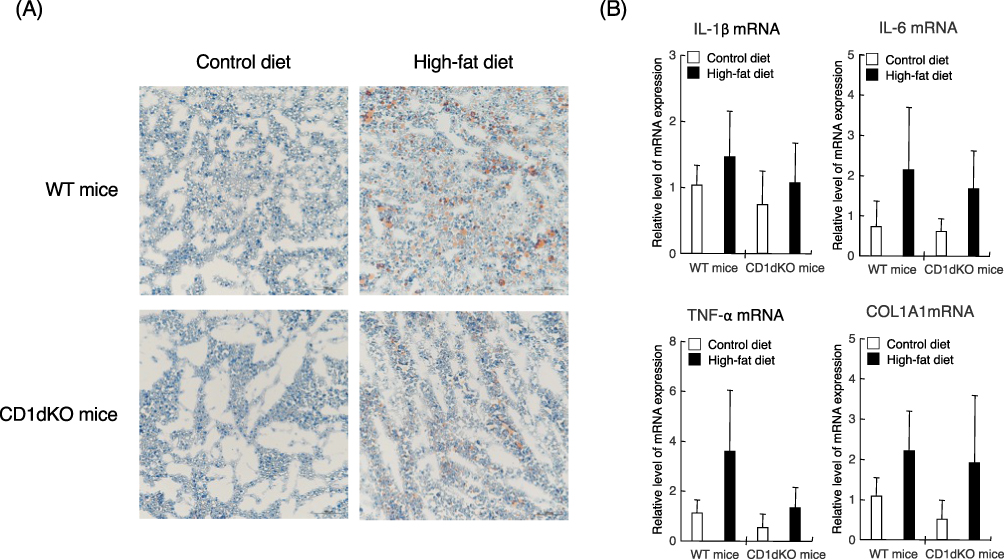 |
Figure 2 Liver histology by oil red O staining and the mRNA expression levels of inflammation and fibrosis markers in the liver after 16 weeks of CTD or HFD feeding. Mice were fed a CTD or HFD for 16 weeks. Liver tissue was stained with oil red O. Observation was performed under at 200-fold magnification (A). Representative images of each liver sections are shown. The mRNA expression level of each marker was determined by quantitative real-time PCR. Five to six mice were used per group (B). |
HFD Feeding Caused Deterioration of Serum Biological Markers of WT Mice, but Not CD1dKO Mice
To determine whether or not HFD feeding affects serum biological markers, serum was collected from each mouse after feeding for 16 weeks (Figure 3). After 16 weeks of feeding with a HFD or CTD, in both strains of mice, the serum levels of ALT were significantly increased in mice fed a HFD in comparison to those fed a CTD. However, following HFD feeding, the serum ALT level of CD1dKO mice was significantly lower than that of WT mice. Even more surprising, after 16 weeks of HFD feeding, the serum levels of T-CHO, TG and HDL-C in CD1dKO mice were significantly decreased in comparison to WT mice. The decrease in the levels of these biological markers of CD1dKO mice after HFD feeding was the same as that observed in CD1dKO mice fed a CTD. On the other hand, after HFD feeding, the serum glucose concentrations were significantly increased in comparison to those after CTD in both strains of mice, and the level of increase in the serum glucose concentration in the two mice strains was comparable. These results suggest that the lipid metabolism ability, but not the glucose metabolism ability, may differ between CD1dKO mice and WT mice.
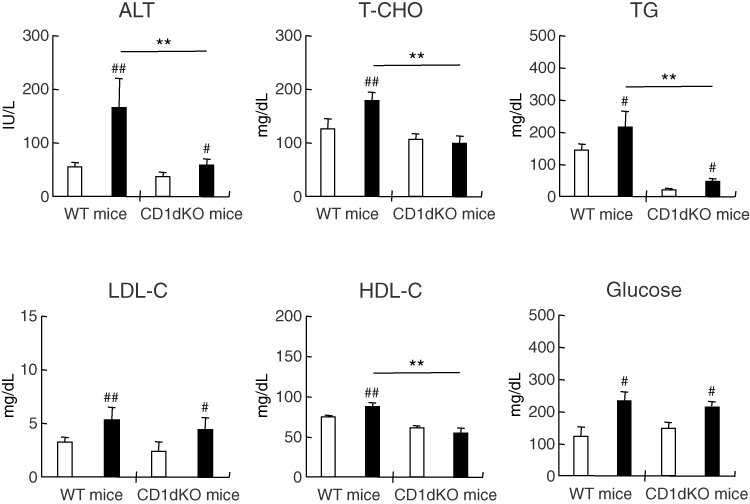 |
Figure 3 Serum biologic markers of mice after 16 weeks of CTD or HFD feeding. Mice were fed a CTD or HFD for 16 weeks. Serum was collected from mice after fasting for 18 h. Five to six mice were used per group. □; CTD-fed group, ■; HFD-fed group. ##p<0.01, #p<0.05 in comparison to the CTD-fed mouse group of the same mouse strain. **p<0.01 in comparison to the HFD-fed mouse group, between WT mice and CD1dKO mice. |
Epididymal Adipose Tissue of CD1dKO Mice Showed Increased Lipid Uptake After HFD Feeding
Because normal serum levels of biological markers and increased epididymal adipose tissue gain (in grams) were observed after HFD feeding in CD1dKO mice in comparison to WT mice, we hypothesized that the epididymal adipose tissue may be involved in the accumulation of excess lipids in the serum in CD1dKO mice. First, as shown in Figure 4A, after HFD feeding for 16 weeks, the PPARα, LDLR and CD36 mRNA expression in the liver of WT mice was significantly increased in comparison to WT mice fed a CTD. Furthermore, the increase in the PPARα and LDLR mRNA expression in WT mice fed a HFD was also significantly enhanced in comparison to CD1dKO mice fed a HFD. On the other hand, after HFD feeding, the mRNA expression of PPARγ in the epididymal adipose tissue was significantly higher in comparison to mice fed a CTD in both mouse strains (Figure 4B). Furthermore, at 16 weeks, the mRNA expression of PPARγ, LDLR and CD36 in CD1dKO mice fed a HFD was significantly increased in comparison to WT mice fed a HFD. The LDLR and CD36 mRNA expression of WT mice fed a HFD were not shown any more enhancement by HFD feeding in comparison to WT mice fed a CTD. These results suggested that the epididymal adipose tissue of CD1dKO mice may afford the accumulation of excess lipids in serum at 16 weeks. On the other hand, the epididymal adipose tissue of WT mice may limit the uptake of excess lipids in serum.
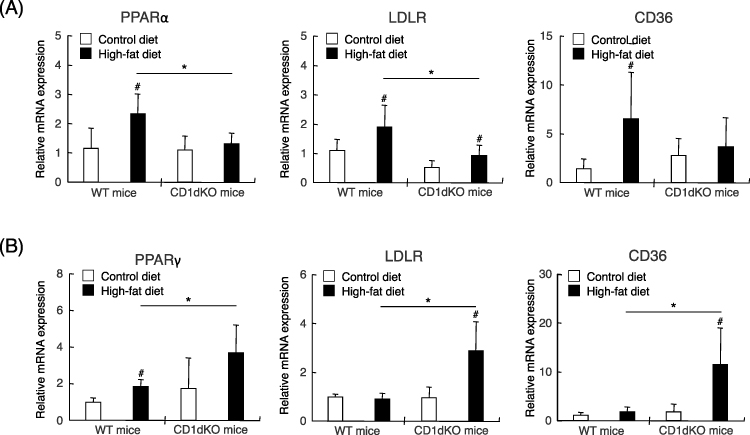 |
Figure 4 The mRNA expression of markers of lipid accumulation after 16 weeks of CTD or HFD feeding. Mice were fed a CTD or HFD for 16 weeks. The mRNA expression level of each marker was determined by quantitative real-time PCR for the liver (A) and the epididymal adipose tissue (B). Five to six mice were used per group. #p<0.05 in comparison to the CTD-fed mouse group of the same mouse strain. *p<0.05 in comparison to the HFD-fed mouse group, between WT mice and CD1dKO mice. |
Serum Levels of PCSK9 in CD1dKO Mice Were Significantly Lower in Comparison to WT Mice, Regardless of CTD or HFD Feeding
As it has been reported that PCSK9 promotes the degradation of LDLR on cells leading to an increase in excess serum lipids and that PCSK9 inhibitor treatment can reduce excess serum lipids including T-CHO, TG and LDL-C,24 the serum level of PCSK9 was measured at 16 weeks. As shown in Figure 5, the serum level of PCSK9 in CD1dKO mice was significantly decreased to approximately 60% in comparison to WT mice, irrespective of whether mice were fed a CTD or HFD, suggesting that the LDLR of CD1dKO mice may be protected from degradation by PCSK9.
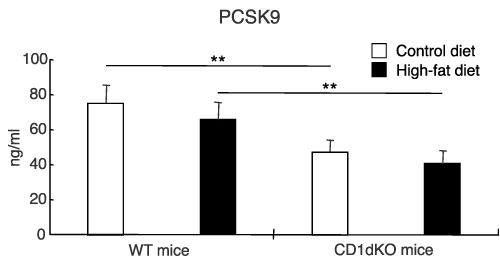 |
Figure 5 Serum level of PCSK9 after 16 weeks of CTD or HFD feeding. Mice were fed a CTD or HFD for 16 weeks. The serum level of PCSK9 was measured by ELISA. Five to six mice were used per group. **p<0.01 in comparison to the CTD- or HFD-fed mouse group, between WT mice and CD1dKO mice. |
Discussion
In the present study, we evaluated whether or not HFD feeding affects the progression of metabolic diseases in CD1dKO mice in comparison to WT mice, because controversy remains in relation to the clinical conditions caused by HFD feeding, such as obesity, dyslipidemia, type 2 diabetes and non-alcoholic fatty liver in CD1dKO mice in comparison to WT mice.16,17 Some studies reported that preventive effects against the progression of liver diseases caused by HFD feeding were observed in CD1dKO mice.25,26 In contrast, opposite results that clinical condition caused by HFD feeding in CD1dKO mice showed greater deterioration in comparison to WT mice have been reported,9 suggesting that NKT cells have effects on HFD-induced obesity and metabolic disorders.
In this study, we showed that with HFD feeding, the body weight gain or adipose tissue weight volume of CD1dKO mice were significantly increased in comparison to WT mice from week 10 to week 16 and at 16 weeks, respectively, suggesting that CD1dKO mice are more susceptible to HFD-induced obesity. Our observations in the present study are consistent with some reports that investigated HFD-induced obesity in CD1dKO mice. It has been reported that body weight gain and adipose tissue weight of CD1dKO mice fed a HFD were significantly increased from week 12 to week 20 and at 14 and 20 weeks, respectively, but not at 8 weeks, in comparison to WT mice fed a HFD.8 On the other hand, some reports demonstrated that, with HFD feeding, the body weight gain of mice lacking NKT cells was comparable to that of WT mice, because Jα18KO mice or CD1dKO mice were only fed a HFD for 5 weeks or 8 weeks, respectively.27,28 The significant increase in body weight gain and adipose tissue weight observed after HFD feeding in CD1dKO mice, in comparison to WT mice, may be dependent on long-term HFD feeding for at least 10 weeks, and the different durations of feeding may account for these differences in results. It has been also reported that the adoptive transfer of NKT cells into HFD-induced obese mice caused the reduction of body weight and of epididymal adipose tissue weight.9,29 Furthermore, in vivo activation of NKT cells with α-galactosylceramide in obese mice induced a decrease in body weight and adipose tissue weight and improved metabolic outcomes following the induction of regulatory T cells in adipose tissues.9,11,14,30 The administration of α-galactosylceramide to obese mice induced an increase in body temperature and to decrease in the respiratory exchange ratio, leading to decreased body weight and adipose tissue weight.31 Mechanistically, NKT cell activation-induced thermogenesis was partially mediated through adipocyte-produced fibroblast growth factor 21 (FGF21), which has been shown to improve metabolic disease and induce body weight loss.31,32 These reports may support our finding that CD1dKO mice were more susceptible to HFD-induced obesity than WT mice. As another possible explanation for the difference in susceptibility to HFD-induced obesity, Martin-Murphy et al indicated that CD1dKO mice showed increased average daily HFD-food intake and decreased average physical activity in comparison to WT mice during an experiment,8 because HFD feeding affects the hypothalamus function and it may be associated with different behavior in WT mice and CD1dKO mice.33
The clinical conditions of fatty liver caused by HFD feeding, such as lipid accumulation, inflammation and fibrosis, were comparable between CD1dKO mice and WT mice in our study, suggesting that NKT cells are not involved in the progression of liver diseases caused by HFD feeding. However, after HFD feeding, obvious differences in serum biological markers were observed between CD1dKO mice and WT mice. In fact, high levels of serum biological markers caused by HFD feeding, including ALT, T-CHO, TG and HDL-C, were detected in WT mice. On the other hand, remarkably, high concentrations of serum biological markers were not observed in CD1dKO mice fed a HFD, and the biological marker levels measured after HFD feeding in CD1dKO mice were almost the same as those of CD1dKO mice after CTD feeding. Similar results, regarding serum biochemical markers, were reported by Bhattacharjee et al, who showed that liver concentrations of TG and ALT levels in WT mice fed a HFD for 16 weeks were significantly higher than those of WT mice fed a CTD. In addition, the liver levels of TG and serum levels of ALT observed in CD1dKO mice after HFD feeding were comparable to those of CD1dKO mice after CTD feeding,34 however, the mechanisms through which the serum biological markers of CD1dKO mice remained at normal levels after HFD feeding were not described in their study. One possible mechanism may be involved the reinforced uptake of excess lipids in serum by epididymal adipose tissue. We demonstrated that the epididymal adipose tissue weights of CD1dKO mice fed a HFD were significantly increased in comparison to those of WT mice fed a HFD and that the body weight gain of WT mice fed a HFD leveled off from week 8 to week 16, suggesting that the adipose tissues of WT mice fed a HFD may be not able to accumulate any more excess lipids from the serum. Brailey et al also showed that CD1d-deficient macrophages exhibit an increased exogenous lipid import through CD36 compared with WT-macrophage.35 Furthermore, the mRNA expression of PPARγ in adipocytes, which induces to the uptake of excess lipids in serum and the storages of energy by lipogenesis,36,37 was significantly higher in the epididymal adipose tissue of CD1dKO mice fed a HFD in comparison to WT mice fed a HFD. The increased mRNA expression of PPARγ in epididymal adipose tissue leads to the upregulation of genes associated with lipid uptake, including LDLR and CD36, in CD1dKO mice. As a result, normal serum levels of biochemical markers are maintained. In fact, the targeted deletion of PPARγ in the adipose tissue of mice resulted in elevated plasma levels of lipids, including free fatty acids and triglyceride.38 In addition, serum levels of PCSK9, which is involved in promoting the degradation of LDLR, in CD1dKO mice, were significantly lower than those in WT mice, irrespective of whether the mice were fed a CTD or HFD. These results suggest that the epididymal adipose tissue in CD1dKO mice was able to take up greater amounts of excess lipids in serum in comparison to WT mice; however, the mechanisms through which the increased expression of PPARγ in adipose tissue and the decreased of PCSK9 in serum are induced in CD1dKO mice fed a HFD remain unclear. Possibly, effects of NKT cells in improvement of high levels of serum biological markers caused by HFD feeding may result from assembling of small multiple mechanisms, although detail mechanisms of NKT cells are still unknown in the present study. When the detail mechanisms of NKT cells would be revealed in future studies, new therapeutic strategies for the clinical conditions caused by HFD will be exploited.
Conclusion
We demonstrated that body weight gain and the adipose tissue weight increase of CD1dKO mice fed a HFD were significantly higher in comparison to WT mice fed a HFD. On the other hand, the serum biological markers of CD1dKO mice fed a HFD remained at normal levels, while those of WT mice fed a HFD did not, although the exact mechanism through which the lipid uptake by adipose tissue is regulated in CD1dKO mice fed a HFD remains unknown. Furthermore, reports from other authors about the effects of NKT cells on HFD-induced obesity are controversial and some of their findings conflict with our own. Moreover, the effects of the CD1d molecule on lipid metabolism are not clear. Therefore, further studies are needed to elucidate the precise mechanisms and interaction among NKT cells, CD1d molecules and adipose tissue in HFD-induced obesity.
Abbreviations
NKT, natural killer T; HFD, high-fat diet; CTD, control-diet; ALT, alanine amino transferase; T-CHO, total cholesterol; TG, triglyceride; HDL-C, high-density lipoprotein cholesterol; LDL-C, low-density lipoprotein cholesterol; LDLR, low-density lipoprotein receptor; PPARγ, peroxisome proliferator-activated receptor γ; PCSK9, proprotein convertase subtilisin/kexin type 9.
Acknowledgments
This work was supported in part by JSPS KAKENHI Grant number 20K08846 (to H.I.), 22K08338 (R.N.), 21K08287 (to Y.K.), 22K09553 (to C.K.), 22K11786 (to H.S.) and 22K08339 (M.I.).
Disclosure
The authors declare no conflicts of interest in association with the present study.
References
1. Morris MJ, Beilharz JE, Maniam J, Reichelt AC, Westbrook RF. Why is obesity such a problem in the 21st century? The intersection of palatable food, cues and reward pathways, stress, and cognition. Neurosci Biobehav Rev. 2015;58:36–45. doi:10.1016/j.neubiorev.2014.12.002
2. Tanaka K, Nakanishi T. Obesity as a risk factor for various diseases: necessity of lifestyle changes for healthy aging. Appl Human Sci. 1996;15(4):139–148. doi:10.2114/jpa.15.139
3. Esser N, Legrand-Poels S, Piette J, Scheen AJ, Paquot N. Inflammation as a link between obesity, metabolic syndrome and type 2 diabetes. Diabetes Res Clin Pract. 2014;105(2):141–150. doi:10.1016/j.diabres.2014.04.006
4. Fahed G, Aoun L, Bou Zerdan M, et al. Metabolic syndrome: updates on pathophysiology and management in 2021. Int J Mol Sci. 2022;23(2):786. doi:10.3390/ijms23020786
5. Brigl M, Bry L, Kent SC, Gumperz JE, Brenner MB. Mechanism of CD1d-restricted natural killer T cell activation during microbial infection. Nat Immunol. 2003;4(12):1230–1237. doi:10.1038/ni1002
6. Zeissig S, Blumberg RS. Primary immunodeficiency associated with defects in CD1 and CD1-restricted T cells. Ann N Y Acad Sci. 2012;1250(1):14–24. doi:10.1111/j.1749-6632.2011.06380.x
7. Gao B, Radaeva S, Park O. Liver natural killer and natural killer T cells: immunobiology and emerging roles in liver diseases. J Leukoc Biol. 2009;86(3):513–528. doi:10.1189/JLB.0309135
8. Martin-Murphy BV, You Q, Wang H, et al. Mice lacking natural killer T cells are more susceptible to metabolic alterations following high fat diet feeding. PLoS One. 2014;9(1):e80949. doi:10.1371/journal.pone.0080949
9. Lynch L, Nowak M, Varghese B, et al. Adipose tissue invariant NKT cells protect against diet-induced obesity and metabolic disorder through regulatory cytokine production. Immunity. 2012;37(3):574–587. doi:10.1016/j.immuni.2012.06.016
10. Schipper HS, Rakhshandehroo M, van de Graaf SF, et al. Natural killer T cells in adipose tissue prevent insulin resistance. J Clin Invest. 2012;122(9):3343–3354. doi:10.1172/JCI62739
11. Huh JY, Kim JI, Park YJ, et al. A novel function of adipocytes in lipid antigen presentation to iNKT cells. Mol Cell Biol. 2013;33(2):328–339. doi:10.1128/MCB.00552-12
12. Kane H, Lynch L. Innate Immune Control of Adipose Tissue Homeostasis. Trends Immunol. 2019;40(9):857–872. doi:10.1016/j.it.2019.07.006
13. Lynch L. Adipose invariant natural killer T cells. Immunology. 2014;142(3):337–346. doi:10.1111/imm.12269
14. Ji Y, Sun S, Xu A, et al. Activation of natural killer T cells promotes M2 Macrophage polarization in adipose tissue and improves systemic glucose tolerance via interleukin-4 (IL-4)/STAT6 protein signaling axis in obesity. J Biol Chem. 2012;287(17):13561–13571. doi:10.1074/jbc.M112.350066
15. Bendelac A, Savage PB, Teyton L. The biology of NKT cells. Annu Rev Immunol. 2007;25(1):297–336. doi:10.1146/annurev.immunol.25.022106.141711
16. Exley MA, Hand L, O’Shea D, Lynch L. Interplay between the immune system and adipose tissue in obesity. J Endocrinol. 2014;223(2):R41–R48. doi:10.1530/JOE-13-0516
17. Satoh M, Iwabuchi K. Role of natural killer T cells in the development of obesity and insulin resistance: insights from recent progress. Front Immunol. 2018;9:1314. doi:10.3389/fimmu.2018.01314
18. Lynch LA, O’Connell JM, Kwasnik AK, Cawood TJ, O’Farrelly C, O’Shea DB. Are natural killer cells protecting the metabolically healthy obese patient?. Obesity. 2009;17(3):601–605. doi:10.1038/oby.2008.565
19. Elinav E, Pappo O, Sklair-Levy M, et al. Adoptive transfer of regulatory NKT lymphocytes ameliorates non-alcoholic steatohepatitis and glucose intolerance in ob/ob mice and is associated with intrahepatic CD8 trapping. J Pathol. 2006;209(1):121–128. doi:10.1002/path.1950
20. Smiley ST, Kaplan MH, Grusby MJ. Immunoglobulin E production in the absence of interleukin-4-secreting CD1-dependent cells. Science. 1997;275(5302):977–979. doi:10.1126/science.275.5302.977
21. Mendiratta SK, Martin WD, Hong S, Boesteanu A, Joyce S, Van Kaer L. CD1d1 mutant mice are deficient in natural T cells that promptly produce IL-4. Immunity. 1997;6(4):469–477. doi:10.1016/s1074-7613(00)80290-3
22. Middendorp S, Nieuwenhuis EE. NKT cells in mucosal immunity. Mucosal Immunol. 2009;2(5):393–402. doi:10.1038/mi.2009.99
23. Ishikawa H, Ino S, Nakashima T, et al. Oral administration of trehangelin-A alleviates metabolic disorders caused by a high-fat diet through improvement of lipid metabolism and restored beneficial microbiota. Obes Res Clin Pract. 2020;14(4):360–367. doi:10.1016/j.orcp.2020.06.004
24. Druce I, Abujrad H, Ooi TC. PCSK9 and triglyceride-rich lipoprotein metabolism. J Biomed Res. 2015;29(6):429–436. doi:10.7555/JBR.29.20150052
25. Satoh M, Andoh Y, Clingan CS, et al. Type II NKT cells stimulate diet-induced obesity by mediating adipose tissue inflammation, steatohepatitis and insulin resistance. PLoS One. 2012;7(2):e30568. doi:10.1371/journal.pone.0030568
26. Wu L, Parekh VV, Gabriel CL, et al. Activation of invariant natural killer T cells by lipid excess promotes tissue inflammation, insulin resistance, and hepatic steatosis in obese mice. Proc Natl Acad Sci U S A. 2012;109(19):E1143–52. doi:10.1073/pnas.1200498109
27. Kotas ME, Lee HY, Gillum MP, et al. Impact of CD1d deficiency on metabolism. PLoS One. 2011;6(9):e25478. doi:10.1371/journal.pone.0025478
28. Miyagi T, Takehara T, Uemura A, et al. Absence of invariant natural killer T cells deteriorates liver inflammation and fibrosis in mice fed high-fat diet. J Gastroenterol. 2010;45(12):1247–1254. doi:10.1007/s00535-010-0272-y
29. Hams E, Locksley RM, McKenzie AN, Fallon PG. Cutting edge: IL-25 elicits innate lymphoid type 2 and type II NKT cells that regulate obesity in mice. J Immunol. 2013;191(11):5349–5353. doi:10.4049/jimmunol.1301176
30. Lynch L, Michelet X, Zhang S, et al. Regulatory iNKT cells lack expression of the transcription factor PLZF and control the homeostasis of T(reg) cells and macrophages in adipose tissue. Nat Immunol. 2015;16(1):85–95. doi:10.1038/ni.3047
31. Lynch L, Hogan AE, Duquette D, et al. iNKT cells induce FGF21 for thermogenesis and are required for maximal weight loss in GLP1 therapy. Cell Metab. 2016;24(3):510–519. doi:10.1016/j.cmet.2016.08.003
32. Kharitonenkov A, Shiyanova TL, Koester A, et al. FGF-21 as a novel metabolic regulator. J Clin Invest. 2005;115(6):1627–1635. doi:10.1172/JCI23606
33. Cai D, Liu T. Hypothalamic inflammation: a double-edged sword to nutritional diseases. Ann N Y Acad Sci. 2011;1243:E1–39. doi:10.1111/j.1749-6632.2011.06388.x
34. Bhattacharjee J, Kirby M, Softic S, et al. Hepatic natural killer T-cell and CD8+ T-cell signatures in mice with nonalcoholic steatohepatitis. Hepatol Commun. 2017;1(4):299–310. doi:10.1002/hep4.1041
35. Brailey PM, Evans L, Lopez-Rodriguez JC, et al. CD1d-dependent rewiring of lipid metabolism in macrophages regulates innate immune responses. Nat Commun. 2022;13(1):6723. doi:10.1038/s41467-022-34532-x
36. Janani C, Ranjitha Kumari BD. PPAR gamma gene--A review. Diabetes Metab Syndr. 2015;9(1):46–50. doi:10.1016/j.dsx.2014.09.015
37. Christofides A, Konstantinidou E, Jani C, Boussiotis VA. The role of peroxisome proliferator-activated receptors (PPAR) in immune responses. Metabolism. 2021;114:154338. doi:10.1016/j.metabol.2020.154338
38. He W, Barak Y, Hevener A, et al. Adipose-specific peroxisome proliferator-activated receptor gamma knockout causes insulin resistance in fat and liver but not in muscle. Proc Natl Acad Sci U S A. 2003;100(26):15712–15717. doi:10.1073/pnas.2536828100
 © 2023 The Author(s). This work is published and licensed by Dove Medical Press Limited. The full terms of this license are available at https://www.dovepress.com/terms.php and incorporate the Creative Commons Attribution - Non Commercial (unported, v3.0) License.
By accessing the work you hereby accept the Terms. Non-commercial uses of the work are permitted without any further permission from Dove Medical Press Limited, provided the work is properly attributed. For permission for commercial use of this work, please see paragraphs 4.2 and 5 of our Terms.
© 2023 The Author(s). This work is published and licensed by Dove Medical Press Limited. The full terms of this license are available at https://www.dovepress.com/terms.php and incorporate the Creative Commons Attribution - Non Commercial (unported, v3.0) License.
By accessing the work you hereby accept the Terms. Non-commercial uses of the work are permitted without any further permission from Dove Medical Press Limited, provided the work is properly attributed. For permission for commercial use of this work, please see paragraphs 4.2 and 5 of our Terms.