")
Back to Journals » International Journal of General Medicine » Volume 16
Effects of Liver Fibrosis on Islet Function in Patients with Chronic Hepatitis B Complicated with Impaired Fasting Glucose
Authors Lu Y , Gou W , Zhang HF , Li YY
Received 28 July 2023
Accepted for publication 26 October 2023
Published 8 November 2023 Volume 2023:16 Pages 5161—5173
DOI https://doi.org/10.2147/IJGM.S429455
Checked for plagiarism Yes
Review by Single anonymous peer review
Peer reviewer comments 2
Editor who approved publication: Professor Hyam Leffert
Yan Lu,1 Wei Gou,1,2 Hai Feng Zhang,3 Yi Ying Li3
1Department of Clinical Medicine, Qingdao University, Qingdao City, Shandong Province, People’s Republic of China; 2Department of Metabolic Liver Disease, Qingdao Sixth People’s Hospital, Qingdao City, Shandong Province, People’s Republic of China; 3Medical Department, Qingdao Sixth People’s Hospital, Qingdao City, Shandong Province, People’s Republic of China
Correspondence: Wei Gou, Email [email protected]
Background: Patients with chronic hepatitis B (CHB) and cirrhosis often have impaired fasting glucose (IFG). This study sought to investigate the impact of liver fibrosis on islet function in individuals diagnosed with CHB and IFG.
Material and Methods: Patients with chronic hepatitis B (CHB) and impaired fasting glucose (IFG) were selected for this study. They were divided into low-risk (L-R), intermediate-risk (M-R), and high-risk (H-R) liver fibrosis groups based on the FIB-4 score. The study compared islet function among different risk groups of liver fibrosis and analyze the correlation between liver fibrosis and islet function. Additionally, the patients were divided into a diabetes mellitus (DM) group and a non-DM (NDM) group based on the development of DM. The cumulative risk of progression to DM in patients with L-R, M-R, and H-R liver fibrosis was analyzed using the Kaplan–Meier method. Hazard ratios (HRs) and confidence intervals (CIs) were calculated for DM development through Cox regression analysis.
Results: In this study of 228 individuals, higher FIB-4 scores were observed in the DM group compared to the NDM group. Patients with H-R liver fibrosis displayed lower islet function and had a significantly higher risk of developing DM. The FIB-4 score and fasting plasma glucose (FPG) were identified as independent risk factors for DM progression in CHB patients with IFG.
Conclusion: Among patients with CHB and IFG, the severity of liver fibrosis is associated with islet function, and the FIB-4 score is a significant risk factor for DM development.
Keywords: chronic hepatitis B, FIB-4, impaired fasting glucose, islet function, diabetes mellitus
Introduction
Hepatic fibrosis is a crucial step in the progression toward cirrhosis and reflects the deterioration in liver function. Cirrhosis is highly prevalent worldwide, and it often leads to a decline in quality of life and increased mortality. In various chronic liver disease etiologies, cirrhosis develops gradually, involves the entire liver, and is characterized by the accumulation of fibrotic extracellular matrix and nodular regeneration.1
In China, chronic hepatitis B (CHB) is the main cause of cirrhosis. A significant proportion of patients with CHB suffer from impaired fasting glucose (IFG), especially patients with CHB with concomitant cirrhosis. According to research, 79.2% of chronic liver disease patients exhibit abnormal glucose metabolism, of which 40.78% have overt diabetes. Furthermore, the proportion of patients with diabetes and glucose intolerance can reach up to 96% in patients with cirrhosis.2–4 A 2020 cross-sectional study on the prevalence of DM in mainland China showed that the prevalence of DM and IFG in Chinese adults was 12.8% and 35.2%, respectively.5 This indicates that the incidence of DM, especially in patients with liver disease, such as cirrhosis, is significantly higher than the average incidence in the population.
In patients with chronic liver disease, an abnormal glucose tolerance, which is referred to as hepatogenic diabetes, is characterized by hyperinsulinemia and insulin resistance.6–8 The pathogenesis of hepatogenic diabetes remains a subject of debate, with early studies attributing the IFG observed in patients with cirrhosis to insulin resistance.9 However, recent studies have challenged this early view on the pathogenesis of hepatogenic diabetes, suggesting that glucose intolerance in patients with cirrhosis may not only result from insulin resistance, but also islet β-cell dysfunction.10,11
Previous studies have shown that compared with the general population, patients with cirrhosis with DM usually have better lipid and lipoprotein profiles and a lower frequency of certain risk factors, such as age, body mass index, and family history of DM. Moreover, β-cell dysfunction is related to liver disease severity.3,12–14 As liver function declines, the function of the pancreatic islets may also be compromised, potentially serving as a pivotal factor in the development of DM in patients with CHB. However, there is limited research on the relationship between hepatic fibrosis and islet function in this population. In light of this, this clinical study sought to investigate the impact of liver fibrosis on islet function in patients with CHB with IFG.
Materials and Methods
Study Population
We conducted a retrospective analysis of the electronic health records from two major medical centers in China (Qingdao Sixth People’s Hospital, which is a specialized liver disease hospital, and the Affiliated Hospital of Qingdao University). The database included data on over 50,000 hospitalized patients with CHB and hundreds of thousands of outpatient visits in the province. CHB was defined as positive for hepatitis B surface antigen or hepatitis B virus DNA at intervals of at least 6 months, according to established diagnostic criteria.15
To ensure the specificity of the study population, we excluded patients with liver cancer, high alcohol consumption, hepatitis C infection, autoimmune diseases, cholesteric liver diseases, iron or copper overload, as well as patients with severe fatty liver. Additionally, we also excluded patients with decompensated cirrhosis and those with a hepatitis B virus DNA level exceeding 2000 copies/mL to eliminate the potential impact of viral activity.
IFG was diagnosed based on the 2018 criteria outlined by the American Diabetes Association,16 whereby individuals with a fasting plasma glucose (FPG) of ≥5.6 mmol/L were classified as having IFG. To ensure that DM had definitely developed after enrollment, we excluded individuals with a prior diagnosis of DM, self-reported DM, a FPG of ≥7.0 mmol/L on two occasions or ≥11.1 mmol/L on one occasion at the time of enrollment, or a documented DM diagnosis in the hospital information system prior to enrollment from their medical records. In all cases, the age at first diagnosis of DM had to be ≥35 years to reduce the risk of misclassifying individuals with type 1 DM.
Variables
Blood Sampling and Laboratory Analyses
Biomarker data were obtained from the hospital inpatient information system, which provided comprehensive medical records for all study participants. All laboratory analyses were performed on fresh blood serum samples collected from the study participants and were conducted at either the laboratory of Qingdao Sixth People’s Hospital or the Affiliated Hospital of Qingdao University. Standardized and well-documented methodologies were used for all laboratory assays to ensure consistent and accurate results.
Assessment of Hepatic Fibrosis
To monitor the severity of liver fibrosis, we selected the Fibrosis-4 (FIB-4) Index, which is widely used in clinical practice due to its high predictive value for liver fibrosis.17 Based on the suggested FIB-4 cut-off scores stated in the 2015 World Health Organization guidelines for the prevention, care, and treatment of persons with CHB infection, we categorized patients into low-risk (L-R), intermediate-risk (M-R), and high-risk (H-R) liver fibrosis groups. These cut-off scores were developed based on non-invasive tests for the detection of significant fibrosis and cirrhosis. Specifically, the cut-off scores for the L-R, M-R, and H-R groups were <1.45, 1.45–3.25, and ≥3.25, respectively.18 For patients who underwent multiple FIB-4 tests during hospitalization, we used the record from the first detection of IFG to classify them into the appropriate risk group. The FIB-4 score was calculated using the following equation:

Assessment of Islet Function
The homeostasis model of β-cell function (HOMA-β) and insulin resistance index (HOMA-IR) is commonly used to evaluate islet function and to assess the impact of insulin resistance, respectively. These indices are calculated using FPG and fasting plasma insulin (FPI), both of which can be easily measured via routine laboratory tests.19 These indices are calculated using the following equation:


Follow-Up
The follow-up period began on the date of initial IFG detection and concluded with the occurrence of DM diagnosis, death, emigration, loss to follow-up, or May 31, 2021, which marked the end of the follow-up period. Patients were classified into DM and non-DM (NDM) cohorts based on the incidence of DM during the follow-up period. At the end of the follow-up period, the FIB-4 score and the HOMA-β score were recorded to assess hepatic fibrosis status and monitor any changes that may have occurred during the follow-up period due to treatment or other factors. This allowed for potential variations in baseline data analysis at the time of enrollment to be accounted for.
Analyses
The distribution of liver fibrosis risk between the DM and NDM groups was analyzed using the χ2 test. The study endpoint was the diagnosis of DM during the follow-up period. The cumulative risk of DM in the three liver fibrosis risk groups (L-R, M-R, and H-R) was analyzed using the Kaplan–Meier method. The hazard ratio (HR) of liver fibrosis and the different liver fibrosis risk levels for DM development were analyzed using the Cox regression analysis. In the Cox regression analysis, the L-R group was used as the reference group.
Statistical Analysis
Statistical analysis was performed using SPSS 26.0 software to compare the general characteristics, clinical data, FIB-4 score, distribution of liver fibrosis risk grade, and islet function (HOMA-β score) between the DM and NDM groups. The HOMA-β scores were logarithmically transformed to normalize the distribution and reduce the impact of extreme values, facilitating the application of statistical tests that assume normality. Normally distributed continuous variables are presented as the mean (standard deviation), and group comparisons were conducted using the t-test. Non-normally distributed continuous variables are presented as the median (interquartile range). Group comparisons were conducted using the Mann–Whitney U-test. Categorical data are presented as percentages. For the assessment of bivariate relationships, Pearson or Spearman correlation analyses were used depending on the distribution of the variables. A P value of <0.05 was considered statistically significant.
Ethical Considerations
This study strictly adheres to the requirements of the Declaration of Helsinki. The retrospective analysis of clinical data was conducted in accordance with strict measures for de-identification of personal information during the data collection process. As this study is retrospective in nature, informed consent from patients was not required. We consulted extensively with the Ethics Committee of Qingdao Sixth People’s Hospital and Qingdao University, and it was collectively determined that our study is exempt from formal ethical approval requirements. The study protocol and data handling procedures were designed to protect patient confidentiality and privacy, in line with the principles outlined in the Declaration of Helsinki.
Results
The Baseline and the End of Follow-Up Data
A total of 1212 patients with CHB with IFG were enrolled in the preliminary screening. Patients who met the inclusion criteria but who did not have any follow-up information (n = 708) were excluded. Patients with other types of viral hepatitis, autoimmune hepatitis, cancer (including cancer within 1 year after enrollment), decompensated cirrhosis (reducing the risk of FIB-4 Index and HOMA-β Index deficiency), a hepatitis B virus DNA load of >2000, and with a clear history of DM were excluded through patient electronic case information (n = 276). Finally, 228 individuals constituted the main analysis population. Among them, 68 patients (29.82%) were diagnosed with DM during the follow-up period (Figure 1).
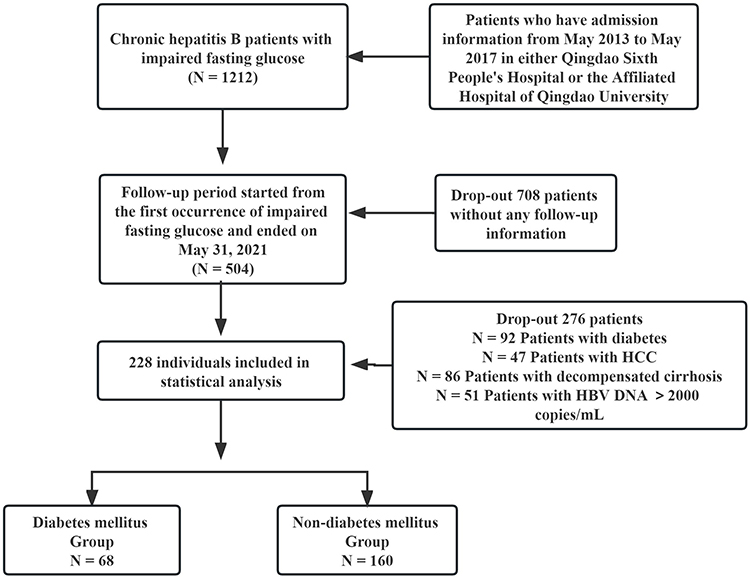 |
Figure 1 Flowchart of patient inclusion and exclusion. |
The mean age of the overall cohort was 53.19 (9.87) years, and there were 155 male patients (68% of the total cohort). The median FIB-4 score of the 228 enrolled patients was 1.77 (1.15–3.02). Among these patients, 84 (36.8%) were classified as having L-R liver fibrosis, 92 (40.4%) were classified as having M-R liver fibrosis, and 52 (22.8%) were classified as having H-R liver fibrosis. Compared with the NDM group, the age, FPG, and FIB-4 score of the DM group were higher (P < 0.05 for all) (Figure 2A). The proportion of patients with H-R liver fibrosis in the DM group was significantly higher than the proportion of patients with L-R and M-R liver fibrosis (P < 0.05) (Figure 2B). There was no significant difference in body weight, alanine transaminase, aspartate transaminase, total bilirubin, platelet count (PLT), triglycerides (TG), total cholesterol (TC), low-density lipoprotein (LDL), FPI, LnHOMA-β and HOMA-IR between the DM and NDM groups (P > 0.05). The clinical data of the subjects are detailed in Table 1.
 |
Table 1 Characteristics of the Study Cohort at the Time of Enrollment |
 |
Figure 2 Comparison of liver fibrosis between the DM group and the NDM group at enrollment. (A): Comparison of the FIB-4 scores. (B): Comparison of the liver fibrosis risk distribution. Same letters (eg, “a”) for both groups indicate no significant difference, while different letters (eg, “a” and “b”) indicate a significant difference between the groups. Abbreviations: DM, diabetes mellitus; NDM, non-diabetes mellitus; L-R, low-risk liver fibrosis; M-R, intermediate-risk liver fibrosis; H-R, high-risk liver fibrosis; FIB-4, Fibrosis-4. |
At the end of the follow-up period, it was observed that the DM group had a higher FIB-4 score (P < 0.05) and a higher proportion of patients with H-R liver fibrosis compared to the NDM group (P < 0.01), which was consistent with the baseline data at the time of enrollment. Furthermore, it was found that compared to baseline, the HOMA-β score was significantly lower in the DM group than in the NDM group at the end of the follow-up period, and the DM group exhibited higher insulin resistance compared to the NDM group (P < 0.01) (Figure 3). However, there were no significant differences in body weight, alanine transaminase, aspartate transaminase, total bilirubin, Platelet count (PLT), triglycerides (TG), total cholesterol (TC), low-density lipoprotein (LDL) between the two groups (Table 2).
 |
Table 2 Characteristics of the Study Cohort at the End of Follow-Up |
 |
Figure 3 Islet function and liver fibrosis in the DM and NDM groups over time. (A): The islet function index in the two groups at the start of follow-up. (B): The islet function index in the two groups at the end of follow-up. (C): The FIB-4 score at the start of follow-up. (D): The FIB-4 score at the end of follow-up. (E): The distribution of liver fibrosis grade in the two groups at the start of follow-up. (F): The distribution of liver fibrosis grade in the two groups at the end of follow-up. Same letters (eg, “a”) for both groups indicate no significant difference, while different letters (eg, “a” and “b”) indicate a significant difference between the groups. Abbreviations: DMDM, diabetes mellitus; NDM, non-diabetes mellitus; L-R, low-risk liver fibrosis; M-R, intermediate-risk liver fibrosis; H-R, high-risk liver fibrosis; LnHOMA-β, logarithm of islet function index; FIB-4, Fibrosis-4. |
Association Between Liver Fibrosis and Islet Function
According to the stratification of liver fibrosis risk groups, we compared the islet function among different risk groups. The results showed no significant differences in islet function at baseline and at the end of follow-up between different liver fibrosis risk groups. Among patients with a follow-up time exceeding 900 days, there were no significant differences in islet function among different risk groups. However, among patients with a follow-up time exceeding 1700 days and 2000 days, significant differences were observed between different liver fibrosis risk groups. Subsequent comparisons between the groups revealed that patients with high-risk liver fibrosis had lower islet function compared to those in the low-risk and moderate-risk groups, and these differences were statistically significant. There were no significant differences observed between the low-risk and moderate-risk groups of liver fibrosis patients (Table 3).
 |
Table 3 Comparative Islet Function in Different Liver Fibrosis Groups: Start and End of Follow-Up Period |
We conducted a correlation analysis between the D-Value (obtained by subtracting the values at baseline from the values at the end of follow-up) of clinical indicators and the D-Value of islet function (LnHOMA-β). The analysis revealed correlations between the D-Value of islet function and the D-Value of FIB-4 in the moderate-risk (M-R) and high-risk (H-R) liver fibrosis groups. Specifically, among study subjects with follow-up durations exceeding 1700 days and 2000 days, the D-Value of islet function displayed a negative correlation with the D-Value of FIB-4 in both the M-R and H-R liver fibrosis groups, while displayed no correlation with low-risk (L-R) liver fibrosis group (Table 4, Figure 4). Additionally, there was a positive correlation between the D-Value of islet function and the D-Value of FPI, while among study subjects with follow-up durations exceeding 900 days, there was a negative correlation between the D-Value of islet function and the D-Value of fasting plasma glucose (FPG). Furthermore, there were no correlations between the D-Value of islet function and the D-Values of other clinical indicators.
 |
Table 4 Correlation Analysis of Clinical Indicators D-Value with LnHOMA-β D-Value During Follow-Up |
 |
Figure 4 Correlation Analysis of FIB-4 D-Value and Islet Function D-Value in Three Liver Fibrosis Risk Groups. (A–C): Correlation analysis between FIB-4 D-value and islet function D-value in the low liver fibrosis risk group, with follow-up durations exceeding 900 days, 1700 days, and 2000 days respectively. (D–F): Correlation analysis between FIB-4 D-value and islet function D-value in the moderate liver fibrosis risk group, with follow-up durations exceeding 900 days, 1700 days, and 2000 days respectively. (G–I): Correlation analysis between FIB-4 D-value and islet function D-value in the high liver fibrosis risk group, with follow-up durations exceeding 900 days, 1700 days, and 2000 days respectively. Abbreviation: L-R, low-risk liver fibrosis; M-R, intermediate-risk liver fibrosis; H-R, high-risk liver fibrosis; LnHOMA-β, logarithm of islet function index; FIB-4, Fibrosis-4; D-value: subtracting the values at baseline from the values at the end of follow-up. |
Cumulative Risk of Progression to DM in Patients with Different Liver Fibrosis Risks
During the follow-up period of 360,482 person-days for 228 patients, 68 patients (29.8%) were diagnosed with DM, which served as the endpoint event. Among these patients, 19 patients with L-R liver fibrosis (22.9%), 26 patients with M-R liver fibrosis (28%), and 23 patients with H-R liver fibrosis (44.2%) reached the endpoint event. The median follow-up period was 1704 days (1096.3–2118.5). The Kaplan–Meier curve revealed a significant difference in the cumulative risk of DM among the three liver fibrosis risk groups (Log rank test: χ² = 9.19, P < 0.05). Moreover, there was a significant difference in the cumulative risk of DM in patients with H-R liver fibrosis compared with those with L-R or M-R liver fibrosis (Log rank test: χ² = 7.42, P < 0.016 and χ² = 5.81, P < 0.016, respectively). However, no significant difference was observed between patients with L-R liver fibrosis and those with M-R liver fibrosis (Log rank test: χ² = 0.23, P = 0.63) (Figure 5).
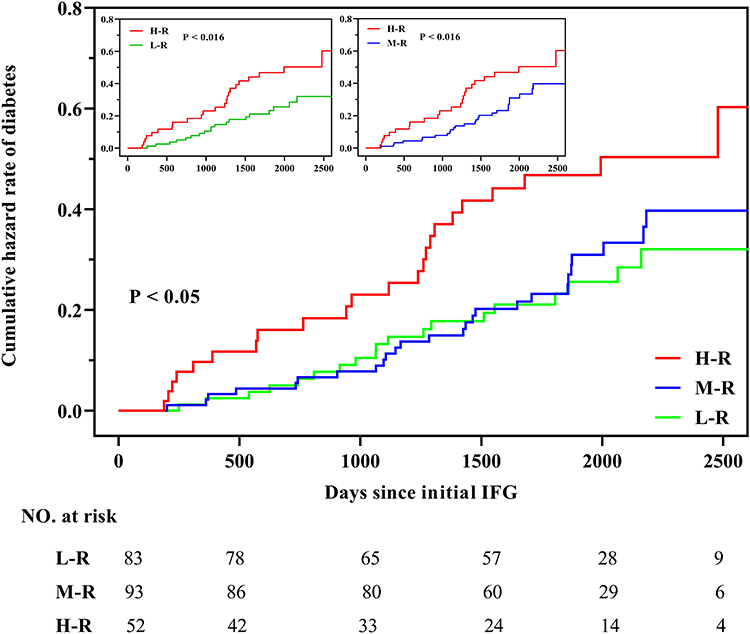 |
Figure 5 Kaplan–Meier curves of the cumulative hazard rate of DM in patients with L-R, M-R, and H-R liver fibrosis stratified by FIB-4 score. Abbreviations: L-R, low-risk liver fibrosis; M-R, intermediate-risk liver fibrosis; H-R, high-risk liver fibrosis; IFG, impaired fasting glucose. |
Risk Factors for DM in Patients with CHB and IFG
The Cox regression analysis was used to identify the risk factors for progression to DM in patients with CHB and IFG. The univariate analysis revealed that age, FPG, and FIB-4 score (HR 1.10, 95% CI 1.04–1.17, P < 0.01) were significantly associated with the risk of the endpoint event. H-R liver fibrosis was significantly associated with the risk of the endpoint event compared with L-R liver fibrosis (HR 2.30, 95% CI 1.25–4.23, P < 0.01). The multivariate Cox proportional hazards regression analysis was constructed to analyze the effects of age, FPG, and FIB-4 score. The results indicated that the FIB-4 score (HR 1.07, 95% CI 1.00–1.14, P < 0.05) and FPG were independent risk factors for the progression to DM in patients with CHB and IFG. The collinearity between relevant variables was assessed because the FIB-4 Index incorporates age into the calculation. The variance inflation factor (VIF) value of all variables was less than 5, indicating that the analysis of the FIB-4 score was not significantly affected by age (Table 5).
 |
Table 5 Risk Factors for DM in Patients with CHB and IFG |
Discussion
In this study, the DM group was slightly older than the NDM group (52.21 vs 55.50 years, respectively), and the proportion of males (68%) was higher than the proportion of females, which is consistent with epidemiological data demonstrating a higher incidence of hepatitis B in males than in females.20 Patients with acute hepatitis and severe decompensation were excluded, resulting in stable clinical biochemical indicators of liver disease with no significant differences between the two groups. The median insulin resistance index (HOMA-IR) was 3.70 (2.42–5.66), which is significantly higher than the normal value of 1 and is consistent with the characteristic of IFG. The DM group had higher FPG at enrollment than the NDM group, but there was no statistically significant difference in islet function (HOMA-β), insulin resistance (HOMA-IR), or FPI. The homogeneity of the relevant data was better, minimizing the impact of islet function imbalance on the study results.
According to the statistical analysis results, the distribution of liver fibrosis was significantly different between the DM and NDM groups. Compared with the L-R liver fibrosis (FIB-4 score of <1.45) and M-R liver fibrosis (1.45 ≤ FIB-4 score ≤ 3.25) groups, the H-R liver fibrosis group (FIB-4 score of ≥3.25) had a higher proportion of patients with DM (44.2%). The Kaplan–Meier curve showed a significantly higher cumulative risk of DM in the group with H-R liver fibrosis than in the group with L-R or M-R liver fibrosis. These results indicate that patients with CHB and IFG with severe liver fibrosis have a higher risk of DM than those with mild liver fibrosis.
According to the Cox regression analysis, the FIB-4 score remained an independent risk factor for the progression to DM in patients with CHB after adjusting for sex, age, and FPG. In patients with different liver fibrosis risk levels, the risk of DM was 2.3-times higher in patients with H-R liver fibrosis than in patients with L-R liver fibrosis. These findings indicate that patients with more severe liver fibrosis have a higher risk of islet dysfunction, leading to a higher proportion of patients with progression to DM than patients with mild liver fibrosis.
The pathophysiological mechanism of DM is failure of islet β-cell function to maintain glucose metabolism homeostasis, resulting in hyperglycemia. The occurrence of DM is inevitably accompanied by a gradual deterioration in islet function.21 In this study, there was no significant difference in islet function or insulin resistance between the DM and NDM groups at enrollment, while at the end of follow-up, the DM group had lower HOMA-β scores than the NDM group. Our study compares islet function among different risk groups of liver fibrosis, it suggests that there are no significant differences in islet function among different liver fibrosis risk groups initially. However, as the follow-up durations lengthened, patients with H-R liver fibrosis exhibited lower islet function compared to the L-R and M-R groups. Changes in FIB-4 of M-R and H-R groups were negative correlated with changes in islet function, indicates that in patients with moderate to high-risk liver fibrosis, a greater increase in FIB-4 index is associated with a greater decline in islet function. It suggests that as lengthened, liver fibrosis may have a negative impact on pancreatic function in patients with CHB and IFG.
Severe fibrosis can cause great damage to the liver, leading to a decline in liver function. This may affect the synthesis of proteins and coagulation factors, the degradation and transformation of harmful substances, and the removal of hormones, resulting in relevant clinical manifestations.22,23 Recent studies have demonstrated that DM can be normalized in approximately two thirds of patients with cirrhosis after liver transplantation, possibly due to increased liver insulin sensitivity and insulin catabolism.24–26 Additionally, liver transplantation can improve β-cell function and insulin bioavailability, which is a key process in controlling favorable or unfavorable changes in glucose regulation after transplantation.27 An early study also suggested that the failing liver has an independent toxic effect on β cells, leading to the development of DM.13 Previous studies collectively suggest that the deterioration in liver function in patients with chronic liver disease can impact islet function.9,28
Our research can be compared with previous studies. For example, Kuroda et al11 reported that patients with cirrhotic portal hypertension showed pancreatic swelling and β-cell dysfunction on histological analysis. Compensatory thickening of the pancreatic vein occurs due to collagen deposition caused by portal hypertension, which leads to venous intima damage and impaired drainage. The deterioration in islet β-cell function due to pancreatic swelling suggests that this may be one of the factors inducing hepatogenic diabetes. Moreover, Sakata et al10 conducted a comparative study of human autopsy liver specimens and found that patients with cirrhosis had islet hypertrophy and decreased insulin expression. These findings indicate that severe liver fibrosis may have affected islet function through hemodynamic changes around the liver.29,30
This study has several limitations that should be acknowledged. First, this was a retrospective study with a limited sample size. Therefore, further large-scale prospective studies conducted at multiple centers are needed to confirm our findings. Second, the FIB-4 score, which is calculated based on serum markers, has limitations in terms of its ability to accurately diagnose liver fibrosis. Moreover, liver biopsy has poor compliance in the general population, so the clinical use rate is very low. Similarly, the HOMA-β Index has limitations in terms of its ability to assess pancreatic islet function, as the assessment of pancreatic islet function using standard hyperglycemia clipping techniques requires complex experimental techniques and professional laboratory equipment.
It is important to note that the first IFG defined in this study only refers to the first recorded instance in the patient medical records; therefore, it may not accurately reflect the true onset of IFG. IFG, also known as pre-diabetes, is considered as an intermediate stage between normal glucose metabolism and DM. By selecting patients with IFG for observation, we aimed to shorten the follow-up period of patients with DM compared to those with normal glucose metabolism. In particular, we focused on patients with CHB and IFG to minimize the impact of the imbalance in islet function on the study outcomes. Although the baseline FPG concentration in the DM group was higher than in the NDM group, we adjusted for this factor in the multivariate Cox regression analysis and were still able to conclude that the FIB-4 score is a significant predictor of the progression to DM. We observed a tendency towards a significant difference in islet function at baseline, although this difference did not reach statistical significance (P = 0.07). This observation is primarily attributed to the limitations of retrospective study data. Nevertheless, further studies are needed to confirm our findings.
In conclusion, this study suggests that in patients with CHB and IFG, the severity of liver fibrosis is associated with islet function, and the FIB-4 score is a significant risk factor for the development of DM. The progression of liver fibrosis may contribute to the development of DM causing a deterioration in islet function. Notably, our findings highlight the importance of considering islet function when assessing disease progression in patients with CHB, as this factor is often overlooked in clinical practice. Therefore, detecting islet function, particularly in patients with IFG, may be a useful tool to evaluate disease severity in this patient population. Further studies are needed to confirm our findings and to identify potential therapeutic strategies targeting both liver fibrosis and islet function in patients with CHB and IFG.
We acknowledge the financial support provided by Qingdao University and Qingdao Key Health Discipline Development Fund for this research project. The funding from these institutions enabled us to conduct this study and publish the results.
Author Contributions
All authors made a significant contribution to the work reported, whether that is in the conception, study design, execution, acquisition of data, analysis and interpretation, or in all these areas; took part in drafting, revising or critically reviewing the article; gave final approval of the version to be published; have agreed on the journal to which the article has been submitted; and agree to be accountable for all aspects of the work.
Funding
This work was supported by Qingdao Key Health Discipline Development Fund and Qingdao University.
Disclosure
The authors have no competing interests to declare for this work.
References
1. Kisseleva T, Brenner D. Molecular and cellular mechanisms of liver fibrosis and its regression. Nat Rev Gastroenterol Hepatol. 2021;18:151–166. doi:10.1038/s41575-020-00372-7
2. Lin CY, Adhikary P, Cheng K. Cellular protein markers, therapeutics, and drug delivery strategies in the treatment of diabetes-associated liver fibrosis. Adv Drug Deliv Rev. 2021;174:127–139. doi:10.1016/j.addr.2021.04.008
3. Garcia-Compean D, Jaquez-Quintana JO, Lavalle-Gonzalez FJ, et al. The prevalence and clinical characteristics of glucose metabolism disorders in patients with liver cirrhosis. A prospective study. Ann Hepatol. 2012;11(2):240–248. doi:10.1016/s1665-2681(19)31030-0
4. Petit JM, Hamza S, Rollot F, et al. Impact of liver disease severity and etiology on the occurrence of diabetes mellitus in patients with liver cirrhosis. Acta Diabetol. 2014;51(3):455–460. doi:10.1007/s00592-013-0538-y
5. Li YZ, Teng D, Shi XG, et al. Prevalence of diabetes recorded in mainland China using 2018 diagnostic criteria from the American Diabetes Association: national cross sectional study. BMJ. 2020;369:11. doi:10.1136/bmj.m997
6. Iversen J, Vilstrup H, Tygstrup N. Kinetics of glucose metabolism in relation to insulin concentrations in patients with alcoholic cirrhosis and in healthy persons. Gastroenterology. 1984;87(5):1138–1143. doi:10.1016/S0016-5085(84)80075-X
7. Kruszynska YT, Harry DS, Bergman RN, et al. Insulin sensitivity, insulin-secretion and glucose effectiveness in diabetic and nondiabetic cirrhotic-patients. Diabetologia. 1993;36(2):121–128. doi:10.1007/bf00400692
8. Shmueli E, Walker M, Alberti G, et al. Normal splanchnic but impaired peripheral insulin-stimulated glucose uptake in cirrhosis. Hepatology. 1993;18(1):86–95. doi:10.1002/hep.1840180115
9. Petrides AS, Schulzeberge D, Vogt C, et al. Glucose resistance contributes to diabetes-mellitus in cirrhosis. Hepatology. 1993;18(2):284–291. doi:10.1002/hep.1840180210
10. Sakata M, Kawahara A, Kawaguchi T, et al. Decreased expression of insulin and increased expression of pancreatic transcription factor PDX-1 in islets in patients with liver cirrhosis: a comparative investigation using human autopsy specimens. J Gastroenterol. 2013;48(2):277–285. doi:10.1007/s00535-012-0633-9
11. Kuroda T, Hirooka M, Koizumi M, et al. Pancreatic congestion in liver cirrhosis correlates with impaired insulin secretion. Hepatology. 2014;60:390A–391A.
12. Orsi E, Grancini V, Menini S, et al. Hepatogenous diabetes: is it time to separate it from type 2 diabetes? Liver Int. 2017;37(7):950–962. doi:10.1111/liv.13337
13. Grancini V, Trombetta M, Lunati ME, et al. Contribution of beta-cell dysfunction and insulin resistance to cirrhosis-associated diabetes: role of severity of liver disease. J Hepatol. 2015;63(6):1484–1490. doi:10.1016/j.jhep.2015.08.011
14. Nishida T, Tsuji S, Tsujii M, et al. Oral glucose tolerance test predicts prognosis of patients with liver cirrhosis. Am J Gastroenterol. 2006;101(1):70–75. doi:10.1111/j.1572-0241.2005.00307.x
15. Terrault NA, Lok ASF, McMahon BJ, et al. Update on prevention, diagnosis, and treatment of chronic hepatitis B: AASLD 2018 hepatitis B guidance. Hepatology. 2018;67(4):1560–1599. doi:10.1002/hep.29800
16. American Diabetes A. Classification and diagnosis of diabetes: standards of medical care in diabetes-2018. Diabetes Care. 2018;41:S13–S27. doi:10.2337/dc18-S002
17. Kim BK, Kim DY, Park JY, et al. Validation of FIB-4 and comparison with other simple noninvasive indices for predicting liver fibrosis and cirrhosis in hepatitis B virus-infected patients. Liver Int. 2010;30(4):546–553. doi:10.1111/j.1478-3231.2009.02192.x
18. World Health Organization. Guidelines for the Prevention, Care and Treatment of Persons with Chronic Hepatitis B Infection. Geneva: World Health Organization; 2015.
19. Levy JC, Matthews DR, Hermans MP. Correct homeostasis model assessment (HOMA) evaluation uses the computer program. Diabetes Care. 1998;21(12):2191–2192. doi:10.2337/diacare.21.12.2191
20. Zhang G, Sun X, Wang F, et al. Analysis of epidemiological characteristics of hepatitis B in Chinese population aged 18–59 years and discussion on immunization strategy of hepatitis B vaccine (in Chinese). Chin J Vaccins Immun. 2013;19:266–270. doi:10.19914/j.cjvi.2013.03.018
21. Li G. Assessment of islet β cell function (in Chinese). Int J Endocrinol Metabol. 2001;2001:225–227.
22. Najjar SM, Perdomo G. Hepatic insulin clearance: mechanism and physiology. Physiology. 2019;34(3):198–215. doi:10.1152/physiol.00048.2018
23. Gines P, Krag A, Abraldes JG, et al. Liver cirrhosis. Lancet. 2021;398(10308):1359–1376. doi:10.1016/s0140-6736(21)01374-x
24. Merli M, Leonetti F, Riggio O, et al. Glucose intolerance and insulin resistance in cirrhosis are normalized after liver transplantation. Hepatology. 1999;30(3):649–654. doi:10.1002/hep.510300306
25. Perseghin G, Mazzaferro V, Sereni LP, et al. Contribution of reduced insulin sensitivity and secretion to the pathogenesis of hepatogenous diabetes: effect of liver transplantation. Hepatology. 2000;31(3):694–703. doi:10.1002/hep.510310320
26. Blanco JJ, Herrero JI, Quiroga J, et al. Liver transplantation in cirrhotic patients with diabetes mellitus: midterm results, survival, and adverse events. Liver Transpl. 2001;7(3):226–233. doi:10.1053/jlts.2001.22183
27. Grancini V, Trombetta M, Lunati ME, et al. Central role of the beta-cell in driving regression of diabetes after liver transplantation in cirrhotic patients. J Hepatol. 2019;70(5):954–962. doi:10.1016/j.jhep.2019.01.015
28. Ishikawa T, Shiratsuki S, Matsuda T, et al. Occlusion of portosystemic shunts improves hyperinsulinemia due to insulin resistance in cirrhotic patients with portal hypertension. J Gastroenterol. 2014;49(9):1333–1341. doi:10.1007/s00535-013-0893-z
29. Lomonaco R, Leiva EG, Bril F, et al. Advanced liver fibrosis is common in patients with type 2 diabetes followed in the outpatient setting: the need for systematic screening. Diabetes Care. 2021;44(2):399–406. doi:10.2337/dc20-1997
30. Ciardullo S, Monti T, Perseghin G. High prevalence of advanced liver fibrosis assessed by transient elastography among US adults with type 2 diabetes. Diabetes Care. 2021;44(2):519–525. doi:10.2337/dc20-1778
 © 2023 The Author(s). This work is published and licensed by Dove Medical Press Limited. The full terms of this license are available at https://www.dovepress.com/terms.php and incorporate the Creative Commons Attribution - Non Commercial (unported, v3.0) License.
By accessing the work you hereby accept the Terms. Non-commercial uses of the work are permitted without any further permission from Dove Medical Press Limited, provided the work is properly attributed. For permission for commercial use of this work, please see paragraphs 4.2 and 5 of our Terms.
© 2023 The Author(s). This work is published and licensed by Dove Medical Press Limited. The full terms of this license are available at https://www.dovepress.com/terms.php and incorporate the Creative Commons Attribution - Non Commercial (unported, v3.0) License.
By accessing the work you hereby accept the Terms. Non-commercial uses of the work are permitted without any further permission from Dove Medical Press Limited, provided the work is properly attributed. For permission for commercial use of this work, please see paragraphs 4.2 and 5 of our Terms.