Back to Journals » Nature and Science of Sleep » Volume 13
Effects of Dinner Timing on Sleep Stage Distribution and EEG Power Spectrum in Healthy Volunteers
Authors Duan D ![]() , Gu C, Polotsky VY, Jun JC, Pham LV
, Gu C, Polotsky VY, Jun JC, Pham LV
Received 21 January 2021
Accepted for publication 13 April 2021
Published 14 May 2021 Volume 2021:13 Pages 601—612
DOI https://doi.org/10.2147/NSS.S301113
Checked for plagiarism Yes
Review by Single anonymous peer review
Peer reviewer comments 2
Editor who approved publication: Prof. Dr. Ahmed BaHammam
Daisy Duan,1 Chenjuan Gu,2 Vsevolod Y Polotsky,2 Jonathan C Jun,2 Luu V Pham2
1Division of Endocrinology, Diabetes and Metabolism, Department of Medicine, Johns Hopkins University School of Medicine, Baltimore, MD, USA; 2Division of Pulmonary and Critical Care, Department of Medicine, Johns Hopkins University School of Medicine, Baltimore, MD, USA
Correspondence: Luu V Pham
Pulmonary and Critical Care Medicine, 5501 Hopkins Bayview Circle, Asthma and Allergy Center, Johns Hopkins Sleep Disorders Center, Baltimore, MD, 21224, USA
Tel +1 410-550-0741
Fax +1 410-550-3374
Email [email protected]
Purpose: Eating time and sleep habits are important modifiable behaviors that affect metabolic health, but the relationship between food intake and sleep remains incompletely understood. Observational data suggest that late food intake is associated with impaired sleep quality. We examined the effect of routine dinner (RD, 5 hours before bedtime) vs late dinner (LD, 1 hour before bedtime) on sleep architecture in healthy volunteers.
Participants and Methods: This was a post hoc analysis of a randomized crossover study of RD vs LD with a fixed sleep opportunity in a laboratory setting. On each of the two visits, 20 healthy adult volunteers (10 women) received an isocaloric meal followed by overnight polysomnography. Sleep architecture over the course of the night was assessed using visual sleep staging and EEG spectral power analysis and was compared between RD and LD. We modeled the proportions of spectral power in alpha, beta, delta, and theta bands as functions of dinner timing, time of night, and their interaction with mixed-effect spline regression.
Results: Conventional sleep stages were similar between the 2 visits. LD caused a 2.5% initial increase in delta power and a reciprocal 2.7% decrease in combined alpha and beta power (p< 0.0001). These effects diminished as sleep continued with a reversal of these patterns in the latter part of the night.
Conclusion: Contrary to the existing literature, shifting dinner timing from 5 hours before sleep to 1 hour before sleep in healthy volunteers did not result in significant adverse changes in overnight sleep architecture. In fact, LD was associated with deeper sleep in the beginning of the night and lighter sleep in the latter part of the night in healthy volunteers. This novel manifestation of postprandial hypersomnia may have therapeutic potential in patients with sleep disorders.
Keywords: late eating, dinner timing, sleep architecture, EEG spectral power
Introduction
Eating and sleeping habits are closely related and both serve as important modifiable behaviors that can affect health outcomes. While there is increasing evidence for the influence of sleep on dietary intake, the impact of eating patterns on sleep quality has been less studied. Daytime food intake has been shown to alter the propensity for postprandial sleep and sleep architecture. Increased sleep drive was seen in first few hours following a daytime meal, as assessed by multiple sleep latency tests and electroencephalogram (EEG) measures.1 Zammit et al showed that a midday meal, compared to fasting, increased the duration and depth of postprandial sleep once asleep, but did not alter the likelihood of falling asleep.2 Notably, these studies did not evaluate nocturnal sleep.
In contrast to the aforementioned studies demonstrating enhanced postprandial sleep following daytime food intake, observational studies have shown that food intake close to the sleeping period was associated with impaired sleep quality at night. A Brazilian study in which healthy participants completed a 3-day food diary and underwent polysomnography found that self-reported food intake within 30 to 60 minutes before bedtime was associated with delayed sleep onset and decreased sleep efficiency.3 Similarly, a survey of Japanese adults about their eating and sleep habits demonstrated an association between food intake later in the day and poor sleep-wake regularity.4 A 12-week study of time-restricted feeding in participants with obesity, on the other hand, found no significant changes in sleep quality, as measured by the Pittsburgh Sleep Quality Index, when food intake was limited to the hours before 18:00.5 A study that examined the effect of a 5-hour delay in meals for 6 days on circadian rhythm markers in healthy young men found that late meals delayed peripheral clock rhythms in adipose tissue but did not alter central clock such as cortisol or melatonin rhythms or affect any sleep parameters measured by actigraphy.6 Thus, significant controversy remains regarding the impact of food intake timing on overnight sleep, with no studies examining the effect of evening meal timing on objective measures of sleep architecture.
We recently conducted a randomized crossover study in healthy volunteers to examine the effects of shifting dinner from 5 hours before sleep at 18:00 (routine dinner, RD) to 1 hour before sleep at 22:00 (late dinner, LD). We instructed participants to sleep from 23:00 until 07:00, and performed polysomnography under both LD and RD conditions.7 We found no significant differences between RD and LD sleep architecture when polysomnographic data was averaged across the entire night. However, conventional sleep staging with visual scoring may lack sensitivity to detect subtle alterations in sleep EEG in these young, healthy individuals. In addition, assessment of whole-night sleep quality offers limited insight into the potentially time-dependent impact of dinner timing on sleep architecture. Specifically, as the night progresses and LD meal is fully metabolized, the effect of LD on sleep architecture may diminish. Spectral power analysis provides unique insights into sleep architecture and its evolution throughout the night. For instance, spectral power analysis has been performed to dissect the discrepancy between subjective and objective sleep data in primary insomnia.8 Patients with insomnia exhibit higher beta and sigma activity during non-REM sleep than normal sleepers, reflecting a state of hyperarousal and the subjective perception of non-restorative sleep.9 Similarly, sleep EEG spectral power analysis has shown that post-traumatic stress disorder is associated with a shift in power spectral distribution to higher frequencies during non-REM sleep.10 In addition, experimental suppression of delta spectral power in young healthy adults reduced glucose tolerance and increased diabetes risk.11
In the present study, we examined sleep architecture over time using conventional sleep staging12 and using Fourier analysis to isolate dominant frequency bands associated with “deep” sleep, “light” sleep, and wakefulness. We hypothesized that LD would induce lighter sleep and wakefulness compared to RD.
Methods
Participants and Study Protocol
This study is a post-hoc analysis of a previously published randomized crossover study in an inpatient laboratory setting, which examined the effects of late dinner on metabolism.7 The primary outcomes of the published study were glucose homeostasis and fatty acid oxidation. Briefly, each participant underwent 2 inpatient study visits at the Johns Hopkins Clinical Research Unit. During each visit, participants were acclimated to the laboratory setting for 1 night, followed by a study night during which they were provided with RD (given at 18:00) or LD (given at 22:00). During the second inpatient study visit, the opposite dinner timing (RD or LD) was implemented. The order of dinner timing was determined by randomization, stratified by sex. Studies were separated by a 3–4 week wash-out period. This period was designed to allow the 2 laboratory visits to be scheduled during the same phase of the menstrual cycle in female participants and to ensure complete washout of the stable isotope tracers that were administered to participants. We recruited 20 healthy non-obese adult volunteers (10 women and 10 men), age 18 to 30 years, and with a self-reported routine bedtime between 22:00 and 1:00. The participants did not have any sleep or circadian rhythm disorders, diabetes mellitus, or chronic use of medications that could affect sleep or circadian rhythm. This study was approved by the Johns Hopkins Institutional Review Board and was conducted in accordance with the Declaration of Helsinki. All participants provided written informed consent prior to study commencement.
During the week prior to each study visit, we instructed participants to maintain a regular sleep-wake pattern as follows: 1) arising from bed at 07:00, 2) retiring to bed at 23:00 and 3) eating 3 meals a day with dinner at 19:00 or earlier. Additionally, participants wore GT9X Link actigraphy devices (ActiGraph, Pensacola, FL, USA) on their non-dominant wrist for 1 week prior to each inpatient visit. The actigraphy data was analyzed using ActiLife 6 software. Cole–Kripke scoring algorithm was applied to identify sleep/wake periods13 and to generate estimates for total sleep time, sleep efficiency, and wake after sleep onset (WASO). These parameters were then averaged across the 1-week period before both visits and Wilcoxon signed-rank tests were used to compare the parameters before RD vs LD.
During the study visit, meals were provided at 08:00, and 13:00, followed by dinner at 18:00 and a snack at 22:00 for RD. The timing of dinner and the snack were reversed for LD. The total daily calories provided by these meals were calculated using the Mifflin–St Jeor predictive equation multiplied by a physical activity factor of 1.4 to meet the energy needs for each participant.14,15 Specifically, breakfast accounted for 25% of the total daily intake of kcal, lunch accounted for 30%, dinner accounted by 35%, and the snack accounted for 10%. The macronutrient composition of each meal was kept constant, with approximately 50% carbohydrate, 35% fat, and 15% protein. At night, the participants were allowed to sleep from 23:00 (lights off) to 07:00 the following morning (lights on).
Polysomnography
Attended polysomnography (PSG) was performed from 23:00 until 07:00 with continuous recordings of EEG, electrooculography, oximetry, respiratory effort, and transcutaneous CO2 (tcCO2, Radiometer TCM-4). Recording electrodes were placed according to the International 10–20 system16 and were referenced to the contralateral mastoid site. Specifically, the PSG montage consisted of frontal (F3-M2 and F4-M1), central (C3-M2 and C4-M1), and occipital (O1-M2 and O2-M1) EEG channels. Two EOG electrodes were placed 1 cm above and below the outer canthus of each eye and referenced to a single mastoid site (LOC-M2 and ROC-M2). The EEGs were sampled at a rate of 200 Hz. Sleep stages were scored visually using American Academy of Sleep Medicine guidelines as previously published.17
EEG Spectral Analysis
We applied methods similar to Zhang et al18 to calculate the proportions of spectral power in the delta (0.8 to 4.0 Hz), theta (4.1 to 8.0 Hz), alpha (8.1 to 13.0 Hz), and beta (13.1 to 20.0 Hz) frequency bands. The C4-A1 EEG recordings were sampled at 200 Hz and windowed into 5-second, non-overlapping segments with a Hamming window. A fast Fourier transform was applied to each 5-second segment, resulting in a frequency resolution of 0.2 Hz. Smoothing of the spectral distribution was accomplished by dividing the sum of the power in band by the total power over each 30-second epoch of recording time.
Statistical Analysis
In the first phase of our analysis, our primary outcome was the proportion of time spent in each sleep stage over the course of the night. Since sleep can progress between NREM and REM stages at an approximate cycle length of 2 hours, we analyzed the median proportions of each sleep stage in 2-hour segments, resulting in 4 measures (120 minutes each) for each participant on each study night. Since each participant served as their own controls and thus measurements were paired, we applied Wilcoxon signed-rank tests to compare RD vs LD.
Next, to examine the effect of LD on EEG spectral power distribution, we modeled the proportion of spectral power in each band (alpha, beta, delta and theta) as a function of dinner timing and time from the start of the PSG recording (“lights out”) with mixed-effect spline regression models with knots placed at 60-min intervals. To examine whether the effect of LD on EEG spectral power was modified by time of night, we included an interaction term between dinner timing and time since lights out. To examine whether the effect of LD on spectral power distribution is modified by sex, we included additional models that adjusted for sex as an independent variable and the interaction term between dinner timing and sex. We modeled inter-subject differences in baseline EEG power distribution with random intercepts. This approach accounted for similarities between adjacent time periods in a recording by modeling the outcomes continuously over time. Since the interval of knots was determined arbitrarily, we performed sensitivity analyses with knots at intervals varying between 1 and 120 minutes. We performed additional sensitivity analyses by incorporating random slopes into our regression models.
Lastly, we explored whether dinner timing influenced arousal frequency throughout the night. Scored arousal periods (number of arousals per hour of sleep) were summarized for each quarter of the night (each 120 minutes) and Wilcoxon signed-rank tests were used to compare RD vs LD conditions. To assess whether sleep onset latency was associated with arousal frequency during the course of the night, we used mixed-effect regression analysis with arousal frequency as the outcome and sleep onset latency, time of night, and their interaction term as covariates. Sleep onset latency during each night was dichotomized as high or low (> or ≤ the median of 11.5 minutes). To further investigate whether dinner timing modified this relationship, we included an interaction term for sleep onset latency, time of night, and dinner timing.
Results
We enrolled 20 healthy volunteers (10 males and 10 females). The mean age was 26 years (SD 2.7) and the average BMI was 23.2 kg/m2 (SD 3.1). Details regarding the clinical traits of our study cohort and the nutritional contents of ingested meals were previously reported.7 Sleep parameters in the free-living environment as assessed by wrist actigraphy for 1 week prior to each inpatient visit demonstrated no differences in the participants’ total sleep time, sleep efficiency, and WASO between the 2 visits (p>0.05). Specifically, the average total sleep time was 365.1 ± 20.8 minutes before RD and 367.8 ± 14.6 minutes before LD; the average sleep efficiency was 86.3% ± 3.5% before RD and 87.1% ± 3.4% before LD; the average WASO was 54.9 ± 11.5 minutes before RD and 51.0 ± 12.2 minutes before LD.
Conventional Sleep Staging Analysis
As previously reported, total sleep time, sleep efficiency, sleep latency, as well as whole-night sleep stage distributions were not significantly different between the 2 dinner time conditions.7 The temporal distribution of sleep stages across the night is shown in Figure 1. Participants were asleep during most of the night on both visits. As expected, stage 3 sleep peaked at 60 minutes after the start of the sleep study. At approximately 2-hour intervals, these peaks recurred at progressively decreasing height throughout the night. The initial stage 3 sleep peak was greater during the first period after LD compared to after RD. REM sleep occurred initially between 60 and 90 minutes and accounted for an increasing proportion of the recording time over the night. The percentages of time spent in each sleep stage per quarter of the night for RD and LD visits are presented in Table 1 and Supplemental Figure 1. The majority of these comparisons did not reach statistical significance. In the second quarter of the night, the percentage of stage 2 sleep was significantly higher after LD (49.0% vs 36.5% for LD vs RD; p=0.0056). In the third quarter of the night, the percentage of REM sleep was significantly higher after LD (28.1% vs 21.9% for LD vs RD; p=0.035).
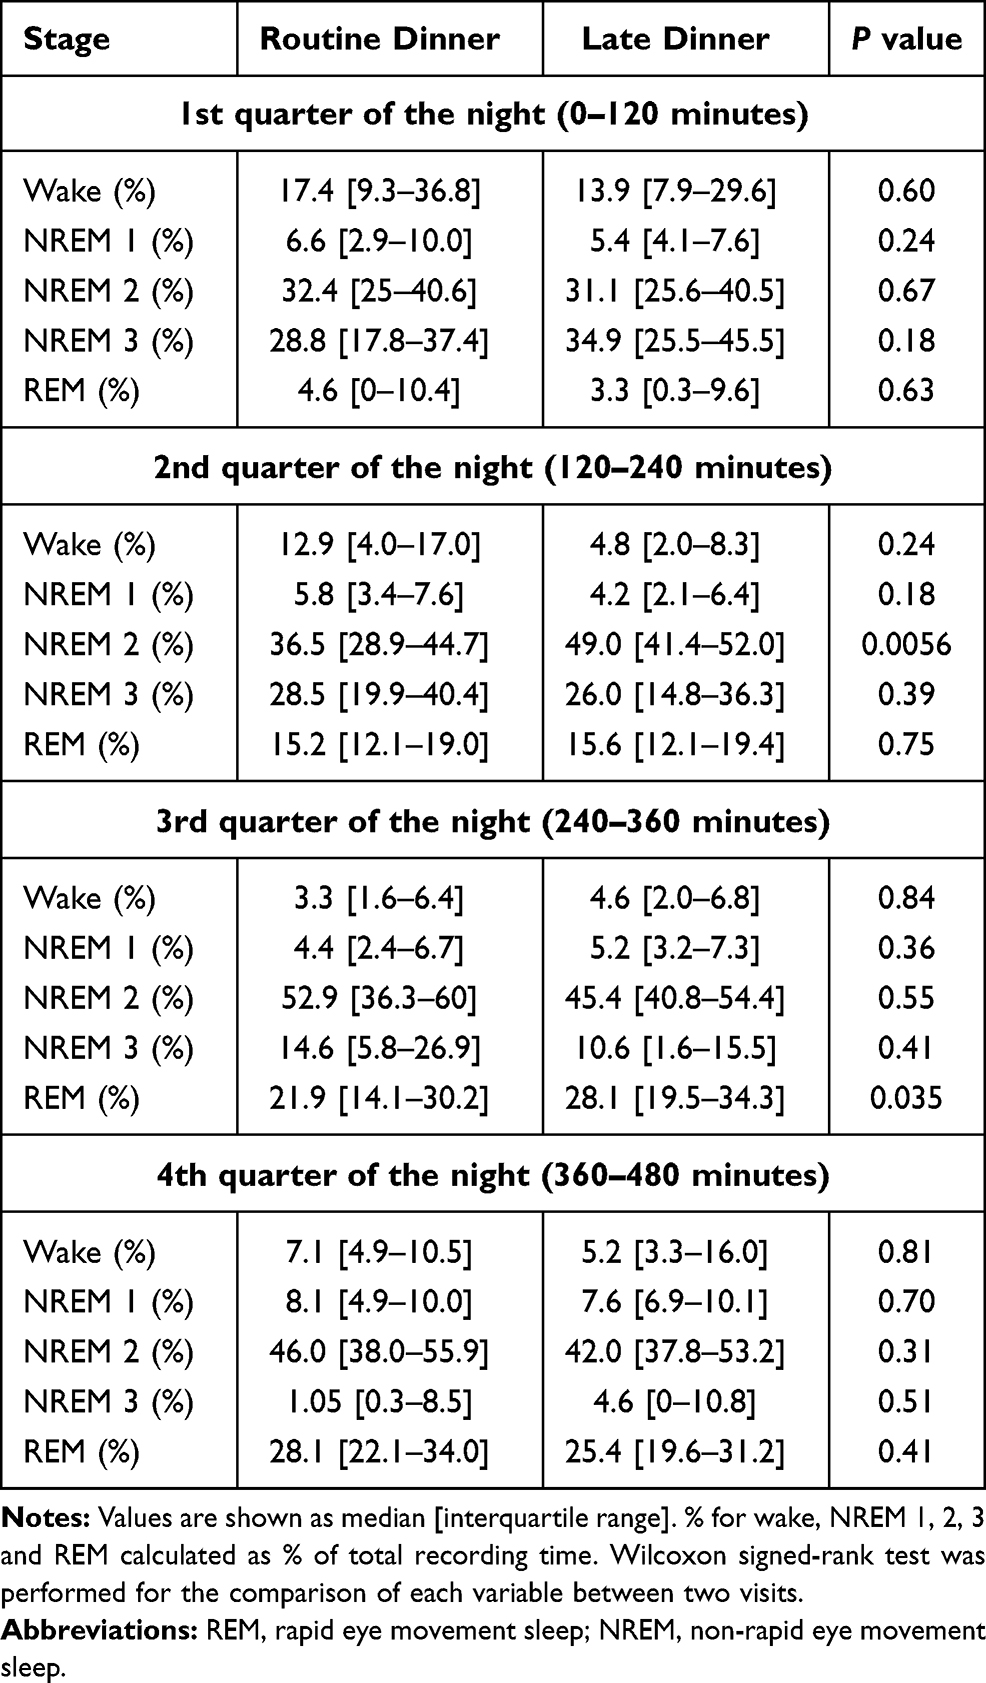 |
Table 1 Percentages of Time Spent in Each Sleep Stage in Each Quarter of the Night |
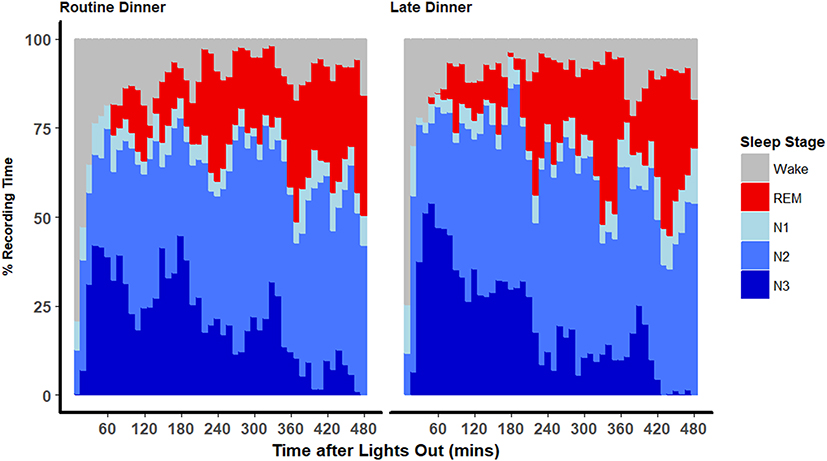 |
Figure 1 Distributions of sleep stages throughout the night. Stacked area plot of the proportions of sleep stages among all participants as a function of time of the night (from time at lights out at 23:00 until next morning at 7:00) calculated at 10-minute intervals. |
EEG Spectral Power Analysis
Temporal analysis of polysomnogram EEG demonstrated distinct patterns of spectral power between RD and LD visits (Figure 2). In the beginning of the night, LD increased the percentage of delta power and reduced percentages of alpha and beta power relative to RD, and these differences attenuated in the latter part of the night. We used mixed-effect spline regression models, with knots placed at 60-minute intervals, to assess this temporal relationship, with the outcomes being the proportions of each spectral band and covariates being dinner timing (ie, LD or RD), time of night (ie, time from lights out), and their interaction (Table 2). We observed a significant temporal effect of dinner timing on EEG spectral power bands throughout the night. Specifically, LD increased delta power by 2.54%, and this increase diminished by 0.5% for every hour thereafter, until this eventually reversed at ~302 minutes into the night when delta power became higher for RD than LD. Conversely, LD decreased alpha power by 1.42% at the beginning of the night, which diminished by 0.24% for every hour thereafter. This relationship was also reversed at ~245 minutes into the night, after which alpha power became higher for LD than RD. Similarly, LD decreased beta power by 1.32% at the beginning of the night. This effect was also modified by time of night as shown by the significant interaction terms for dinner timing and time of night. Graphical representation of the spline regression models for each spectral band is shown in Figure 3. Sensitivity analysis of knots at intervals varying between 10 and 120 minutes in these mixed-effect spline regression models did not change our findings (data not shown). Additional sensitivity analyses by incorporating random slopes into our regression models also did not alter our findings (data not shown). Taken together, our findings suggest that LD initially caused a modest increase in sleep depth and this effect diminished over the ensuing hours of sleep.
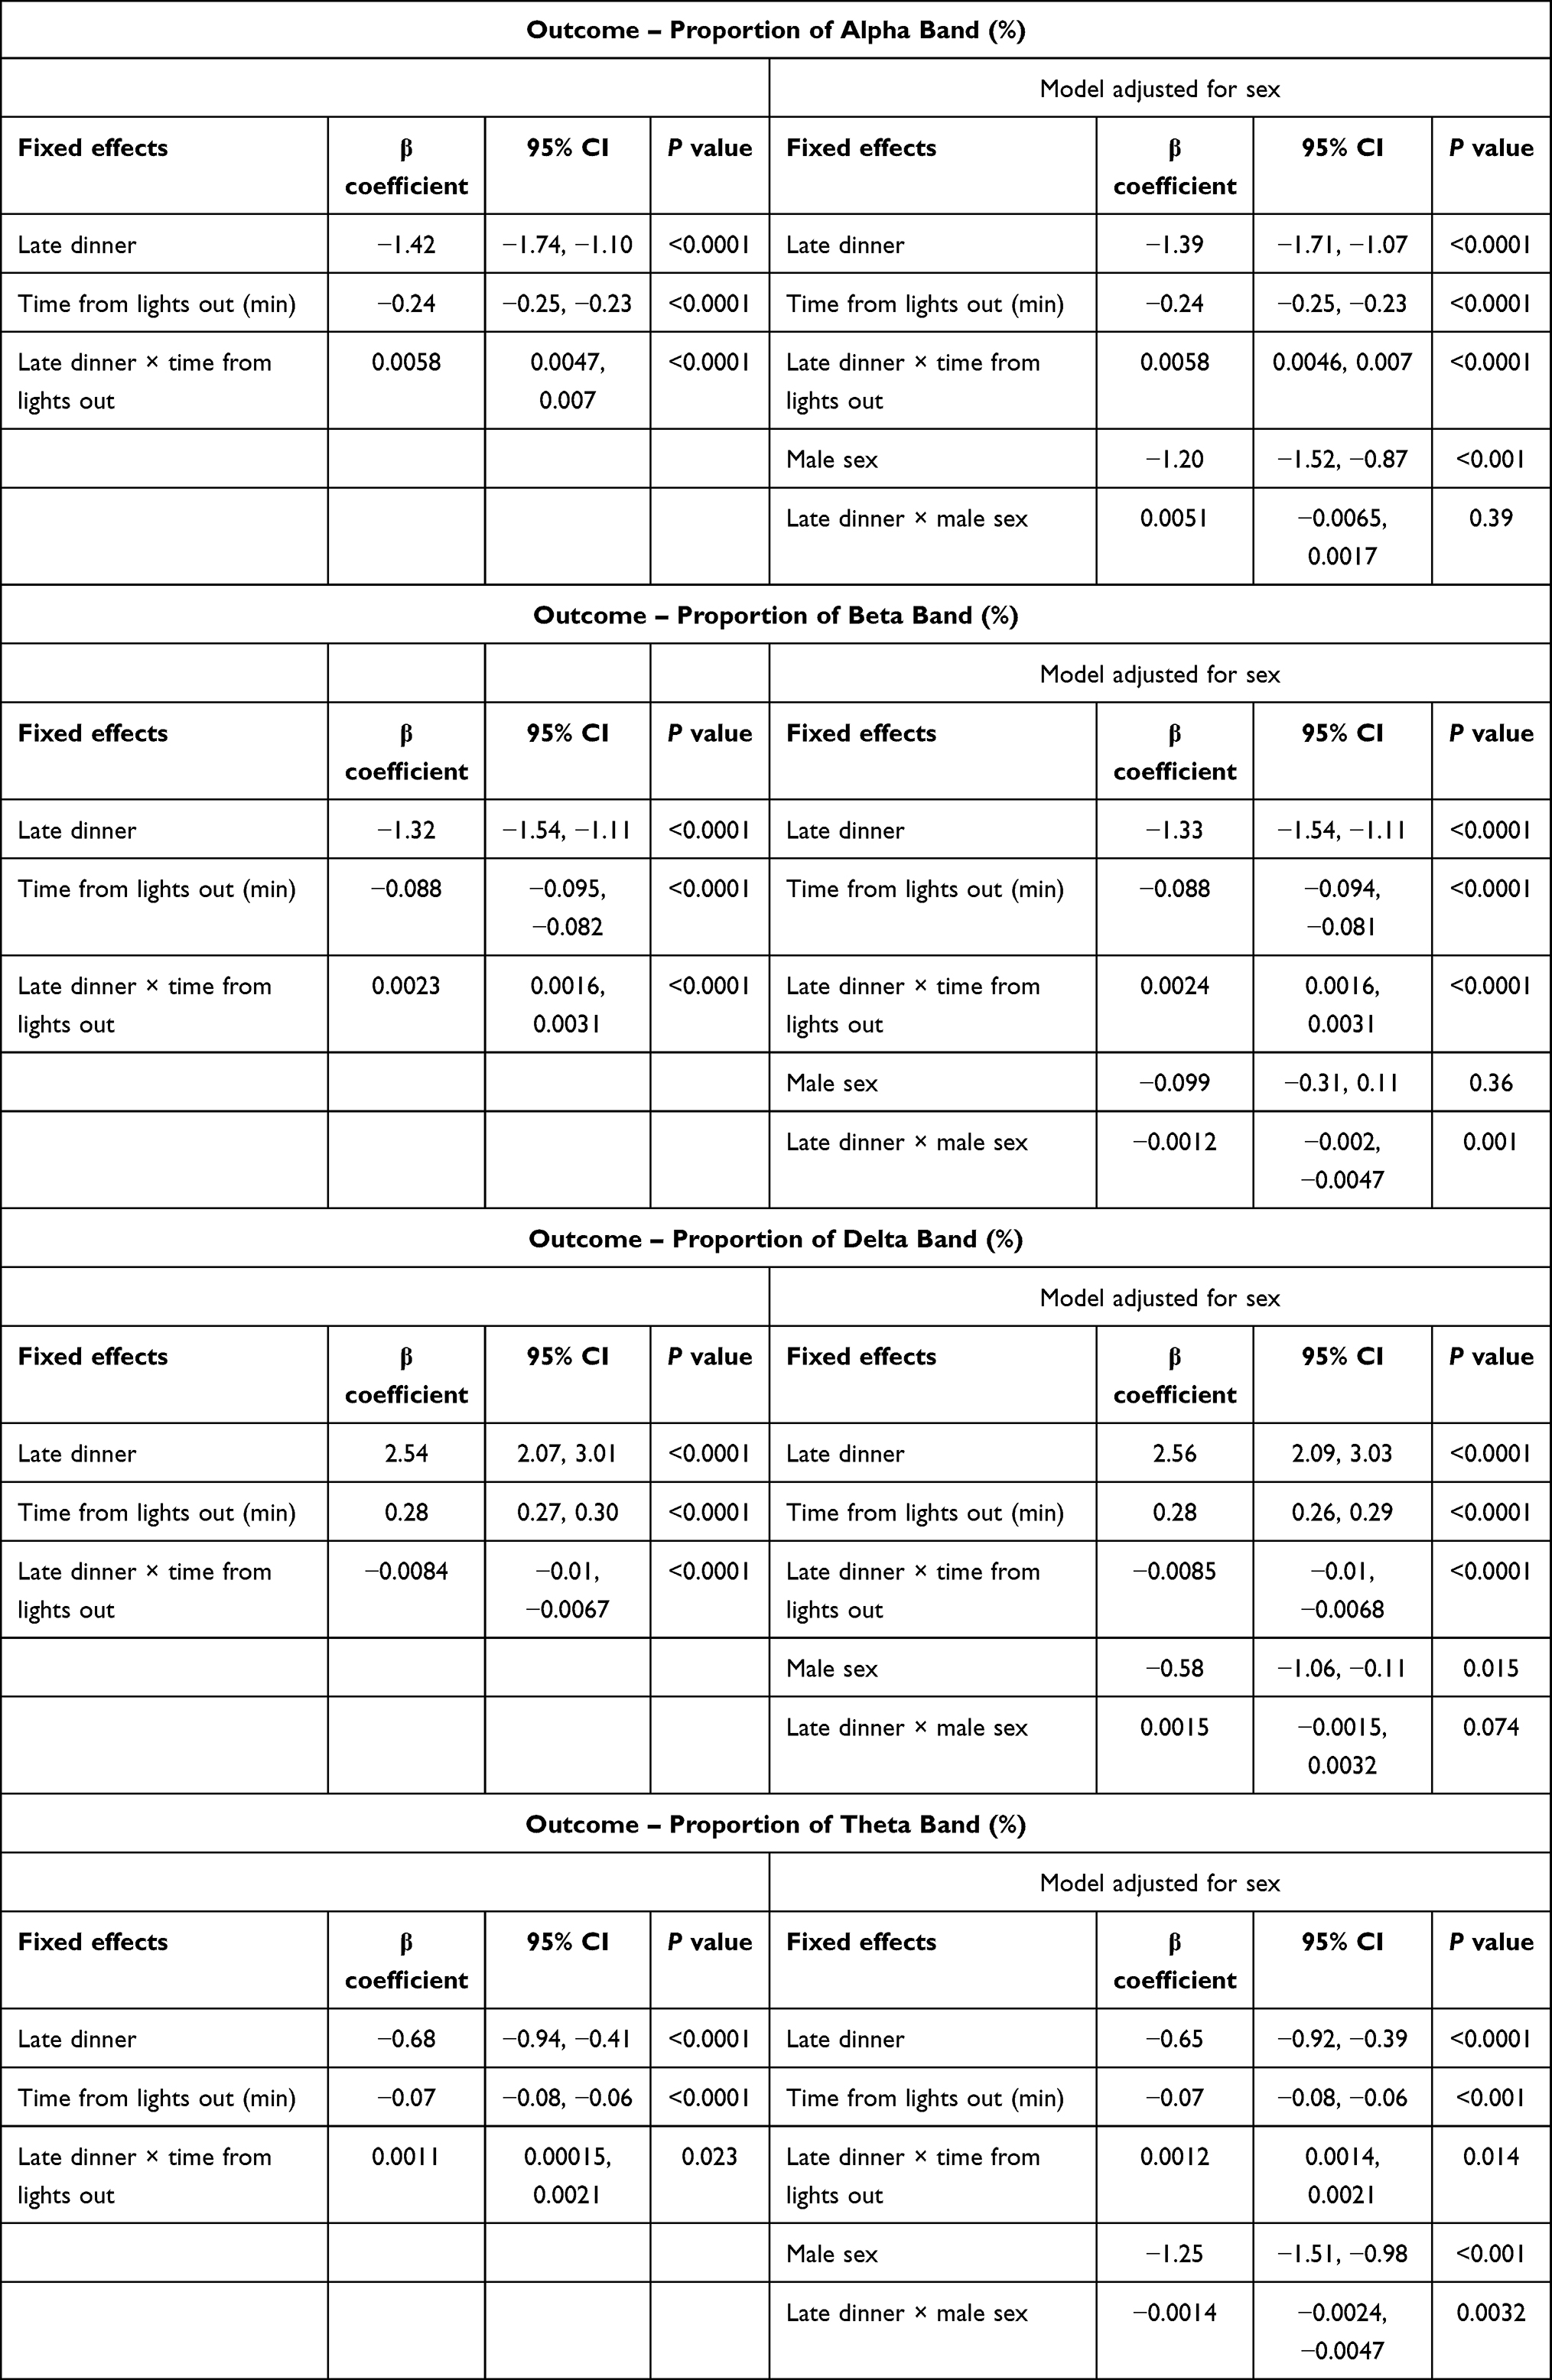 |
Table 2 Mixed-Effect Spline Regression Models of EEG Spectral Power Distributions |
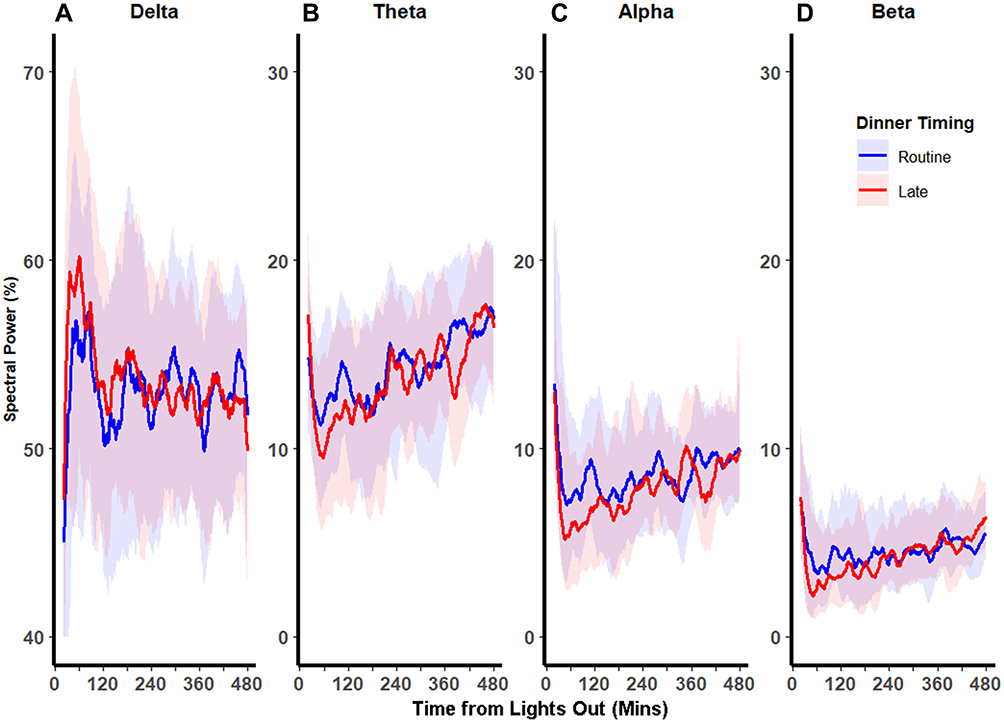 |
Figure 2 Distributions of EEG spectral power bands throughout the night. Median percentages (solid red and blue lines) and interquartile ranges (shaded red and blue areas) for each spectral power band over the course of the night (from time at lights out at 23:00 until next morning at 7:00) are shown. In the beginning of the night, late dinner increased delta power and reduced alpha and beta power. These differences were attenuated in the latter part of the night. |
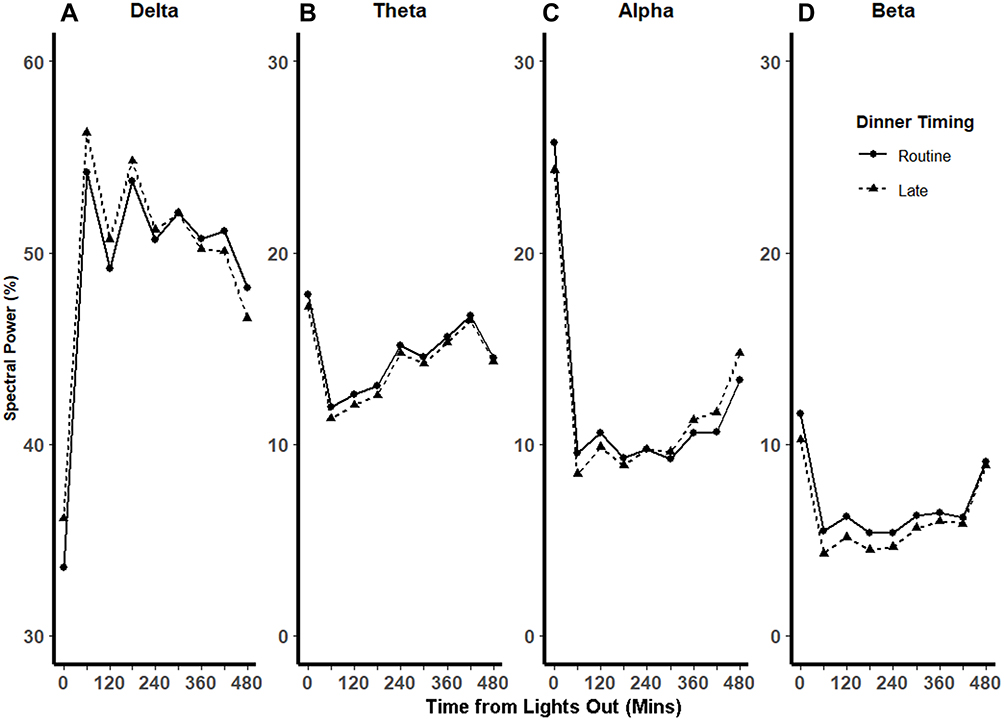 |
Figure 3 Spline regression models of the distributions of EEG spectral power bands as a function of dinner timing and time of night. Fitted mixed-effect spline regression model of mean percentages of spectral in each power band vs time from lights out after routine (solid line) and late (dashed line) dinners. Knots (circle and triangles after routine and late dinners, respectively), were placed at every 60 minutes. In the beginning of the night, late dinner was associated with increased delta power (Panel A) and reduced theta (Panel B), (Panel C) alpha, and (Panel D) beta power. In the latter part of the night, these differences were reversed for alpha and delta powers and were attenuated for beta and theta powers. |
Results of our mixed-effect regression analysis after adjustment for sex and the interaction between sex and dinner timing are shown in Table 2. The proportions of alpha, delta, and theta spectral powers were overall lower in male participants regardless of dinner timing. The addition of sex did not significantly alter the relationship between late dinner and spectral band power distributions (ie, the β coefficients for the effects of late dinner, time from lights out, and the interaction term between late dinner and time from lights out on proportions of each spectral band remained relatively unchanged). We found that men had statistically significant reductions in beta and increases in theta EEG power (p for interaction < 0.01), which suggests that men may have greater changes in sleep microarchitecture after eating a late meal. Nevertheless, these differences represented a small fraction of the effect of late dinner.
Arousal Frequency Analysis
Arousal frequencies in each quarter of the night for both dinner timing conditions are shown in Figure 4. Overall, the arousal frequencies decreased over the course of the night for both dinner time conditions. We did not find a significant difference in arousal frequencies between LD and RD during any quarter of the night. Mixed-effect regression analysis demonstrated that overall, high sleep onset latency was associated with increased arousal frequency in the beginning of the night and this effect diminished as the night progressed. Notably, dinner timing did not modify this pattern (p > 0.05; data not shown).
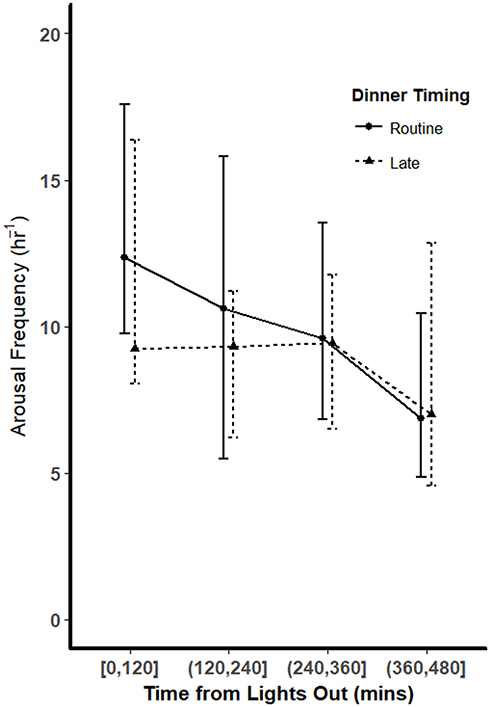 |
Figure 4 Arousal frequencies throughout the night. Arousal frequencies (number of arousal periods per hour of sleep) were tallied for each quarter of the night (each 120 minutes) for both routine dinner (solid line) and late dinner (dashed line) conditions. Overall, the arousal frequencies decreased over the course of the night. There were no significant differences in arousal frequencies between the 2 dinner conditions in any quarter of the night (p > 0.05 using Wilcoxon signed-rank tests). |
Discussion
In young healthy volunteers, we found that shifting dinner from 5 hours before sleep (RD) to 1 hour before sleep (LD) did not adversely affect objective measures of overnight sleep architecture. In fact, conventional sleep stages were similar between these 2 conditions. Furthermore, EEG spectral analysis revealed that LD caused an increase in delta power with a reciprocal decrease in combined alpha and beta power in the beginning of the night. These effects diminished over the course of the night, with an eventual reversal of these patterns in the latter part of the night. Thus, we demonstrated that shifting dinner closer to the sleep period induced a deeper sleep in the beginning of the night. To our knowledge, this is the first study to monitor and model the effects of controlled food intake on sleep architecture continuously throughout overnight sleep.
To date, most investigations into the acute effects of diet on sleep have focused on the effects of macronutrients on subsequent sleep quality but not on the timing of the meal on objective measures of overnight sleep.19 For example, Jalilolghadr et al examined the effect of a high vs low glycemic index beverage in children, given one hour before bedtime. They reported that the arousal index was modestly increased after the high index beverage in the first half of the night.20 Other studies found that high carbohydrate/low fat diets were associated with shorter sleep latency,21 decreased slow wave sleep (SWS), and augmented REM sleep,22,23 while low carbohydrate/high fat diets increased SWS and decreased REM sleep.22,24 In contrast, no significant differences in subjective or objective sleep parameters were found in 7 men given a high-energy meal (37% fat), a normal-energy (13% fat) meal, or no meal two hours before bedtime.25 Orr et al studied 10 men in a laboratory, providing a test meal at 15:00 followed by four 20-min sleep latency tests at hourly intervals. The test meal was comprised of high-fat, high-carbohydrate, mixed composition, or an equivalent volume of water in random order. While solid food reduced sleep latencies relative to water for up to 3 hours post-ingestion, the different meal constituents did not influence postprandial sleepiness.26
Impacts of altered eating time on sleep have been studied in the context of Ramadan,27 which involves fasting from dawn to sunset and eating 2–3 meals after sunset. Several studies report a decrease in REM sleep during Ramadan fasting.28–30 One possibility for this finding may be that the predawn meal interrupts sleep at a time when REM sleep usually predominates. By contrast, we found that LD increased REM sleep during the third quarter of the night. It is unclear whether common pathways are involved in altering REM sleep in our study, given significant differences in voluntary diet and sleep behaviors associated with Ramadan.
The initial deeper sleep following LD that we observed might be a manifestation of postprandial somnolence, colloquially referred to as “food coma”. Several theories have been postulated to explain postprandial somnolence, though supporting evidence is inconsistent and/or inadequate.31 From an evolutionary standpoint, the ability to augment arousal while seeking food during periods of nutritional depletion is essential for survival. Hypothalamic peptides called orexins (or hypocretins) produced in the lateral hypothalamus may serve as a critical link between energy and sleep homeostasis. Orexinergic neurons are involved in the maintenance of arousal and are activated by fasting-related metabolic cues including increased ghrelin and decreased extracellular glucose concentration.32,33 Yamanaka et al also demonstrated that during periods of food deprivation, orexin neuron-ablated mice did not exhibit the fasting-induced arousal behaviors seen in wild-type mice.32 In our study, the reversal of spectral power that we observed over time may have been caused by a transition to the fasting state or by expenditure of the homeostatic sleep drive in the first part of the night.
In a complementary manner, satiety cues, arising from both central and peripheral sources, may promote sleep. Orexin neurons are inhibited by increased extracellular glucose concentration and leptin, a satiety hormone secreted by adipose tissues.32,33 Furthermore, Varin et al showed that infusion of glucose into the ventrolateral preoptic nucleus of mice increased excitability of glucose-sensing neurons while promoting SWS.34 Kim et al suggested that the arcuate nucleus integrates satiety signals from the gut and vagus nerve and subsequently inhibits the lateral hypothalamic arousal centers.31 This pathway may be relevant to the aforementioned study by Orr et al describing shorter sleep latency after solid food compared to water intake.26 Similarly, nocturnal intraperitoneal administration of peptide tyrosine tyrosine (PYY), an anorexigenic gut hormone, reduced wakefulness and enhanced non-REM sleep in rats.35 Lastly, orexin neurons are also inhibited by increases in body temperature,36 which can occur in the context of diet-induced thermogenesis after food intake and can serve as a signal for food availability.
Diet can also impact circadian rhythm, which in turn may influence sleep. Animal studies have shown that nutrients, such as high fat or high sugar intake, can induce changes in clock gene expression in both central and peripheral tissues.37 In contrast, a 5-hour delay in meals for 6 days in 10 healthy young men shifted human peripheral clock rhythm in adipose tissue but did not change central clock outputs.6 Given that the circadian regulation of sleep is a function of the central pacemaker, the impact of diet on circadian rhythm is unlikely to be relevant to our findings. Furthermore, we do not suspect a significant shift in the central or peripheral clocks of the participants in our study, as we only altered meal times for one day and used a fixed (23:00) lights-out time for both eating conditions.
The impact of LD on sleep we found were modest. In fact, we did not detect overt changes in sleep architecture in these healthy volunteers, who all had high sleep efficiency and short WASO intervals from the actigraphy data, and thus may be resistant to effects of diet manipulation. The effects of food timing on susceptible persons remain unknown, however. Since patients with chronic primary insomnia exhibit less delta power and more beta and alpha spectral powers at sleep onset,38–40 the effects of food intake on sleep initiation may have therapeutic potential. In fact, 8 weeks of cognitive behavioral therapy for insomnia has been shown to increase slow wave activity (in the range of delta frequency band) and reduce beta activity with corresponding improvements in subjective sleep quality,41 similar to our findings with LD in the beginning of the night. Thus, pre-sleep meals may have a beneficial effect for patients with sleep initiation insomnia. Patients with eating disorders such as anorexia nervosa commonly exhibit insomnia and impaired sleep architecture which may be related to inadequate food intake.42,43 More clinical investigations are needed to evaluate the effects of food timing on insomnia or hypersomnia syndrome.
Our study had several limitations that warrant discussion. First, the small sample size may limit generalizability of our findings. Additionally, while our sex-adjusted analyses demonstrated that male sex was associated with reduced spectral power of alpha, delta, and theta bands, which is consistent with findings of other studies,44 the effect of sex on the within-subject changes in spectral power between RD and LD was only significant for beta and theta bands. It is possible that our small sample size may have limited power in detecting a difference by sex on the changes in sleep architecture induced by LD compared to RD, but this is unlikely given the overall small β coefficients for the interaction term between sex and each spectral band power. Second, this was a single night, laboratory-based study, which may not reflect sleep in a home setting, or the effects of habitual eating and sleeping behaviors. Furthermore, one day of controlled food intake may not have been long enough to fully characterize changes in sleep homeostasis. Third, we did not determine whether EEG changes translated to subjective changes in sleep quality. Nevertheless, Gabryelska et al have previously demonstrated a limited association between subjective sleep quality and EEG power spectral variables in healthy individuals.45 In another study in patients with chronic tinnitus, a correlation between lower delta frequency band and higher subjective sleep complaints was observed.46 Fourth, we did not measure gut hormones or hunger levels that might have played a role in the sleep architecture changes. However, we believe it unlikely that hunger and satiety hormones contributed to the lighter sleep we found in the latter half of the night. Fifth, we acknowledge that our relatively prolonged wash-out period of 3–4 weeks could introduce variables such as changes in the participants’ dietary and/or sleep habits. Notably, our study protocol required the participants to adhere to a regular sleep-wake cycle and eating pattern for the week prior to each admission. Reassuringly, analysis of the 1-week actigraphy data obtained prior to each admission demonstrated no differences in habitual sleep timing or duration between the 2 visits.7 However, we did not collect information related to the participants’ habitual dinner time, which could influence changes in sleep architecture with LD. Lastly, our study did not evaluate whether shifting the timing of particular macronutrient components would have differential effects on sleep architecture.
Conclusion
In conclusion, contrary to the existing literature, shifting dinner timing from 5 hours before sleep to 1 hour before sleep in healthy volunteers did not result in adverse changes in overnight sleep architecture. In-depth spectral analysis revealed that eating right before sleep increased delta power and decreased alpha and beta power in the beginning of the night. This pattern gradually attenuated over time and was later reversed in the latter part of the night. This novel manifestation of postprandial hypersomnia may have clinical significance in patients with sleep disorders. Future studies are necessary to determine whether altering timing of food and specific macronutrients could treat sleep disorders, including insomnia and circadian rhythm disorders.
Clinical Trial Details
Name: Effect of Late Dinner on Nocturnal Metabolism
URL: https://clinicaltrials.gov/ct2/show/study/NCT03525717
Registration Number: NCT03525717.
Abbreviations
BMI, body mass index; EEG, electroencephalogram; LD, late dinner; NREM, non-rapid eye movement; PSG, polysomnography; PYY, peptide tyrosine tyrosine; RD, routine dinner; REM, rapid eye movement; SWS, slow wave sleep; WASO, wake after sleep onset.
Data Sharing Statement
The dataset containing deidentified participant data generated during and/or analyzed during the current study is not publicly available but is available from the corresponding author on reasonable request.
Funding
National Institutes of Health 5T32HL110952 (D. Duan). American Heart Association Postdoctoral Fellowship Award 20POST35210763 (C. Gu). National Institutes of Health R01HL135483 (J. Jun). American Thoracic Society Unrestricted Grant (L. Pham).
Disclosure
The author reports no conflicts of interest in this work.
References
1. Wells AS, Read NW, Idzikowski C, Jones J. Effects of meals on objective and subjective measures of daytime sleepiness. J Appl Physiol. 1998;84(2):507–515. doi:10.1152/jappl.1998.84.2.507
2. Zammit GK, Kolevzon A, Fauci M, Shindledecker R, Ackerman S. Postprandial sleep in healthy men. Sleep. 1995;18(4):229–231.
3. Crispim CA, Zimberg IZ, Dos Reis BG, Diniz RM, Tufik S, de Mello MT. Relationship between food intake and sleep pattern in healthy individuals. J Clin Sleep Med. 2011;07(06):659–664. doi:10.5664/jcsm.1476
4. Yamaguchi M, Uemura H, Katsuura-Kamano S, et al. Relationship of dietary factors and habits with-sleep-wake regularity. Asia Pac J Clin Nutr. 2013;22(3):457–465. doi:10.6133/apjcn.2013.22.3.01
5. Gabel K, Hoddy K, Burgess H, Varady K. Effect of 8-hour time-restricted feeding on sleep quality and duration in adults with obesity. Appl Physiol Nutr Metabol. 2019;44(8):903–905. doi:10.1139/apnm-2019-0032
6. Wehrens SMT, Christou S, Isherwood C, et al. Meal timing regulates the human circadian system. Curr Biol. 2017;27(12):1768–1775.e3. doi:10.1016/j.cub.2017.04.059
7. Gu C, Brereton N, Schweitzer A, et al. Metabolic effects of late dinner in healthy volunteers—a randomized crossover clinical trial. J Clin Endocrinol Metab. 2020;105(8):dgaa354. doi:10.1210/clinem/dgaa354
8. Feige B, Baglioni C, Spiegelhalder K, Hirscher V, Nissen C, Riemann D. The microstructure of sleep in primary insomnia: an overview and extension. Int J Psychophysiol. 2013;89(2):171–180. doi:10.1016/j.ijpsycho.2013.04.002
9. Spiegelhalder K, Regen W, Feige B, et al. Increased EEG sigma and beta power during NREM sleep in primary insomnia. Biol Psychol. 2012;91(3):329–333. doi:10.1016/j.biopsycho.2012.08.009
10. de Boer M, Nijdam MJ, Jongedijk RA, et al. The spectral fingerprint of sleep problems in post-traumatic stress disorder. Sleep. 2020;43(4):zsz269. doi:10.1093/sleep/zsz269
11. Tasali E, Leproult R, Ehrmann DA, Van Cauter E. Slow-wave sleep and the risk of type 2 diabetes in humans. Proc Natl Acad Sci U S A. 2008;105(3):1044–1049. doi:10.1073/pnas.0706446105
12. Moser D, Anderer P, Gruber G, et al. Sleep classification according to AASM and Rechtschaffen & Kales: effects on sleep scoring parameters. Sleep. 2009;32(2):139–149. doi:10.1093/sleep/32.2.139
13. Cole RJ, Kripke DF, Gruen W, Mullaney DJ, Gillin JC. Automatic sleep/wake identification from wrist activity. Sleep. 1992;15(5):461–469. doi:10.1093/sleep/15.5.461
14. Mifflin MD, St Jeor ST, Hill LA, Scott BJ, Daugherty SA, Koh YO. A new predictive equation for resting energy expenditure in healthy individuals. Am J Clin Nutr. 1990;51(2):241–247. doi:10.1093/ajcn/51.2.241
15. Frankenfield DC, Rowe WA, Smith JS, Cooney RN. Validation of several established equations for resting metabolic rate in obese and nonobese people. J Am Diet Assoc. 2003;103(9):1152–1159. doi:10.1016/S0002-8223(03)00982-9
16. Jasper HH. The ten twenty system of the international federation. Electroencephalogr Clin Neurophysiol. 1958;10:371–375.
17. Iber C, Ancoli-Israel S, Chesson AL, Quan SF. The AASM Manual for the Scoring of Sleep and Associated Events: Rules, Terminology and Technical Specifications.
18. Zhang L, Samet J, Caffo B, Bankman I, Punjabi NM. Power spectral analysis of EEG activity during sleep in cigarette smokers. Chest. 2008;133(2):427–432. doi:10.1378/chest.07-1190
19. St-Onge M-P, Mikic A, Pietrolungo CE. Effects of diet on sleep quality. Adv Nutr. 2016;7(5):938–949. doi:10.3945/an.116.012336
20. Jalilolghadr S, Afaghi A, O’Connor H, Chow CM. Effect of low and high glycaemic index drink on sleep pattern in children. J Pak Med Assoc. 2011;61(6):4.
21. Lindseth G, Lindseth P, Thompson M. Nutritional effects on sleep. West J Nurs Res. 2013;35(4):497–513. doi:10.1177/0193945911416379
22. Phillips F, Crisp AH, Mcguinness B, et al. Isocaloric diet changes and electroencephalographic sleep. Lancet. 1975;306(7938):723–725. doi:10.1016/S0140-6736(75)90718-7
23. Yajima K, Seya T, Iwayama K, et al. Effects of nutrient composition of dinner on sleep architecture and energy metabolism during sleep. J Nutr Sci Vitaminol. 2014;60(2):114–121. doi:10.3177/jnsv.60.114
24. Afaghi A, O’Connor H, Chow CM. Acute effects of the very low carbohydrate diet on sleep indices. Nutr Neurosci. 2008;11(4):146–154. doi:10.1179/147683008X301540
25. Driver H, Shulman I, Baker F, Buffenstein R. Energy content of the evening meal alters nocturnal body temperature but not sleep. Physiol Behav. 1999;68(1–2):17–23. doi:10.1016/S0031-9384(99)00145-6
26. Orr WC, Shadid G, Harnish MJ, Elsenbruch S. Meal composition and and its effect on postprandial sleepiness. Physiol Behav. 1997;62(4):709–712. doi:10.1016/S0031-9384(97)00012-7
27. Almeneessier AS, BaHammam AS. How does diurnal intermittent fasting impact sleep, daytime sleepiness, and markers of the biological clock? Current insights. NSS. 2018;10:439–452. doi:10.2147/NSS.S165637
28. Roky R, Chapotot F, Hakkou F, Benchekroun MT, Buguet A. Sleep during Ramadan intermittent fasting. J Sleep Res. 2001;10(4):319–327. doi:10.1046/j.1365-2869.2001.00269.x
29. Bahammam A. Effect of fasting during Ramadan on sleep architecture, daytime sleepiness and sleep pattern. Sleep Biol Rhythms. 2004;2(2):135–143. doi:10.1111/j.1479-8425.2004.00135.x
30. BaHammam AS, Almushailhi K, Pandi-Perumal SR, Sharif MM. Intermittent fasting during Ramadan: does it affect sleep? J Sleep Res. 2014;23(1):35–43. doi:10.1111/jsr.12076
31. Kim SW, Lee BI. Metabolic state, neurohormones, and vagal stimulation, not increased serotonin, orchestrate postprandial drowsiness. Biosci Hypotheses. 2009;2(6):422–427. doi:10.1016/j.bihy.2009.07.008
32. Yamanaka A, Beuckmann CT, Willie JT, et al. Hypothalamic orexin neurons regulate arousal according to energy balance in mice. Neuron. 2003;38(5):701–713. doi:10.1016/S0896-6273(03)00331-3
33. Burdakov D, Gerasimenko O, Verkhratsky A. Physiological changes in glucose differentially modulate the excitability of hypothalamic melanin-concentrating hormone and orexin neurons in situ. J Neurosci. 2005;25(9):2429–2433. doi:10.1523/JNEUROSCI.4925-04.2005
34. Varin C, Rancillac A, Geoffroy H, Arthaud S, Fort P, Gallopin T. Glucose induces slow-wave sleep by exciting the sleep-promoting neurons in the ventrolateral preoptic nucleus: a new link between sleep and metabolism. J Neurosci. 2015;35(27):9900–9911. doi:10.1523/JNEUROSCI.0609-15.2015
35. Akanmu MA, Ukponmwan OE, Katayama Y, Honda K. Neuropeptide-Y Y2-receptor agonist, PYY3–36 promotes non-rapid eye movement sleep in rat. Neurosci Res. 2006;54(3):165–170. doi:10.1016/j.neures.2005.11.006
36. Parsons MP, Belanger-Willoughby N, Linehan V, Hirasawa M. ATP-sensitive potassium channels mediate the thermosensory response of orexin neurons: orexin neurons are thermosensitive. J Physiol. 2012;590(19):4707–4715. doi:10.1113/jphysiol.2012.236497
37. Oosterman JE, Kalsbeek A, la Fleur SE, Belsham DD. Impact of nutrients on circadian rhythmicity. Am J Physiol Regulat Integr Comparat Physiol. 2015;308(5):R337–R350. doi:10.1152/ajpregu.00322.2014
38. Merica H, Gaillard J-M. The EEG of the sleep onset period in insomnia: a discriminant analysis. Physiol Behav. 1992;52(2):199–204. doi:10.1016/0031-9384(92)90258-4
39. Lamarche CH, Ogilvie RD. Electrophysiological changes during the sleep onset period of psychophysiological insomniacs. Psychiatric insomniacs, and normal sleepers. Sleep. 1997;20(9):726–733. doi:10.1093/sleep/20.9.726
40. Staner L, Cornette F, Maurice D, et al. Sleep microstructure around sleep onset differentiates major depressive insomnia from primary insomnia: sleep microstructure around sleep onset. J Sleep Res. 2003;12(4):319–330. doi:10.1046/j.0962-1105.2003.00370.x
41. Cervena K, Dauvilliers Y, Espa F, et al. Effect of cognitive behavioural therapy for insomnia on sleep architecture and sleep EEG power spectra in psychophysiological insomnia. J Sleep Res. 2004;13(4):385–393. doi:10.1111/j.1365-2869.2004.00431.x
42. Levy AB, Dixon KN, Schmidt H. REM and delta sleep in anorexia nervosa and bulimia. Psychiatry Res. 1987;20(3):189–197. doi:10.1016/0165-1781(87)90078-3
43. Delvenne V, Kerkhofs M, Appelboom-Fondu J, Lucas F, Mendlewicz J. Sleep polygraphic variables in anorexia nervosa and depression: a comparative study in adolescents. J Affect Disord. 1992;25:167–172. doi:10.1016/0165-0327(92)90002-N
44. Hertenstein E, Gabryelska A, Spiegelhalder K, et al. Reference data for polysomnography-measured and subjective sleep in healthy adults. J Clin Sleep Med. 2018;14(04):523–532. doi:10.5664/jcsm.7036
45. Gabryelska A, Feige B, Riemann D, et al. Can spectral power predict subjective sleep quality in healthy individuals? J Sleep Res. 2019;28(6). doi:10.1111/jsr.12848
46. Hébert S, Fullum S, Carrier J. Polysomnographic and quantitative electroencephalographic correlates of subjective sleep complaints in chronic tinnitus: sleep complaints in tinnitus. J Sleep Res. 2011;20(1pt1):38–44. doi:10.1111/j.1365-2869.2010.00860.x
 © 2021 The Author(s). This work is published and licensed by Dove Medical Press Limited. The
full terms of this license are available at https://www.dovepress.com/terms
and incorporate the Creative Commons Attribution
- Non Commercial (unported, 3.0) License.
By accessing the work you hereby accept the Terms. Non-commercial uses of the work are permitted
without any further permission from Dove Medical Press Limited, provided the work is properly
attributed. For permission for commercial use of this work, please see paragraphs 4.2 and 5 of our Terms.
© 2021 The Author(s). This work is published and licensed by Dove Medical Press Limited. The
full terms of this license are available at https://www.dovepress.com/terms
and incorporate the Creative Commons Attribution
- Non Commercial (unported, 3.0) License.
By accessing the work you hereby accept the Terms. Non-commercial uses of the work are permitted
without any further permission from Dove Medical Press Limited, provided the work is properly
attributed. For permission for commercial use of this work, please see paragraphs 4.2 and 5 of our Terms.