Back to Journals » Diabetes, Metabolic Syndrome and Obesity » Volume 17
Effects of 12-Week Combined Strength and Endurance Circuit Training Program on Insulin Sensitivity and Retinol-Binding Protein 4 in Women with Insulin-Resistance and Overweight or Mild Obesity: A Randomized Controlled Trial
Authors Ratajczak M ![]() , Krzywicka M, Szulińska M, Musiałowska D, Kusy K
, Krzywicka M, Szulińska M, Musiałowska D, Kusy K ![]() , Karolkiewicz J
, Karolkiewicz J
Received 29 July 2023
Accepted for publication 19 December 2023
Published 6 January 2024 Volume 2024:17 Pages 93—106
DOI https://doi.org/10.2147/DMSO.S432954
Checked for plagiarism Yes
Review by Single anonymous peer review
Peer reviewer comments 2
Editor who approved publication: Prof. Dr. Juei-Tang Cheng
Marzena Ratajczak,1 Monika Krzywicka,2 Monika Szulińska,3 Dominika Musiałowska,4 Krzysztof Kusy,5 Joanna Karolkiewicz6
1Department of Medical Biology, Poznan University of Physical Education, Poznan, 61-871, Poland; 2Department of Cardiological and Rheumatological Rehabilitation, Poznan University of Physical Education, Poznan, 61-871, Poland; 3Department of Treatment of Obesity, Metabolic Disorders and Clinical Dietetics, Poznan University of Medical Sciences, Poznan, 61-701, Poland; 4Insulin Resistance Foundation – Healthy Diet and Healthy Life, Poznan, 61-379, Poland; 5Department of Athletics Strength and Conditioning, Poznan University of Physical Education, Poznan, 61-871, Poland; 6Department of Food and Nutrition, Poznan University of Physical Education, Poznan, 61-871, Poland
Correspondence: Marzena Ratajczak, Department of Medical Biology, Poznan University of Physical Education, Poznan, 61-871, Poland, Email [email protected]
Background: Circuit training is an exercise mode, that may include both endurance and resistance components. There are premises that a combination of these two modalities brings additional benefits, particularly in improving insulin sensitivity. The retinol-binding protein 4 (RBP4) may inhibit signaling from insulin metabolic pathways in skeletal muscles, thus developing insulin resistance. This study aimed to evaluate whether moderate intensity circuit training combining strength and endurance exercise induces changes in tissue insulin sensitivity, carbohydrate and lipid metabolism, and serum RBP4 levels in insulin-resistant women.
Methods: In this clinical controlled trial women diagnosed with insulin-resistance were randomly divided into two groups. The training group (T) performed circuit training combining strength (50%-80%1RM) and endurance (50%-75%HRR) exercise on five weight and two cardio machines, for 33 minutes, three times per week, for 3 months. Women from the control non-training group (NT) did not change their previous physical activity. At the beginning of the study and after the intervention period, a one-repetition maximum, body mass, and composition, resting heart rate (HR), blood pressure, glucose, insulin, blood lipids, thyroid-stimulating hormone (TSH), insulin-like growth factor-1 (IGF-1), RBP4, and insulin resistance (HOMA-IR) were measured. The results of 27 patients were analyzed using a two-way repeated measures ANOVA.
Results: Significant differences in the pattern of change over time between the groups for resting HR (p < 0.010) and total lean mass (p < 0.039) were found. No differences in HOMA-IR, and RBP4 were observed post-study compared to pre-study in the T group. A significant correlation between RBP4 and TSH concentration was found.
Conclusion: Twelve-week circuit training combining strength and endurance exercise has minor effects on HOMA-IR, glucose and lipid metabolism, IGF-1, TSH, and RBP4. Although moderate-intensity circuit training is considered safe, its effectiveness in patients with overweight and mild obesity may be insufficient to reduce insulin resistance.
Trial Registration: ClinicalTrials.gov: NCT04528693, registered August 23, 2020.
Keywords: insulin resistance, exercise program, retinol-binding protein 4, insulin-like growth factors-1, thyroid-stimulating hormone
Introduction
In individuals with insulin resistance, it is important to tailor clinical interventions that are effective in increasing insulin sensitivity. It is well known that skeletal muscle, through the secretion of endocrine factors, communicates with key metabolic organs such as adipose tissue, liver and pancreas.1 The onset of insulin resistance at the skeletal muscle level suggests the initiation of its development, which, if left untreated, can lead to glucose intolerance and type 2 diabetes (T2DM).2,3 Insulin and exercise/muscle contraction are the major stimuli of glucose uptake in skeletal muscle. Translocation of glucose transporter type 4 (GLUT4) from an intracellular location to the plasma membrane involves complex signaling events and constitutes a major mechanism through which insulin and exercise increase skeletal muscle glucose uptake.4 Current evidence supports regular exercise training as a beneficial therapeutic strategy to improve the insulin sensitivity of skeletal muscle and the liver as well as the uptake and utilization of glucose by skeletal muscle.5 The adaptations that occur in skeletal muscle in response to exercise implicate a variety of molecular pathways, including those associated with controlling muscle contraction coupled to adenosine triphosphate (ATP) biosynthesis and energy utilization by mechanosensor and metabolic sensor activation. In turn, activated sensors transduce exercise-induced stimuli to transcription factors that ultimately activate target genes involved in glucose metabolism, lipid metabolism, and mitochondrial biogenesis.6 Insulin-stimulated cytoskeletal remodeling associated with exercise training has been shown to be critical for glucose uptake not only in skeletal muscle but also in adipocytes.3 Previous studies have indicated that even a 2% decrease in muscle mass, regardless of total body weight, may lead to an increase in HOMA-IR index by almost 40% what consequently increases the risk of developing insulin resistance.7
Despite differing mechanisms, both aerobic and anaerobic forms of regular physical exercise improve tissue insulin sensitivity, though the molecular pathways specific to different exercise modes that induce these benefits remain incompletely defined. The findings of a series of studies on this topic indicate a possible molecular switch mediated by exercise intensity, the so‐called AMPK‐Akt master switch, which partially mediates specific adaptations to endurance or resistance exercise.8,9 There are observations that, both aerobic endurance and resistance exercise can induce improvements in glycaemic regulation, with some suggestions that exercise regimens including both, may be more efficacious than either exercise mode alone.5 Recent evidence10 reinforces the idea that, due to the different adaptive effects of endurance and resistance training, a combination of the two, which is already considered the optimal exercise prescription for general health benefits, may be the most effective form of training in insulin-resistant individuals.
Collins et al11 conducting a literature review of the effects of mixed endurance and strength training on insulin sensitivity and glucose homeostasis concluded that there is still much doubt as to whether the benefits of combined training are related to the increased total volume of exercise performed or whether they are due to the mechanistic synergy of the two modes of exercise. However, results from the study, where exercise volume was comparable between the combined, endurance-only, and resistance-only groups, support the claim that combined training produces more than just additive and synergistic effects.12
Previous research has indicated a complex network by which glucose sensing through GLUT4 in muscle and fat cells may operate to integrate whole-body energy metabolism.13 Although the details of these pathways are not fully understood, recent studies have revealed an important potential role of adipokine retinol-binding protein 4 (RBP4) in inter-organ communication.14
The present study evaluated whether a 3-month therapeutic intervention incorporating both strength and endurance exercise induces changes in tissue insulin sensitivity associated with carbohydrate and lipid metabolism and serum RBP4 levels in women with overweight and mild obesity. We hypothesized that in women with insulin resistance, 12-week moderate intensity circuit training program will improve insulin sensitivity and carbohydrate and lipid metabolism.
Materials and Methods
Study Design
This is a prospective randomized controlled trial conducted between August 2020 and September 2022. The study adhered to the standards of the Declaration of Helsinki and was approved by the Ethics Committee at Poznan University of Medical Sciences in Poland (ref. 462/20). The research was conducted according to the Consolidated Standards of Reporting Trials guidelines for randomized controlled trials. The study protocol was registered in the ClinicalTrials.gov database (NCT04528693) and can be found at https://clinicaltrials.gov/ct2/show/NCT04528693?term=NCT04528693&draw=2&rank=1.
Forty-two women who met the inclusion criteria were randomly divided into two groups (allocation ratio: 1:2). Randomization was performed by an independent researcher using the Microsoft Excel RAND function. Blinding of samples and patients was used for biochemical and body composition analysis, where the researchers did not know the allocation of samples/patients. The training group (T) performed a circuit training program encompassing strength exercise interspersed with bouts of endurance exercise carried out on machines integrated with a computer software program (Milon, Germany) for 3 months, three 33-min session each week. The participants in the control non-training group (NT) maintained their current level of physical activity for 3 months what was confirmed by physical activity questionnaire and lack of changes in body composition and strength gains and usual energy intake.
At the beginning of the study and after the intervention period, anthropometric and body composition measurements, a one-repetition maximum (1RM) resistance test, physiological and biochemical indicator analyses related to insulin sensitivity and carbohydrate and lipid metabolism were performed in both groups.
Inclusion and Exclusion Criteria
Participants were recruited through advertisements on the Polish Insulin Resistance Foundation – Healthy Diet and Healthy Life website. Prior to inclusion, all patients underwent medical examinations at the Department of Treatment of Obesity, Metabolic Disorders and Clinical Dietetics, Poznan University of Medical Sciences. All volunteers were introduced to the study’s purpose and protocols and gave their written consent to participate in the research.
At the beginning of the study, all study subjects had venous blood samples drawn to determine fasting glucose and insulin levels. Insulin resistance was calculated using the homeostasis model assessment of insulin resistance (HOMA-IR).15 For participants with fasting plasma glucose levels from 3.0 to 25.0 mmol/L and fasting insulin levels from 3 to 55 mU/mL, glycosylated hemoglobin (HbA1c) was determined to define dysglycemia based on standard HbA1c thresholds.16 Specifically, T2DM was diagnosed in the presence of one or more of the following:
Eligible participants were included in the study if they met the following criteria:
- Women, aged 25–45 years,
- Body mass index (BMI) of 25–33 kg/m2,
- HOMA-IR ≥ 2.0,
- No contraindications to physical activity.
Patients with any the following were excluded from the study:
- Menopause,
- Metformin treatment less than 3 months before or during the study,
- Both types 1 and 2 diabetes,
- Poorly controlled hypertension (mean systolic blood pressure > 140 mmHg and/or mean diastolic blood pressure > 90 mmHg) over the previous month and/or need to modify pharmacological treatment,
- Obesity, with BMI > 33 kg/m2,
- Lipid disorders requiring implementation of pharmacological treatment in the 3 months before or during the study,
- A positive history of ischemic heart disease, carotid atherosclerosis, and/or lower limb atherosclerosis,
- Clinically significant arrhythmias or conduction disorders,
- Chronic kidney disease,
- Clinically significant liver dysfunction,
- Acute or chronic clinically manifested inflammatory processes,
- An acute infection in the previous month,
- Cancer,
- Dietary supplement use within 1 month before or during the study,
- Medications that could interfere with the results of the tests,
- Other conditions that may pose a risk to the patient during the study.
Intervention
The exercise program undertaken by the T group consisted of circuit training including strength exercise interspersed with bouts of endurance exercise and was carried out on machines integrated with the Milon computer software. All training sessions comprised two series of exercise and were conducted on nonconsecutive days (Monday, Wednesday, and Friday) for 12 weeks. Each session had a duration of 33 minutes. The training program took place at Poznan University of Physical Education. During the first and second sessions, the participants were educated on how to use the cycling and weight machines. The length of the movement arm and the range of motion (if necessary) of the weight machines were individualized, and correct stabilization techniques during the exercises were explained. All sessions were monitored by the same team of researchers. The training program exercises were performed on seven machines in the following circuited sequence: cycle ergometer, abdominal crunch, leg curl, latissimus pulldown, cross trainer, back extension, and leg abductor. The exercise duration was controlled (1 minute for strength exercise bouts, 4 minutes for endurance exercise bouts, and a 30-second break after each bout), and the exercise load was dosed for each participant using the electronic resistance motor system. The targeted muscle groups were loaded alternately to ensure comprehensive whole-body training. In addition, the actual exercise intensity was observed during the session on the machines’ display monitors. Range of motion, exercise duration, and breaks were controlled automatically by the software system, and additional attention to these parameters was not required. Software control of the constructed circuit and the exercise duration, quantity, intensity, and frequency met the general principles of exercise prescription recommended by the American College of Sports Medicine.18
The designated strength load was gradually increased during the training program from 50% initially to 80% of the 1RM.19 The load was increased by 10% every eight training sessions (Table 1). The intensity of the endurance exercise was adjusted on an individual basis to maintain a moderate level of intensity. Training intensity was calculated using Karvonen’s method20 based on heart rate (HR) reserve (HRR):

 |
Table 1 Training Plan |
Maximum HR was calculated by the Milon CARE® software according to Ferguson’s method:19

The exercise intensity needed to cause significant adaptive changes in the cardiovascular and respiratory systems was determined to be 50–75% of the individual exercise capacity, defined as a percentage of HRR.20
Training intensity at the beginning of the program was calculated with the following formula:

Over the course of the program, training intensity was progressively increased to reach the following final intensity:

During each training session, the patient’s HR was monitored using a Polar A300 device (Polar Electro Oy, Finland) with a chest band and transmitter. The intensity load in watts was adapted or increased based on the monitored HR.
The calculated training loads were saved in the Milon CARE software system, copied to the individual chip card of each participant, and regularly controlled by the physiotherapist.
Measurements
Both study groups were instructed to maintain their usual dietary patterns and physical activity levels during the study. Dietary intake of energy was verified with 7-day food records at the beginning and end of the 12-week study period. The participants were additionally instructed not to use dietary supplements. The level of physical activity was assessed by The International Physical Activity Questionnaire21 (see Results).
Anthropometric and Body Composition Indicators
Anthropometric measurements were performed in the morning, with light clothing and without shoes. Body weight and height were measured by a medical scale with a stadiometer (seca 285, Hamburg, Germany) to the nearest 0.1 kg and 0.5 cm respectively. The BMI was calculated based on weight and height using the standard formula. Body composition was assessed using dual-energy X-ray absorptiometry (DXA; Lunar Prodigy device, GE Healthcare, Chicago, USA). Subjects were given complete instructions on the body composition analysis procedure and were instructed not to make any intense physical effort in the 24 h prior to body composition measurement. Total body fat and lean body mass were determined using standard scan mode; the absorbed dose of radiation was 0.4 µGy. Measurements were performed at the University of Physical Education in Poznań.
Physiological Indicators
Resting blood pressure and heart rate were measured with a digital blood pressure monitor (Omron HEM-7155T-EBK, M4 Intelli IT, Omron Healthcare, Kyoto, Japan). The measurements were performed according to the European Society of Hypertension recommendation.22 The heart rate during exercise was monitored with a Polar A 300 device with a chest band and Bluetooth transmission.
Biochemical Markers
Venous blood samples were collected in the morning after a 12 h fasting and 48 h after the last training session. Blood samples were centrifuged and stored at −80°C until analysis. Serum samples were analyzed to measure the concentration of glucose, HbA1c and thyroid-stimulating hormone (TSH), and lipid profile, including total cholesterol, high-density lipoprotein, and triglyceride levels, using a Dimension EXL with LM Integrated Chemistry System Analyzer (Siemens, Newark, NJ, USA). The concentration of low-density lipoprotein cholesterol was calculated using the Friedwald equation. Serum insulin was measured using an immunoradiometric assay (DIAsource immunoassays S.A., Nivelles, Belgium). The sensitivity of the assay, as reported by the manufacturer, has a mean minimum detectable value of 1.0 µIU/mL. Insulin resistance was estimated using the following HOMA-IR calculation:

Insulin-like growth factor 1 (IGF-1) was analyzed using a commercial kit made by SunRedBio Technology Company (China). RBP4 was measured using a test produced by Immun Diagnostik (Germany).
One-Repetition Maximum Exercise Test
A 1RM test was performed to establish the maximum strength of each participant, determine the appropriate training loads, and verify progression in muscle strength during the program. The 1RM test was carried out for each of the five strength exercises included in the circuit and consisted of a maximum of four repetitions of the exercise with gradually increasing resistance until the participant was unable to overcome the weight. The final fully executed repetition, assessed by the machine’s range of motion display and the speed and flow of the movement as observed by the physiotherapist, was considered the 1RM. The 1RM test was preceded by a warm-up, and 3–4-minute breaks were provided between each of the four repetitions. The applied loads were increased by 1 to 20 kg based on the observation of the previous repetition and the patient’s rating of perceived exertion. Blood pressure was monitored throughout the 1RM test. No drops in systolic pressure of >10 mmHg with increased load or increases in blood pressure of >250/115 mmHg were observed in the participants.18
Statistical Analysis
The sample size was determined based on the results of a similar study evaluating the effects of 12-week resistance training in overweight sedentary women.23 We used the lowest value of the effect size (η2=0.39) from ANOVA analysis of HOMA-IR, fasting insulin, and IGF-1 concentration that have been obtained in that study. Then, the power analysis was performed to calculate the effect size using G*Power 3.1.9.4 software. The analysis indicated that a minimum of 18 subjects in total was required to detect an intervention effect, assuming statistical power of at least 0.8 and alpha level ≤ 0.5. Due to the possibility of losing subjects to follow-up, we set the number of patients per group to at least 14.
Data analyses were performed using the Statistica 13.3 software package (TIBCO Software Inc., Palo Alto, USA). Data were presented as means and standard deviations (mean±SD). The normal distribution of variables was verified with the Shapiro–Wilk test. A two-way repeated measures analysis of variance (ANOVA) was used to analyze the effects of time, group, and time × group interaction. Tukey’s (HSD, for unequal N) post hoc test was performed to assess the significance of differences between pairs of measurements. The partial eta- squared (η2) was used as an indicator of the effect size and the following interpretation criteria were adopted: small (0.01), medium, (0.06), and large (0.14). Correlation analysis was carried out using the Spearman rank correlation test.
Results
The study flow diagram is presented in Figure 1. In total, 315 females were screened at the Department of Treatment of Obesity, Metabolic Disorders and Clinical Dietetics, Poznan University of Medical Sciences, of which 272 were excluded and 42 met the inclusion criteria and consented to participate in the study. Participants were randomly assigned to the T (n = 28) and NT (n = 14) groups (allocation ratio: 2:1). Twenty-seven participants completed the study, 19 from the T group and 8 from the NT group. Six participants were lost to follow-up. There were no significant differences between groups at baseline in the analyzed variables (Table 2). Attendance at the training program was 96%.
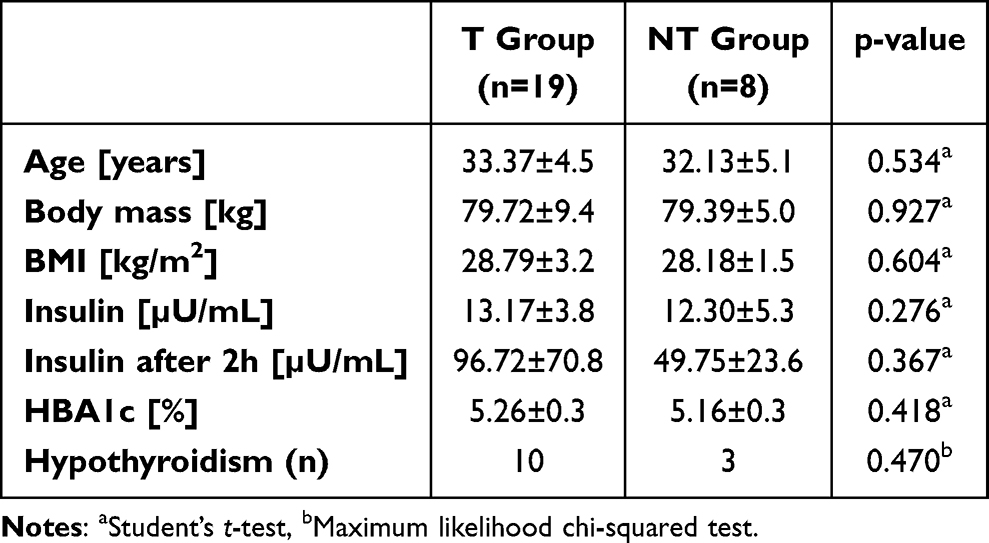 |
Table 2 Pre-Study Demographic and Clinical Characteristics of Participants in the Training (T) and Non-Training (NT) Groups |
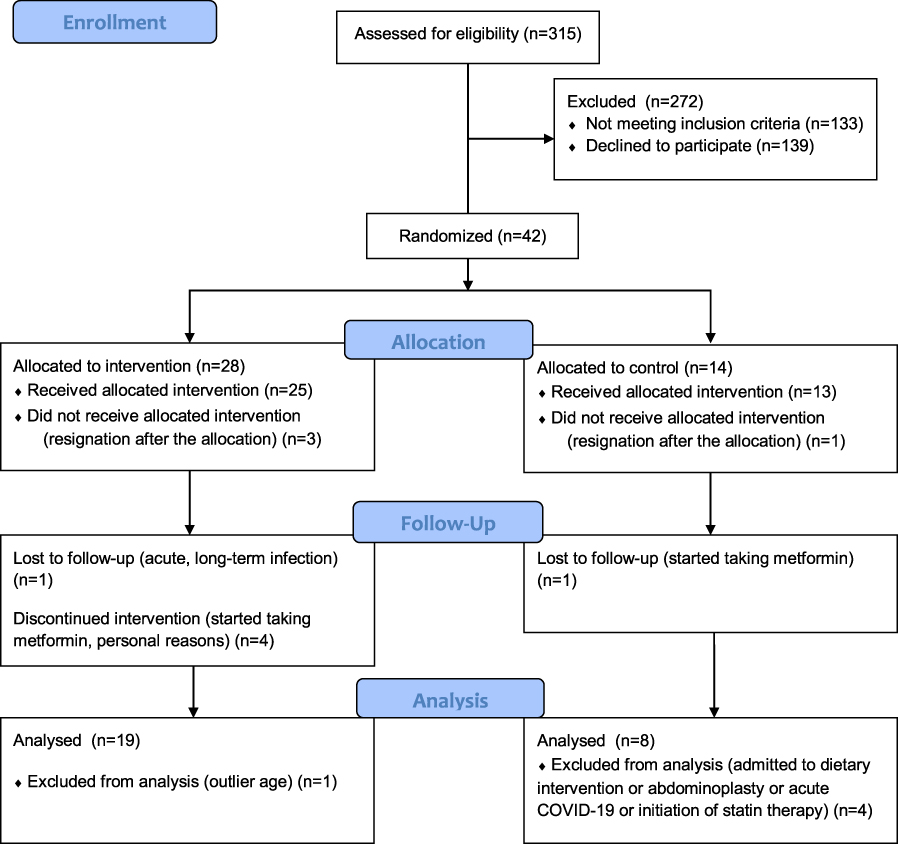 |
Figure 1 Study flow chart. |
An overview of the demographic and clinical characteristics of the T and NT groups of women with insulin resistance and overweight or mild obesity, is provided in Table 2. Participants in the two groups had comparable demographic and clinical characteristics.
Table 3 demonstrates that the level of physical activity and diet were controlled in both study groups. Dietary intake did not change during the study and the level of physical activity increased only in the T group (Table 3).
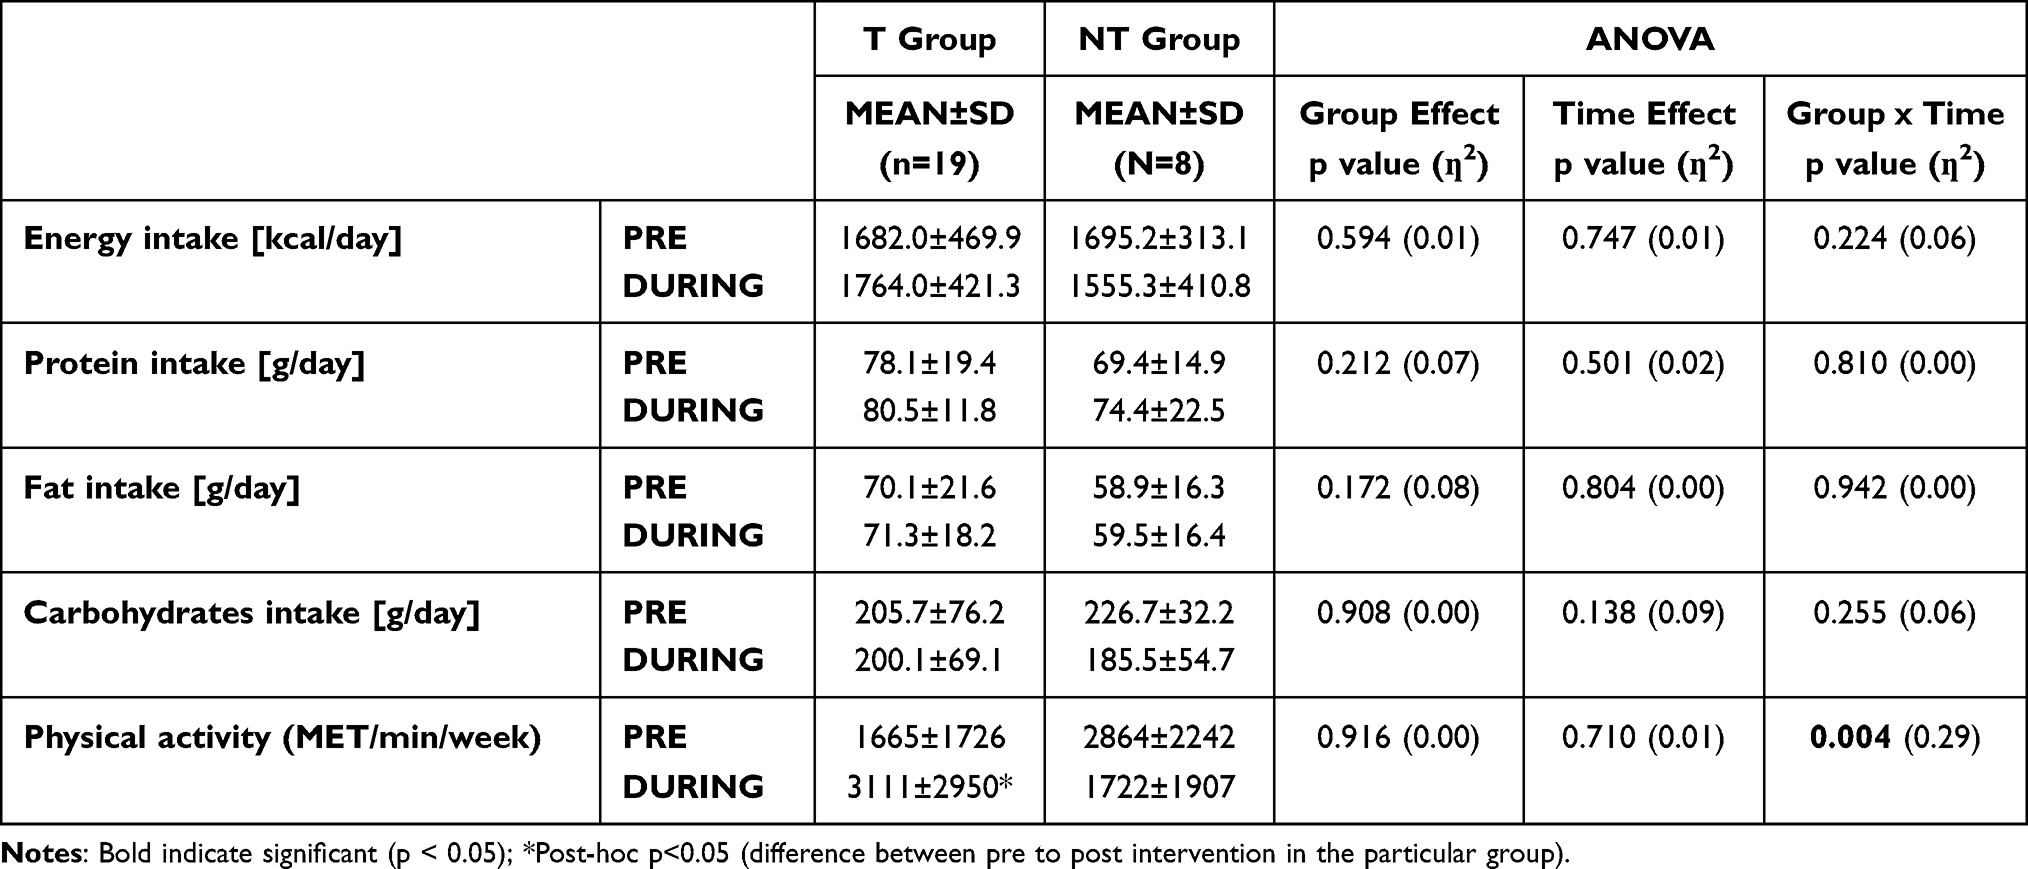 |
Table 3 Factors Controlled During the Study |
The effects of the circuit training program on abdominal muscles strength, resting HR, blood pressure, and body composition are presented in Table 4. Repeated measures ANOVA revealed a group × time interaction for abdominal muscles strength (p < 0.01), resting HR (p < 0.05) and total lean mass (p < 0.05), indicating a different effect between the groups over the 12-week study period. Changes in resting blood pressure, body weight, visceral adipose tissue, and total fat mass were not significantly different between the groups (Table 4).
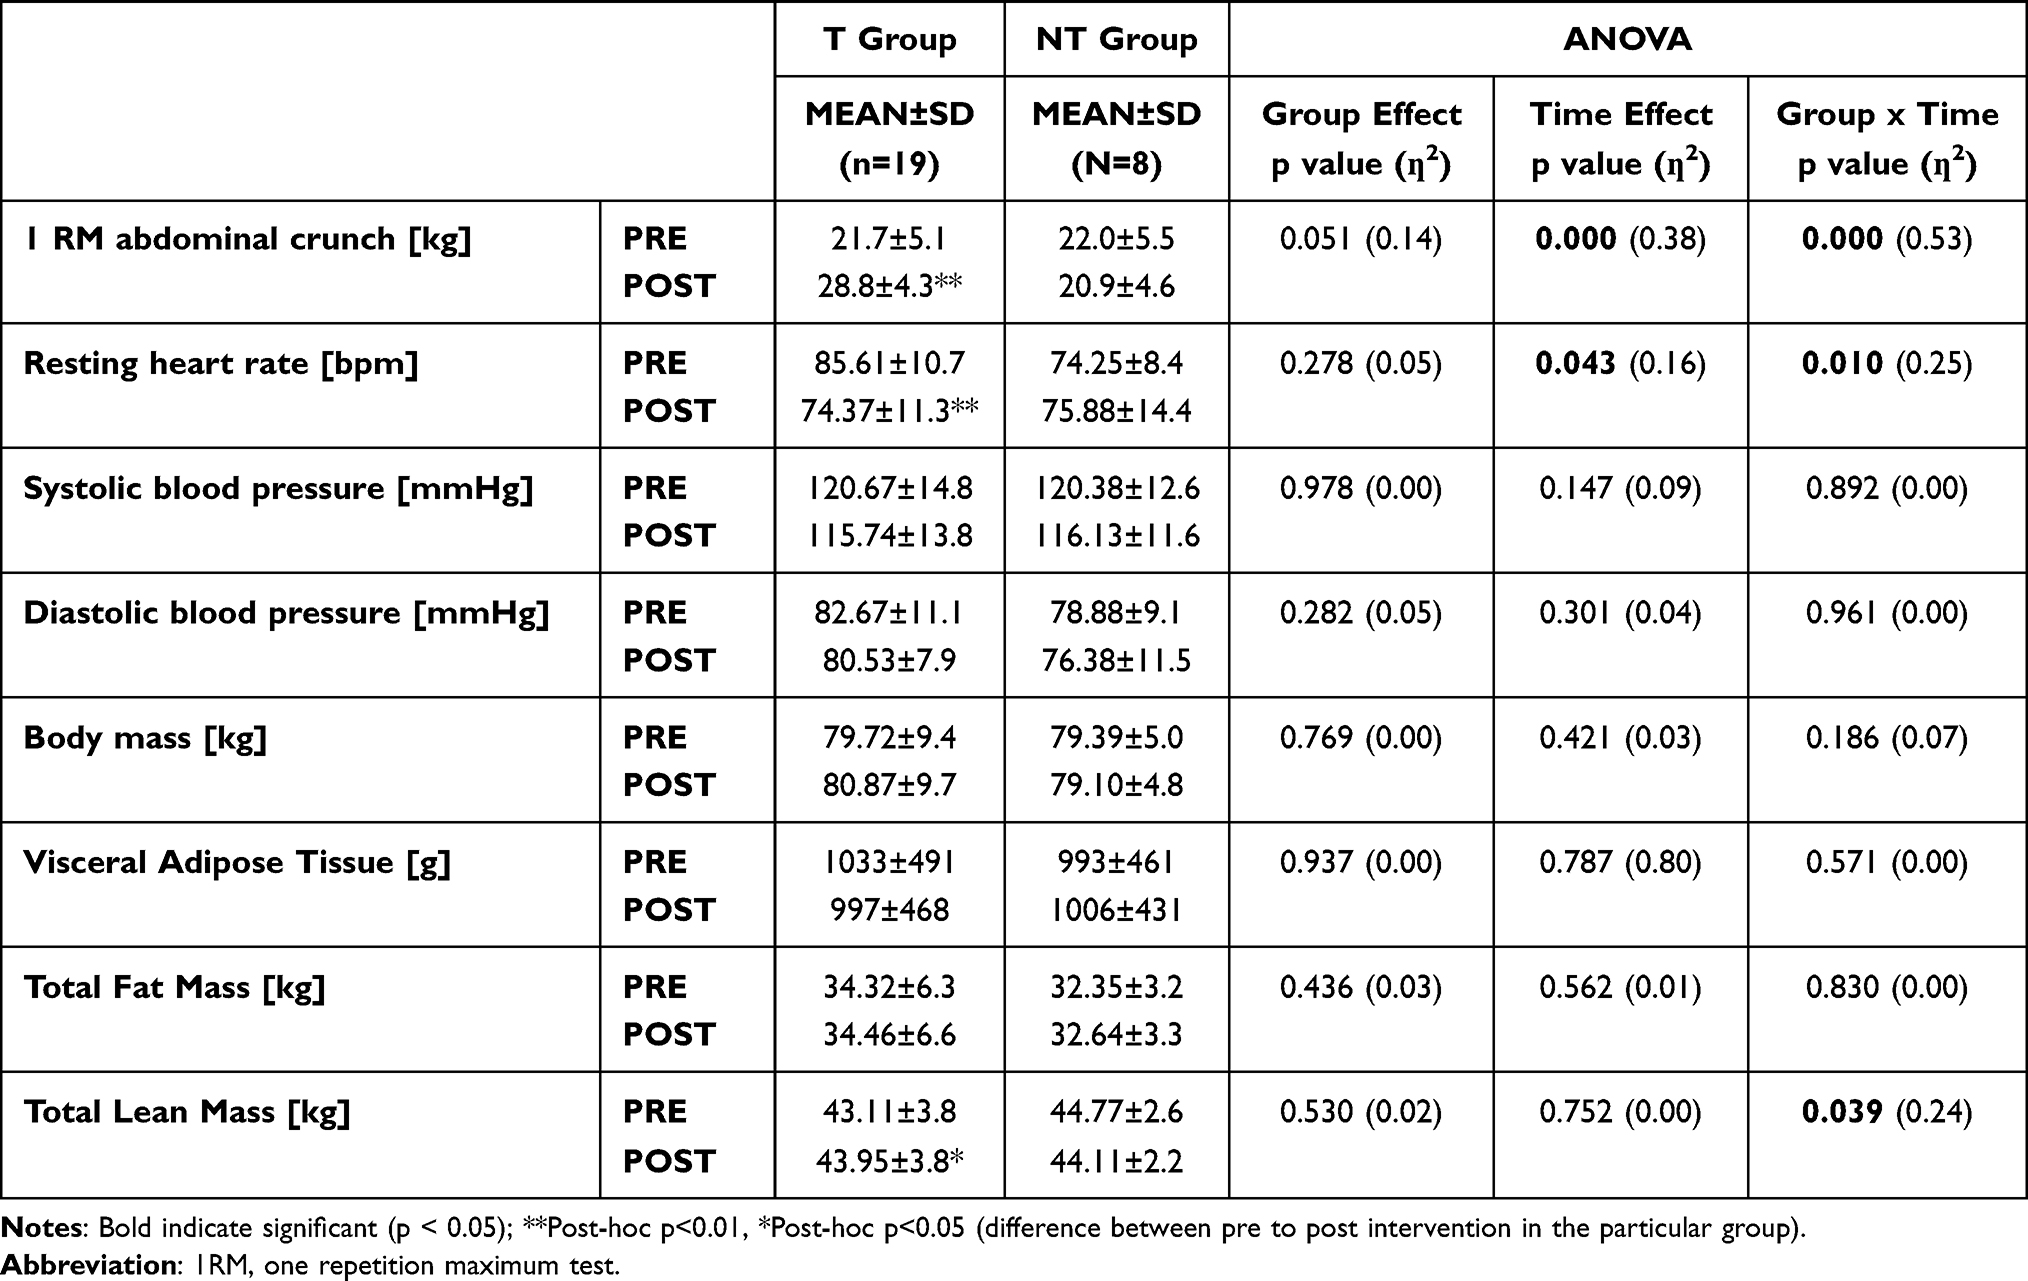 |
Table 4 Pre- and Post-Study Physiological and Body Composition Indicators in the Training and Non-Training Groups |
The effects of the 12-week circuit training program on biochemical indicators are presented in Table 5. During the 12-week period, significant time effects on triglyceride and IGF-1 levels were noted (p < 0.05), with a significant increase in triglyceride concentrations and a decrease in IGF-1 concentrations observed post-study compared to pre-study. Repeated measures ANOVA did not reveal group × time interactions for fasting carbohydrate and lipid metabolism, IGF-1, TSH, RBP4, or HOMA-IR.
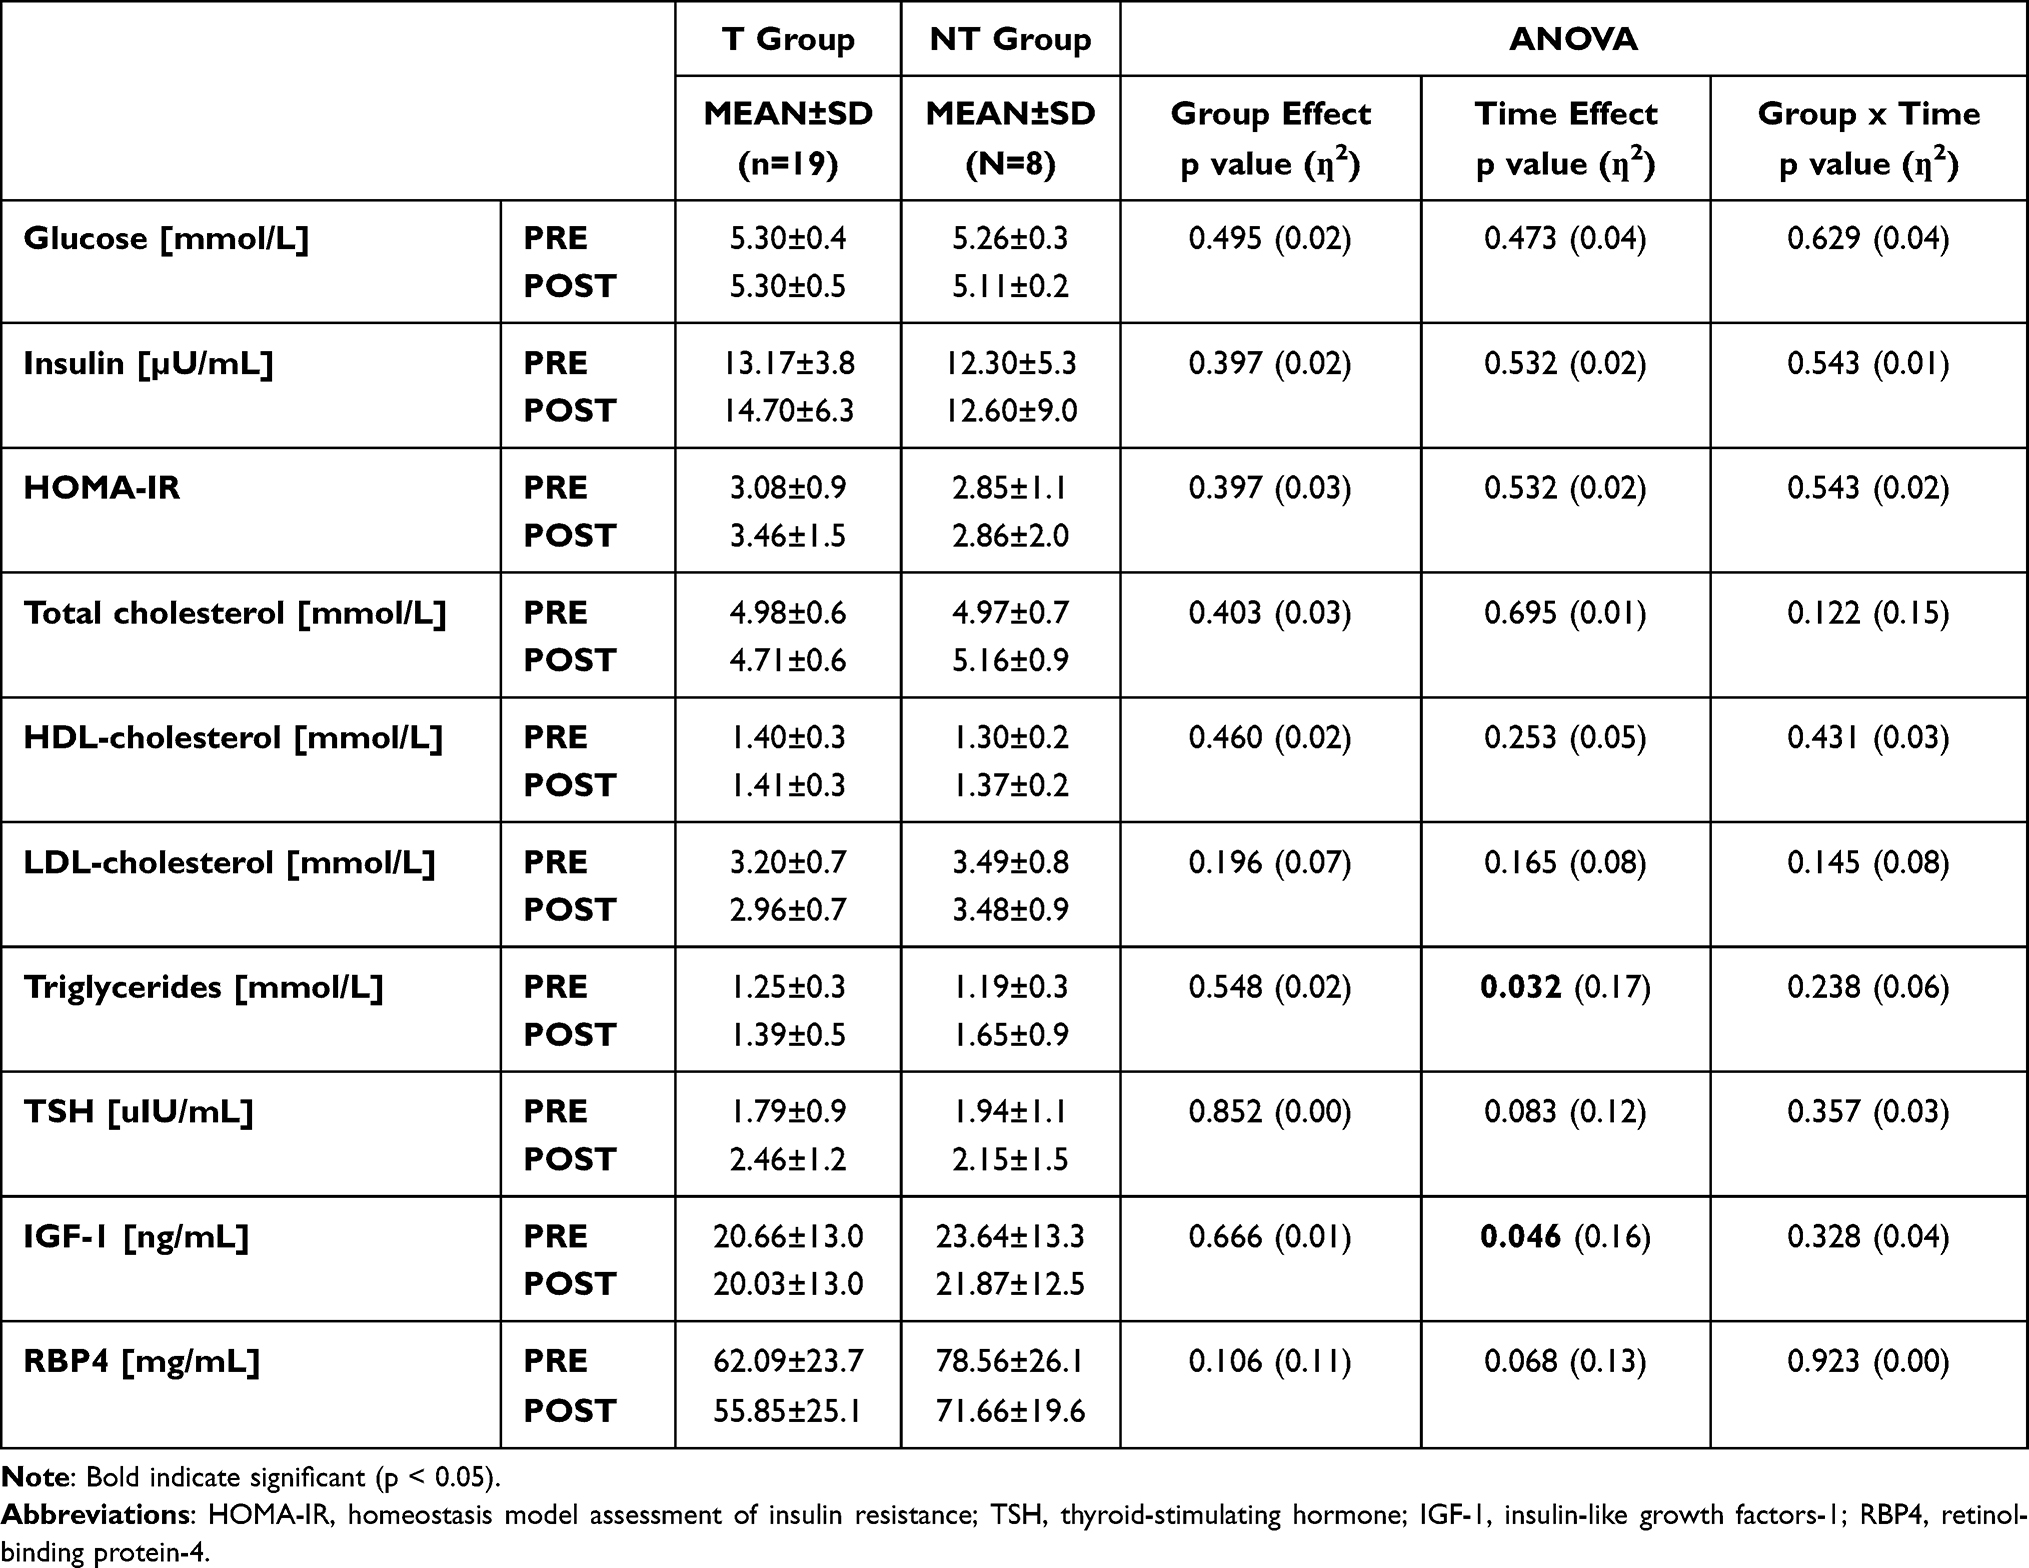 |
Table 5 Pre- and Post-Study Biochemical Indicators in the Training and Non-Training Groups |
A significant positive correlation was found between RBP4 and TSH concentration in insulin-resistance volunteers before the intervention (Figure 2). No other relationships between studied biochemical variables were found.
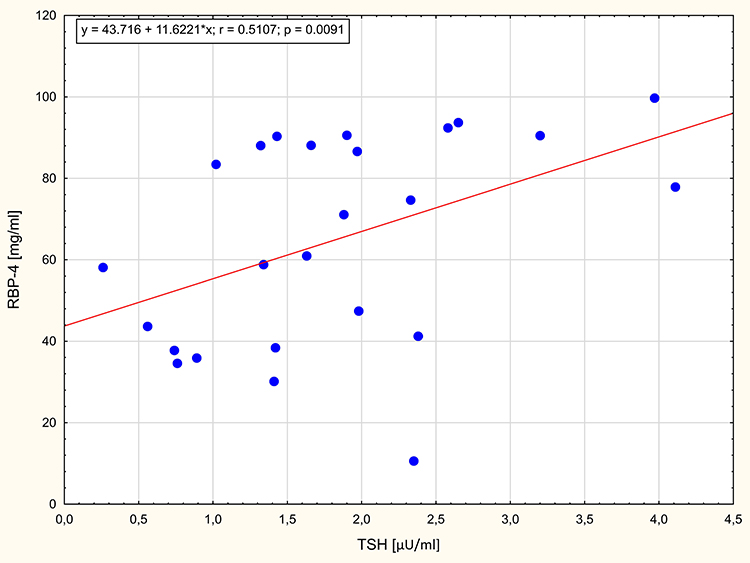 |
Figure 2 Spearman correlation between retinol binding protein- 4 and thyroid- stimulating hormone concentration before the intervention. |
Discussion
While aerobic endurance exercise is a common choice for intervention programs targeting glucose-intolerant individuals, current recommendations for physical activity include both endurance and resistance exercise.24 We were, thus, interested in examining whether a combination of resistance and endurance training would result in a similar or better improvement in insulin sensitivity in women with insulin resistance as observed in previous studies on people with T2DM examining resistance or endurance training alone.10,25 This study showed that a 12-week circuit training program comprising a combination of strength and endurance exercise without calorie restriction did not affect insulin sensitivity, RBP4 concentration, and glucose and lipid metabolism, despite a significant increase in lean body mass (p < 0.05) in females with insulin resistance (BMI up to 33 kg/m2; Table 4 and Table 5).
The 12-week circuit training program did result in a significant reduction in resting HR in the T group compared to the NT group (p<0.05), confirming that regular exercise economizes cardiovascular function in women. The mechanism responsible for the HR changes was a favorable adaptation of the autonomic system balance—conventionally explained by a decrease in the activity of the sympathetic component and an increase in the tension of the parasympathetic component.26
We propose several explanations for the lack of improvement in insulin sensitivity as a result of the implemented training program. First, according to Bird and Hawley’s literature review,5 when an exercise program fails to improve insulin sensitivity, as seen in the T group in the present study, the lack of improvement may be due to the exercise intensity being too low, the duration being too short, or the group already having adequate insulin sensitivity, limiting the potential for improvement. When the degree of insulin resistance is low, higher exercise loads are required, particularly during strength training. Likewise, Mavros et al27 reported that improvements in metabolic health in older patients with T2DM were mediated through improvements in body composition only if they were achieved through high-intensity progressive resistance training. They additionally found that the changes in skeletal muscle mass were associated with improvements in homeostasis model assessment 2 of insulin resistance (HOMA2) in older patients with T2DM.
In the present study, the average training load was 50–75% HRR above resting HR and 50–80% 1RM. In one study, resistance training (60–80% 1RM, twice/week) combined with aerobic endurance exercise for 12 months significantly reduced HbA1c, blood glucose, body weight, and waist circumference and increased skeletal muscle PPAR-γ and PPAR-α mRNA levels, which promote glucose and fat oxidation in skeletal muscle mitochondria, in patients with diabetes.28 The above program was characterized by a much longer duration compared to the program used in our study, which may indicate the reasons for the lack of improvement in insulin sensitivity in patients with overweight and mild obesity but not yet with diabetes.
Several studies have indicated that improved insulin sensitivity occurs with exercise intensities between 75% and 100% 1RM. Further, plasma insulin levels were found to remain the same even after 6 months of high-intensity (75–85% 1RM) exercise in older diabetic patients.29–31 Rynders et al32 revealed that higher intensities of exercise produced greater improvements; an 85% improvement in insulin sensitivity was observed following high-intensity exercise compared to a 51% improvement following moderate-intensity exercise. On the other hand, high-intensity exercise carries the risk of injury and discouragement from exercise, which may result in not completing the training program.33 Therefore researchers are also assessing whether lower-volume exercise programs achieve greater compliance and thus, may ultimately be superior to higher-intensity and/or longer-duration exercise sessions.5
Nevertheless, recent research suggests that ectopic fat might not be the primary determinant of insulin resistance; instead, intrinsic factors in the muscle34 and it is higher intensities of exercise during training that appear to have a more potent effect on peripheral insulin sensitivity assessed by hyperinsulinemic–euglycemic clamps.11 At a molecular level, increased muscle mass and muscle strength are attributed to the increase in muscle hypertrophy, which possibly occurs through phosphatidylinositol 3 kinase-Akt-mammalian target of rapamycin (PI3K/Akt/mTOR) signaling cascades. These molecular events may be associated with improved muscle substrate (glucose or fat) metabolism.35,36
Our supposition that the training intensity implemented in our program was too low is supported by the lack of post-program changes in IGF-1 levels in the T group (Table 5). It has been documented that successful training adaptations can rebound anabolic activation of the growth hormone–IGF-1 axis, causing IGF-1 to rise above pre-training levels.37 Mixed training increases muscle mass and strength, in large part due to the induction of muscle hypertrophy and neuromuscular remodeling via the PI3K/Akt/mTOR pathway. These molecular changes in skeletal muscle likely underlie improvements in glucose and lipid metabolism, even in the absence of observable direct evidence.36
RBP4 is an adipokine that appears to be involved in the early phases of the development of insulin resistance and other components of metabolic syndrome.38 Increasing serum RBP4 induces hepatic expression of the gluconeogenic enzyme phosphoenolpyruvate carboxykinase and impairs insulin signaling in muscle.39 In our study, high levels of RBP4 were observed (the average baseline RBP4 concentration was 62.09 ± 23.7 g/mL in the T group and 78.56 ± 26.1 g/mL in the NT group) compared to the levels recorded in subjects with insulin resistance in the study by Graham et al38 Elevated serum RBP4 in insulin-resistant states might be a consequence of increased expression, expanded fat mass, altered secretion, and/or altered clearance of RBP4 from the circulation.39 As suggested by Numao et al,40 the effect of exercise training on metabolic abnormalities may be partially mediated by changes in circulating RBP4 concentrations. Research conducted by Graham et al38 showed that a 4-week exercise training program reduced circulating RBP4 concentrations in subjects who also demonstrated improved post-program insulin resistance, and RBP4 concentration was negatively correlated with glucose disposal rates after the exercise training program in subjects with impaired glucose tolerance or T2DM. In the present study, the implemented 12-week circuit training program did not induce post-program changes in RBP4 concentrations, and we found no differences in RBP4 levels between the groups (Table 5). According to Yang et al,39 decreases in RBP4 concentrations in subjects with obesity may be more related to exercise-induced improvements in circulating triglyceride concentrations; however, in our study, we did not observe significant changes in lipid metabolism in the T group from pre- to post-program, and we found no differences in lipid metabolism between the groups (Table 5).
Recent clinical studies in adults have demonstrated that RBP4 levels are higher in patients with clinical hypothyroidism than in controls.41,42 The results of our study revealed a positive relationship between serum RBP4 concentrations and TSH concentrations before the intervention (r = 0.51; p < 0.01; Figure 2). These results are in agreement with those of previous studies,41,43,44 in which subjects with subclinical and overt hypothyroidism had higher circulating RBP4 levels than those with normal thyroid function. However, it remains unclear whether increased RBP4 level is cause or effect of hypothyroidism. In people with reduced thyroid function, improving metabolism may be more difficult to achieve, but participation in physical training may reduce this connection as RBP-4 and probably more adverse factors tend to decrease despite no improvements in thyroid function. This is reflected by the lack of such correlation after the intervention.
Limitation of the Study
The relatively small size of the examined groups (especially in the NT group) may limit the inference from our study, thus generalization to a larger population should be made with caution. On the other hand, the groups are very homogeneous, ensuring the elimination of many factors that interfere with research on insulin resistance, such as age, presence of menopause, and body weight. Doubts may also arise from the use of the HOMA-IR index in the inclusion criteria, the cut-off point of which is not standardized and may vary across populations.
Conclusions
Based on the findings of this study, we conclude that 12 weeks of strength and endurance circuit training without calorie restriction has stronger effect on body composition, and functional fitness than HOMA-IR, glucose, lipid metabolism, IGF-1, TSH, and RBP4 in women with insulin-resistance. Minor changes in body composition may not be sufficient to translate into improvements in insulin sensitivity assessed 2 days after the last exercise session, but our study highlights the potential of combined training in the prevention and amelioration of insulin resistance. There is a clear need for further research to investigate the effectiveness of this type of intervention and to determine the optimal training load which simultaneously will not discourage patients with insulin resistance from exercising.
Abbreviations
RBP4, retinol-binding protein-4; T, training; NT, non-training; IGF-1, insulin-like growth factors-1; HOMA-IR, homeostasis model assessment of insulin resistance; TSH, thyroid-stimulating hormone; T2DM, type 2 diabetes mellitus; GLUT 4, glucose transporter type 4; AMPK, AMP‐activated protein kinase; HbA1c, glycosylated hemoglobin; 1RM, one repetition maximum; HR, heart rate; HRR, heart rate reserve; BMI, body mass index; PI3K/Akt/mTOR, phosphatidylinositol 3 kinase-Akt-mammalian target of rapamycin; PGC‐1α, peroxisome proliferator-activated receptor-gamma coactivator; HOMA2-IR, homeostasis model assessment 2 of insulin resistance.
Data Sharing Statement
The datasets used and/or analyzed during the current study are available from the corresponding author on reasonable request.
Ethics Approval and Informed Consent
The study research protocol was approved by the Ethics Committee at the Poznan University of Medical Sciences in Poland (ref. 462/20). The study participants were informed about the aim and methods used in the study. They were also informed about the possibility to withdraw from the study at any stage of the project and they had insight into their results. Written informed consent was obtained from all participants.
Consent for Publication
This manuscript does not contain any individual person’s data.
Acknowledgments
We would like to thank the kravter Sp. z o. o. (exclusive distributor for the Milon company products in Poland) for providing exercise equipment. We also thank the patients for systematically attending the training sessions.
Author Contributions
JK developed the idea of the study. MR, MSz and DM were responsible for patients’ enrollment and medical qualification. MK, JK, MR were involved in monitoring the training sessions. MR, MK, MSz and KK were involved in patients’ evaluation at the established follow-ups. MR, JK performed biochemical analysis. MR and KK were responsible for data analysis. JK, MR, MK, KK were responsible for writing the paper. MSz and DM critically reviewed the article. All authors contributed to data analysis, drafting or revising the article, have agreed on the journal to which the article will be submitted, gave final approval of the version to be published, and agree to be accountable for all aspects of the work.
Funding
This study was funded by the Grant for Young Scientists; Poznan University of Physical Education, Poland.
Disclosure
All the authors declare that they have no competing interests.
References
1. Pedersen BK, Febbraio MA. Muscles, exercise and obesity: skeletal muscle as a secretory organ. Nat Rev Endocrinol. 2012;8(8):457–465. doi:10.1038/nrendo.2012.49
2. Petersen KF, Shulman GI. Pathogenesis of skeletal muscle insulin resistance in type 2 diabetes mellitus. Am J Cardiol. 2002;90(5a):11g–18g. doi:10.1016/s0002-9149(02)02554-7
3. Roden M, Shulman GI. The integrative biology of type 2 diabetes. Nature. 2019;576(7785):51–60. doi:10.1038/s41586-019-1797-8
4. Vargas E, Podder V, Carrillo Sepulveda MA. Physiology, glucose transporter type 4. In: StatPearls. StatPearls Publishing Copyright © 2022, StatPearls Publishing LLC.; 2022.
5. Bird SR, Hawley JA. Update on the effects of physical activity on insulin sensitivity in humans. BMJ Open Sport Exercise Med. 2017;2(1):e000143. doi:10.1136/bmjsem-2016-000143
6. Taylor DF, Bishop DJ. Transcription factor movement and exercise-induced mitochondrial biogenesis in human skeletal muscle: current knowledge and future perspectives. Int J Mol Sci. 2022;23(3):1517. doi:10.3390/ijms23031517
7. Maliszewska K, Adamska-Patruno E, Goscik J, et al. The role of muscle decline in type 2 diabetes development: a 5-year prospective observational cohort study. Nutrients. 2019;11(4):834. doi:10.3390/nu11040834
8. Kobayashi J, Uchida H, Kofuji A, et al. Molecular regulation of skeletal muscle mass and the contribution of nitric oxide: a review. FASEB Bioadv. 2019;1(6):364–374. doi:10.1096/fba.2018-00080
9. Hawley JA, Hargreaves M, Joyner MJ, Zierath JR. Integrative biology of exercise. Cell. 2014;159(4):738–749. doi:10.1016/j.cell.2014.10.029
10. Paquin J, Lagacé JC, Brochu M, Dionne IJ. Exercising for insulin sensitivity - is there a mechanistic relationship with quantitative changes in skeletal muscle mass? Front Physiol. 2021;12:656909. doi:10.3389/fphys.2021.656909
11. Collins KA, Ross LM, Slentz CA, Huffman KM, Kraus WE. Differential effects of amount, intensity, and mode of exercise training on insulin sensitivity and glucose homeostasis: a narrative review. Sports Med Open. 2022;8(1):90. doi:10.1186/s40798-022-00480-5
12. Church TS, Blair SN, Cocreham S, et al. Effects of aerobic and resistance training on hemoglobin A1c levels in patients with type 2 diabetes: a randomized controlled trial. JAMA. 2010;304(20):2253–2262. doi:10.1001/jama.2010.1710
13. Chadt A, Al-Hasani H. Glucose transporters in adipose tissue, liver, and skeletal muscle in metabolic health and disease. Pflugers Arch. 2020;472(9):1273–1298. doi:10.1007/s00424-020-02417-x
14. Takahashi H, Alves CRR, Stanford KI, et al. TGF-β2 is an exercise-induced adipokine that regulates glucose and fatty acid metabolism. Nat Metab. 2019;1(2):291–303. doi:10.1038/s42255-018-0030-7
15. Matthews DR, Hosker JP, Rudenski AS, Naylor BA, Treacher DF, Turner RC. Homeostasis model assessment: insulin resistance and beta-cell function from fasting plasma glucose and insulin concentrations in man. Diabetologia. 1985;28(7):412–419. doi:10.1007/bf00280883
16. Carson AP, Reynolds K, Fonseca VA, Muntner P. Comparison of A1C and fasting glucose criteria to diagnose diabetes among U.S. adults. Diabetes Care. 2010;33(1):95–97. doi:10.2337/dc09-1227
17. American Diabetes Association Professional Practice C. 2. classification and diagnosis of diabetes: standards of medical care in diabetes—2022. Diabetes Care. 2021;45(Supplement_1):S17–S38. doi:10.2337/dc22-S002
18. Sports M, Riebe D, Ehrman JK, Liguori G, Magal M; American College of. ACSM’s Guidelines for Exercise Testing and Prescription. American College of Sports Medicine Series. Wolters Kluwer; 2018.
19. Ferguson B. ACSM’s guidelines for exercise testing and prescription 9th ed. J Can Chiropr Assoc. 2014;58(3):328.
20. Karvonen MJ, Kentala E, Mustala O. The effects of training on heart rate; a longitudinal study. Ann Med Exp Biol Fenn. 1957;35(3):307–315.
21. Craig CL, Marshall AL, Sjöström M, et al. International physical activity questionnaire: 12-country reliability and validity. Med Sci Sports Exerc. 2003;35(8):1381–1395. doi:10.1249/01.mss.0000078924.61453.fb
22. Mancia G, Laurent S, Agabiti-Rosei E, et al. Reappraisal of European guidelines on hypertension management: a European society of hypertension task force document. J Hypertens. 2009;27(11):2121–2158. doi:10.1097/HJH.0b013e328333146d
23. Mahmoud N, Mohammadreza HA, Abdolhosein TK, Mehdi N, Arent SM. Serum myokine levels after linear and flexible non-linear periodized resistance training in overweight sedentary women. Eur J Sport Sci. 2022;22(4):658–668. doi:10.1080/17461391.2021.1895893
24. Pan B, Ge L, Xun YQ, et al. Exercise training modalities in patients with type 2 diabetes mellitus: a systematic review and network meta-analysis. Int J Behav Nutr Phys Act. 2018;15(1):72. doi:10.1186/s12966-018-0703-3
25. Strasser B, Pesta D. Resistance training for diabetes prevention and therapy: experimental findings and molecular mechanisms. Biomed Res Int. 2013;2013:805217. doi:10.1155/2013/805217
26. Besnier F, Labrunée M, Pathak A, et al. Exercise training-induced modification in autonomic nervous system: an update for cardiac patients. Ann Phys Rehabil Med. 2017;60(1):27–35. doi:10.1016/j.rehab.2016.07.002
27. Mavros Y, Kay S, Anderberg KA, et al. Changes in insulin resistance and HbA1c are related to exercise-mediated changes in body composition in older adults with type 2 diabetes: interim outcomes from the GREAT2DO trial. Diabetes Care. 2013;36(8):2372–2379. doi:10.2337/dc12-2196
28. Fatone C, Guescini M, Balducci S, et al. Two weekly sessions of combined aerobic and resistance exercise are sufficient to provide beneficial effects in subjects with type 2 diabetes mellitus and metabolic syndrome. J Endocrinol Invest. 2010;33(7):489–495. doi:10.1007/bf03346630
29. Dunstan DW, Daly RM, Owen N, et al. High-intensity resistance training improves glycemic control in older patients with type 2 diabetes. Diabetes Care. 2002;25(10):1729–1736. doi:10.2337/diacare.25.10.1729
30. Bacchi E, Negri C, Zanolin ME, et al. Metabolic effects of aerobic training and resistance training in type 2 diabetic subjects: a randomized controlled trial (the RAED2 study). Diabetes Care. 2012;35(4):676–682. doi:10.2337/dc11-1655
31. Cauza E, Hanusch-Enserer U, Strasser B, et al. The relative benefits of endurance and strength training on the metabolic factors and muscle function of people with type 2 diabetes mellitus. Arch Phys Med Rehabil. 2005;86(8):1527–1533. doi:10.1016/j.apmr.2005.01.007
32. Rynders CA, Weltman JY, Jiang B, et al. Effects of exercise intensity on postprandial improvement in glucose disposal and insulin sensitivity in prediabetic adults. J Clin Endocrinol Metab. 2014;99(1):220–228. doi:10.1210/jc.2013-2687
33. Perri MG, Anton SD, Durning PE, et al. Adherence to exercise prescriptions: effects of prescribing moderate versus higher levels of intensity and frequency. Health Psychol. 2002;21(5):452–458. doi:10.1037/0278-6133.21.5.452
34. Fortuin-de Smidt MC, Mendham AE, Hauksson J, et al. Effect of exercise training on insulin sensitivity, hyperinsulinemia and ectopic fat in black South African women: a randomized controlled trial. Eur J Endocrinol. 2020;183(1):51–61. doi:10.1530/eje-19-0957
35. Goodman CA. The role of mTORC1 in regulating protein synthesis and skeletal muscle mass in response to various mechanical stimuli. Rev Physiol Biochem Pharmacol. 2014;166:43–95. doi:10.1007/112_2013_17
36. Pesta DH, Goncalves RLS, Madiraju AK, Strasser B, Sparks LM. Resistance training to improve type 2 diabetes: working toward a prescription for the future. Nutr Metab. 2017;14:24. doi:10.1186/s12986-017-0173-7
37. Velloso CP. Regulation of muscle mass by growth hormone and IGF-I. Br J Pharmacol. 2008;154(3):557–568. doi:10.1038/bjp.2008.153
38. Graham TE, Yang Q, Blüher M, et al. Retinol-binding protein 4 and insulin resistance in lean, obese, and diabetic subjects. N Engl J Med. 2006;354(24):2552–2563. doi:10.1056/NEJMoa054862
39. Yang Q, Graham TE, Mody N, et al. Serum retinol binding protein 4 contributes to insulin resistance in obesity and type 2 diabetes. Nature. 2005;436(7049):356–362. doi:10.1038/nature03711
40. Numao S, Sasai H, Nomata Y, et al. Effects of exercise training on circulating retinol-binding protein 4 and cardiovascular disease risk factors in obese men. Obes Facts. 2012;5(6):845–855. doi:10.1159/000346205
41. Kokkinos S, Papazoglou D, Zisimopoulos A, et al. Retinol binding protein-4 and adiponectin levels in thyroid overt and subclinical dysfunction. Exp Clin Endocrinol Diabetes. 2016;124(2):87–92. doi:10.1055/s-0035-1564199
42. Sun HX, Ji HH, Chen XL, et al. Serum retinol-binding protein 4 is associated with the presence and severity of coronary artery disease in patients with subclinical hypothyroidism. Aging. 2019;11(13):4510–4520. doi:10.18632/aging.102065
43. Choi SH, Lee YJ, Park YJ, et al. Retinol binding protein-4 elevation is associated with serum thyroid-stimulating hormone level independently of obesity in elderly subjects with normal glucose tolerance. J Clin Endocrinol Metab. 2008;93(6):2313–2318. doi:10.1210/jc.2007-2536
44. Güdücü N, Görmüş U, Kavak ZN, Işçi H, Yiğiter AB, Dünder İ. Retinol-binding protein 4 is elevated and is associated with free testosterone and TSH in postmenopausal women. J Endocrinol Invest. 2013;36(10):831–834. doi:10.3275/8948
 © 2024 The Author(s). This work is published and licensed by Dove Medical Press Limited. The
full terms of this license are available at https://www.dovepress.com/terms
and incorporate the Creative Commons Attribution
- Non Commercial (unported, 3.0) License.
By accessing the work you hereby accept the Terms. Non-commercial uses of the work are permitted
without any further permission from Dove Medical Press Limited, provided the work is properly
attributed. For permission for commercial use of this work, please see paragraphs 4.2 and 5 of our Terms.
© 2024 The Author(s). This work is published and licensed by Dove Medical Press Limited. The
full terms of this license are available at https://www.dovepress.com/terms
and incorporate the Creative Commons Attribution
- Non Commercial (unported, 3.0) License.
By accessing the work you hereby accept the Terms. Non-commercial uses of the work are permitted
without any further permission from Dove Medical Press Limited, provided the work is properly
attributed. For permission for commercial use of this work, please see paragraphs 4.2 and 5 of our Terms.