")
Back to Journals » Infection and Drug Resistance » Volume 11
Effect of MRSA on CYP450: dynamic changes of cytokines, oxidative stress, and drug-metabolizing enzymes in mice infected with MRSA
Authors Tang HQ, Long NN, Lin L, Liu Y, Li JL, Sun FH, Guo LJ, Zhang F, Dai M
Received 12 October 2017
Accepted for publication 27 November 2017
Published 13 February 2018 Volume 2018:11 Pages 229—238
DOI https://doi.org/10.2147/IDR.S153871
Checked for plagiarism Yes
Review by Single anonymous peer review
Peer reviewer comments 2
Editor who approved publication: Professor Suresh Antony
Huaqiao Tang,1,2,* Nana Long,1,2,* Lin Lin,1,2 Yao Liu,1 Jianlong Li,1,2 Fenghui Sun,1,2 Lijuan Guo,1,2 Fen Zhang,3 Min Dai1,2
1School of Laboratory Medicine, 2Laboratory of Veterinary Drug Residue Prevention and Control Technology of Animal-derived Food, 3School of Humanities and Information Management, Chengdu Medical College, Chengdu, Sichuan, People’s Republic of China
*These authors contributed equally to this work
Background: Methicillin-resistant Staphylococcus aureus (MRSA) is a very damaging and widespread pathogen, which is associated with many diseases and causes serious infections. MRSA infection can modulate the effects of drugs, which may occur through an influence on cytochrome P450 (CYP450), the drug-metabolizing enzyme in the liver. In this study, we evaluated the underlying mechanism of drug failure or poisoning in MRSA infection.
Materials and methods: Mice were infected with three different doses of MRSA and the changes in CYP450 expression, cytokines, and oxidative stress markers were evaluated.
Results: The administration of an attack dose of MRSA caused serious symptoms of infection and resulted in a 40% mortality rate in the mice. MRSA induced strong inflammation and oxidative stress in the mice, predominantly caused by significant increases in interleukin (IL)-1β, IL-4, IL-6, macrophage inflammatory protein, glutathione S-transferase (GST), and malondialdehyde, and decreases in oxygen radical absorbance capacity and glutathione levels in the liver. The expression of IL-2, tumor necrosis factor-α, and GST was briefly suppressed, but increased on days 3 and 7. The increased inflammation and oxidative stress further induced a significant decrease in the mRNA levels and activities of CYP450 1A2, 2D22, 2E1, and 3A1 in MRSA-infected mice within the first day of infection.
Conclusion: These results show that MRSA infection leads to inflammation and oxidative stress, and reduces the expression levels and activities of drug metabolism enzymes, which decreased drug metabolism in patients infected with MRSA. Therefore, to avoid a drug overdose, the plasma concentration of patients with MRSA infection should be continuously monitored.
Keywords: MRSA, infection, cytokines, oxidative stress, CYP450
Introduction
Staphylococcus aureus has been a notorious human pathogen throughout history and continues to be one of the most common disease-causing bacteria in humans worldwide. S. aureus can infect a variety of body sites, leading to skin and soft tissue infections, bacteremia and endocarditis, bone and joint infections, pneumonia, and infections of the central nervous system.1 Methicillin-resistant S. aureus (MRSA) is responsible for an increase in severe nosocomial and community-acquired infections.2 Overall, ~20% of S. aureus isolates in Europe have been reported as methicillin-resistant; in hospitals in the USA, the prevalence ranges from 33% to 55%.3 In order to avoid future potential harm from MRSA infections, research has been devoted to the development of new drugs to control MRSA infection.4,5 Owing to the broad resistance of MRSA, these infections have become more difficult to control and represent a significant public health challenge.6 MRSA is present not only in hospitals but has also appeared in other environments and food; therefore, there are many more opportunities for individuals to come into contact with MRSA.7–10
MRSA is a serious human pathogen responsible for life-threatening septicemia, endocarditis, and toxic shock syndrome; furthermore, MRSA toxins are responsible for the symptoms of vomiting, fever, and diarrhea.11 The levels of inflammatory cytokines are shown to be significantly increased in mice after MRSA infection.12,13 Usually, the occurrence of inflammation is also accompanied by oxidative stress;14,15 indeed, MRSA has also been shown to increase the level of malondialdehyde (MDA) in mice.16,17 Therefore, MRSA infection can be considered to initiate the concurrent processes of inflammation and oxidative stress.
There are many causes for change in the expression of liver drug metabolic enzymes; the most important is the inflammation and oxidative stress caused by pathogenic microbial infection.18–20 Studies have shown that a component of the gut microbiome, Citrobacter rodentium, the hepatitis C virus, and other infectious agents modulate the expression of hepatic cytochrome P450 (CYP450).21–23 Matsumoto et al24 reported that MRSA infections influenced the pharmacokinetics and pharmacodynamics of teicoplanin in patients. We speculated that this effect was a result of changes in the expression of the cytochrome P450 enzyme caused by MRSA infection. As MRSA is a major causative pathogen of hospital infections, MRSA-infected patients often take a variety of drugs to treat other diseases, which greatly increases the probability of MRSA–drug interactions. In this study, to assist in unnecessary treatment failure or poisoning, we examined the changes in CYP450 expression in mice infected with MRSA and assessed whether the underlying mechanism was related to the associated changes in cytokines and oxidative stress.
Materials and methods
Materials
Phenacetin, dextromethorphan, chlorzoxazole, and testosterone were obtained from Aladdin Biochemical Technology Co. Ltd (Shanghai, People’s Republic of China). Citral (>99% pure) was purchased from Sigma-Aldrich Co. LLC. (St. Louis, MO, USA). The liver microsomal incubation system was purchased from Puleite Biomedical Technology Co. Ltd (Wuhan, People’s Republic of China). All molecular biology reagents were purchased from Bio-Rad Laboratories Inc. (Hercules, CA, USA), all analytical kits were purchased from Jiancheng Biology Engineering Institute (Nanjing, People’s Republic of China), and all other chemicals and reagents were of analytical grade and obtained commercially. ProcartaPlex mouse multifactor kits were purchased from eBioscience (Thermo Fisher Scientific Inc., Waltham, MA, USA).
Animals
Male KM mice (specific pathogen-free [SPF]-grade, 6-week-old, and weighing18–22 g) were purchased from Dossy Biological Technology Co. Ltd (Chengdu, People’s Republic of China). The animals were housed in polypropylene animal cages in a ventilated room maintained at 25°C ± 2°C, 70% ± 10% relative humidity, and under a 12-hour light/dark cycle in the SPF test room. Water and food were provided ad libitum. The mice were first acclimatized to the environment for 7 days before treatment and then divided into four groups (n = 10 per group): the control group (C group), and three groups of mice administered different concentrations of MRSA (obtained from the American Type Culture Collection [ATCC] 43300) via a single intraperitoneal injection of 1 × 10⁶ colony-forming units (CFU)/kg (L group), 2 × 10⁶ CFU/kg (M group), and 4 × 10⁶ CFU/kg (H group). Our previous study confirmed that 8 × 10⁶ CFU/kg MRSA was the minimum lethal dose (MLD) for mice, so we selected 0.125, 0.25, and 0.5 times the MLD as the high, medium, and low infective doses, respectively, for the present study. The symptoms of the animals were recorded and the survival rate was assessed daily. Animal experiments were conducted under the principles of good laboratory animal care and performed in compliance with the Animal Ethics Review Committee of Chengdu Medical College, and this committee also approved the experiments.
Sample collection
On the first, third, and seventh day of the experiment, after an 8 h overnight fast, all mice groups were anesthetized by ether and blood samples were collected.
CYP450 enzymes were isolated and prepared by differential centrifugation and analyzed for their activity by the use of liver microsomes.25. The liver was excised, rinsed with ice-cold saline (0.9% NaCl w/v), weighed, and homogenized in 0.05 mM Tris/KCl buffer (pH 7.4). The homogenate was centrifuged at 10,000 ×g at 4°C for 30 min and the supernatant was centrifuged at 105,000 ×g at 4°C for 60 min. The pellet was reconstituted in 0.05 mM Tris/KCl buffer (pH 7.4) and stored at −80°C until analysis. The protein content in the liver microsomes was determined by the Bradford protein assay kit (Beyotime Biological Technology Co. Ltd, Shanghai, People’s Republic of China).
A portion of the liver tissue (0.5 g) was snap-frozen in liquid nitrogen and stored at −80°C until cytokine analysis, mRNA extraction, and gene expression analysis.
Cytokine analysis
The levels of liver interleukin (IL)-1β, IL-2, IL-4, IL-6, tumor necrosis factor-alpha (TNF-α), and macrophage inflammatory protein (MIP)-1α were analyzed using MAGPIX (Luminex Corporation, Austin, TX, USA) in accordance with the manufacturer’s instructions.
Oxidative stress
The levels of oxidative stress were evaluated through the measurement of superoxide dismutase (SOD), glutathione S-transferase (GST), glutathione peroxidase (GSH-Px), oxygen radical absorbance capacity (ORAC), and the contents of MDA, and nitric oxide (NO) in the livers of mice in accordance with the manufacturer’s instructions for the appropriate kits (Nanjing Jiancheng Bioengineering Institute, Nanjing, People’s Republic of China).
RNA extraction and gene expression analysis in the liver by real-time polymerase chain reaction
RNA extraction and gene expression in the liver tissue were analyzed as previously described.26 The quality and quantity of the extracted RNA were determined using an ultraviolet-visible spectrophotometer (NanoDrop 2000 UV-Vis spectrophotometer; Thermo Fisher Scientific). The expression levels of the following target genes were analyzed: CYP450 1A2, 2D22, 2E1, and 3A11. The housekeeping gene GAPDH was used for data normalization; all primers are shown in Table 1. An arbitrary scale was used for statistical comparisons. Melting curves and PCR efficiency were used as the standard quality criteria for each real-time PCR run.
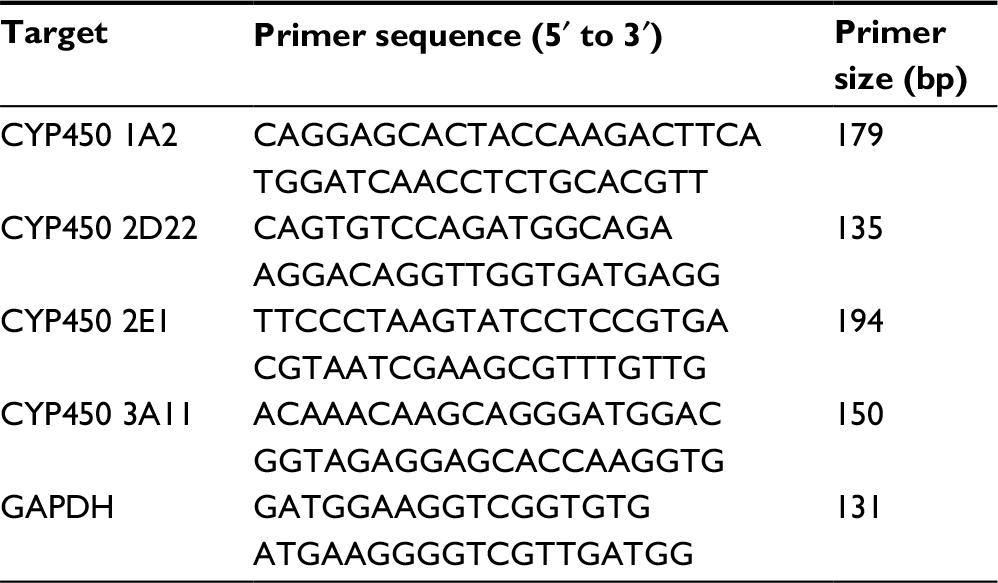 | Table 1 PCR primers used for gene expression analysis Abbreviation: CYP450, cytochrome P450. |
Activities of CYP450 1A2, 2D22, 2E1, and 3A11 enzymes
The activities of the CYP450 1A2, 2D22, 2E1, and 3A11 enzymes were assessed as previously described, with slight modifications.27,28 All microsomal incubations were conducted for 60 min at 37°C in a final volume of 500 μL containing pooled microsomes (1 mg/mL protein) and an NADPH-regenerating system. A mixture of MgCl2 (10 mM), glucose-6-phosphate (10 mM), NADP+ (1 mM), and pyruvate dehydrogenase (2 U/mL) was used to regenerate NADPH. The probe substrates specific for the four CYPs tested were added during the microsomal incubations. The final concentration of the organic solvent (methanol or acetonitrile) used in the reaction was adjusted to 1% (v/v). All incubations were terminated by the addition of 500 μL ice-cold acetonitrile containing tinidazole (20 ng/mL) as an internal standard. The samples were thoroughly mixed, centrifuged (18,000 ×g at 4°C for 10 min), and 10 μL of the supernatant was subjected to high-performance liquid chromatography (HPLC) analysis. The relevant enzyme activities were evaluated based on the reduction in concentrations of the four probe substrates: phenacetin, dextromethorphan, chlorzoxazole, and testosterone for CYP450 1A2, 2D22, 2E1, and 3A11, respectively. The HPLC analyses of phenacetin, dextromethorphan, chlorzoxazole, testosterone, and tinidazole (internal standard) were performed on an Agilent 1260 series instrument with a diode array detector at 230 nm. An Agilent reversed-phase C18 column (ZORBAX SB-C18, 4.6 × 250 mm, 5 μm), with a C18 guard column, was used with a mobile phase of acetonitrile and water (0.01 M acetic acid) in a 40:60 ratio at 30°C and a flow rate of 1 mL/min.
Data analysis
The incubation assays were conducted in triplicate. The statistical significance of the data was evaluated by one-way analysis of variance computed in SPSS 19.0, and least significant differences were calculated after the comparison of the mean values with those of the control group.
Results
Symptoms and survival rate
The main symptoms of mice infected with MRSA were apathy, anorexia, curled up position, fatigue, and constipation. No deaths occurred in groups C, T, and L. The survival rates in groups M and H were 80% and 60%, respectively, on the seventh day (Figure 1).
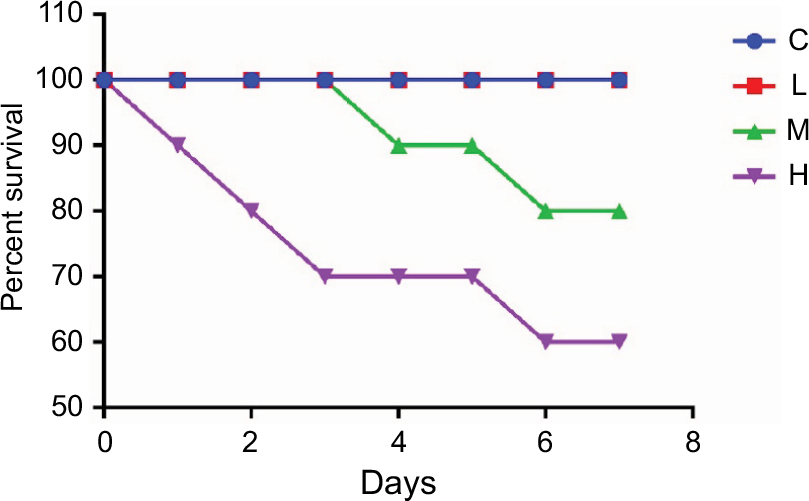 | Figure 1 Survival rates of mice infected with MRSA and the uninfected controls. Abbreviations: C, control group; H, high-dose group (4 × 10⁶ CFU/kg); L, low-dose group (1 × 10⁶ CFU/kg); M, middle-dose group (2 × 10⁶ CFU/kg); MRSA, methicillin-resistant Staphylococcus aureus. |
Cytokines
Different cytokines showed different patterns of change after MRSA infection, as demonstrated in Figure 2. For the surviving mice, the level of IL-1β was significantly increased in the H group on the first day and then continuously increased by 3 and 7 days in the L and M groups. The level of IL-2 was significantly increased in the L group, but was significantly decreased in the M and H groups on day 1; subsequently, on days 3 and 7 after MRSA infection it was continuously increased in the L and M groups. The level of IL-4 was significantly increased in the M and H groups on day 1, but then decreased in the H group at days 3 and 7. The level of IL-6 was increased by MRSA in all three groups at day 7. The level of TNF-α was significantly increased in the L group on days 1 and 3, but was significantly decreased in the H group. The MIP level showed a dose-dependent increase on days 1 and 3 for all three treatment groups, but was not changed in the H group on day 7.
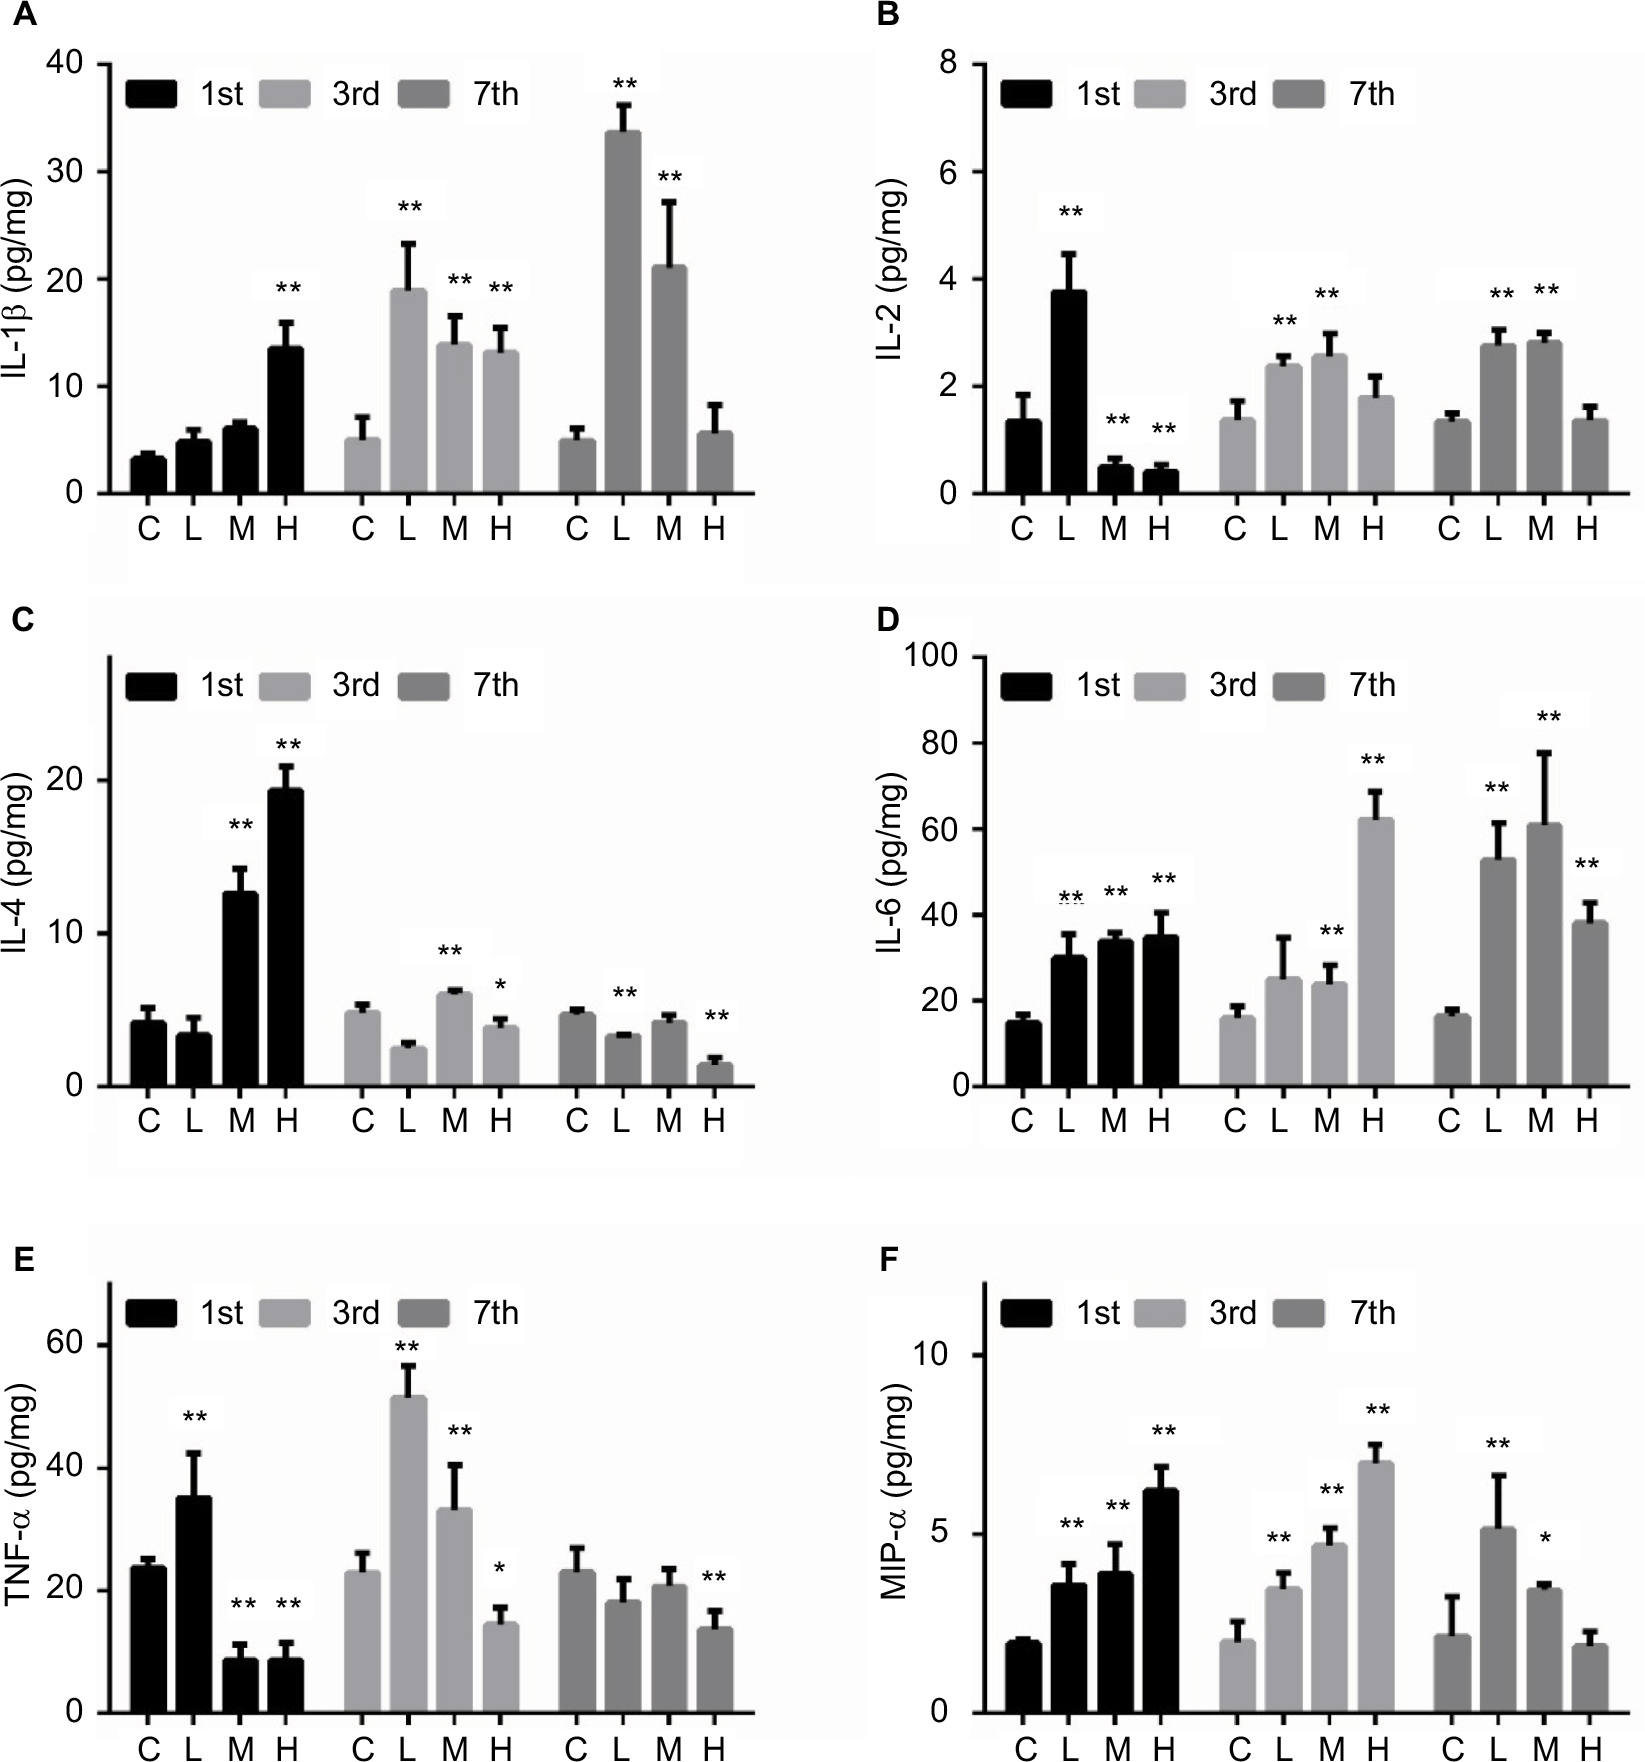 | Figure 2 Effect of MRSA on liver IL-1β (A), IL-2 (B), IL-4 (C), IL-6 (D), TNF-α (E), and MIP-α (F) expression levels in mice. Note: *p < 0.05, **p < 0.01 compared with the control group. Abbreviations: C, control group; H is high-dose group (4 × 10⁶ CFU/kg); L, low-dose group (1 × 10⁶ CFU/kg); M, middle-dose group (2 × 10⁶ CFU/kg); MRSA, methicillin-resistant Staphylococcus aureus; IL, interleukin; TNF-α, tumor necrosis factor-α; MIP-α, macrophage inflammatory protein alpha. |
Oxidative stress
The levels of oxidative stress markers are shown in Figure 3. The ORAC level was significantly decreased in the M and H groups on day 3 and showed a continuous decrease in the H group until day 7. The GSH-Px level was decreased when the mice were infected with MRSA, with GSH most strongly suppressed on the first day. The SOD level was decreased in the H group on day 1. The level of GST was significantly suppressed by MRSA on day 1, but was then increased on days 3 and 7. The levels of NO and MDA were induced by MRSA in a dose-dependent manner, with larger changes observed in MDA.
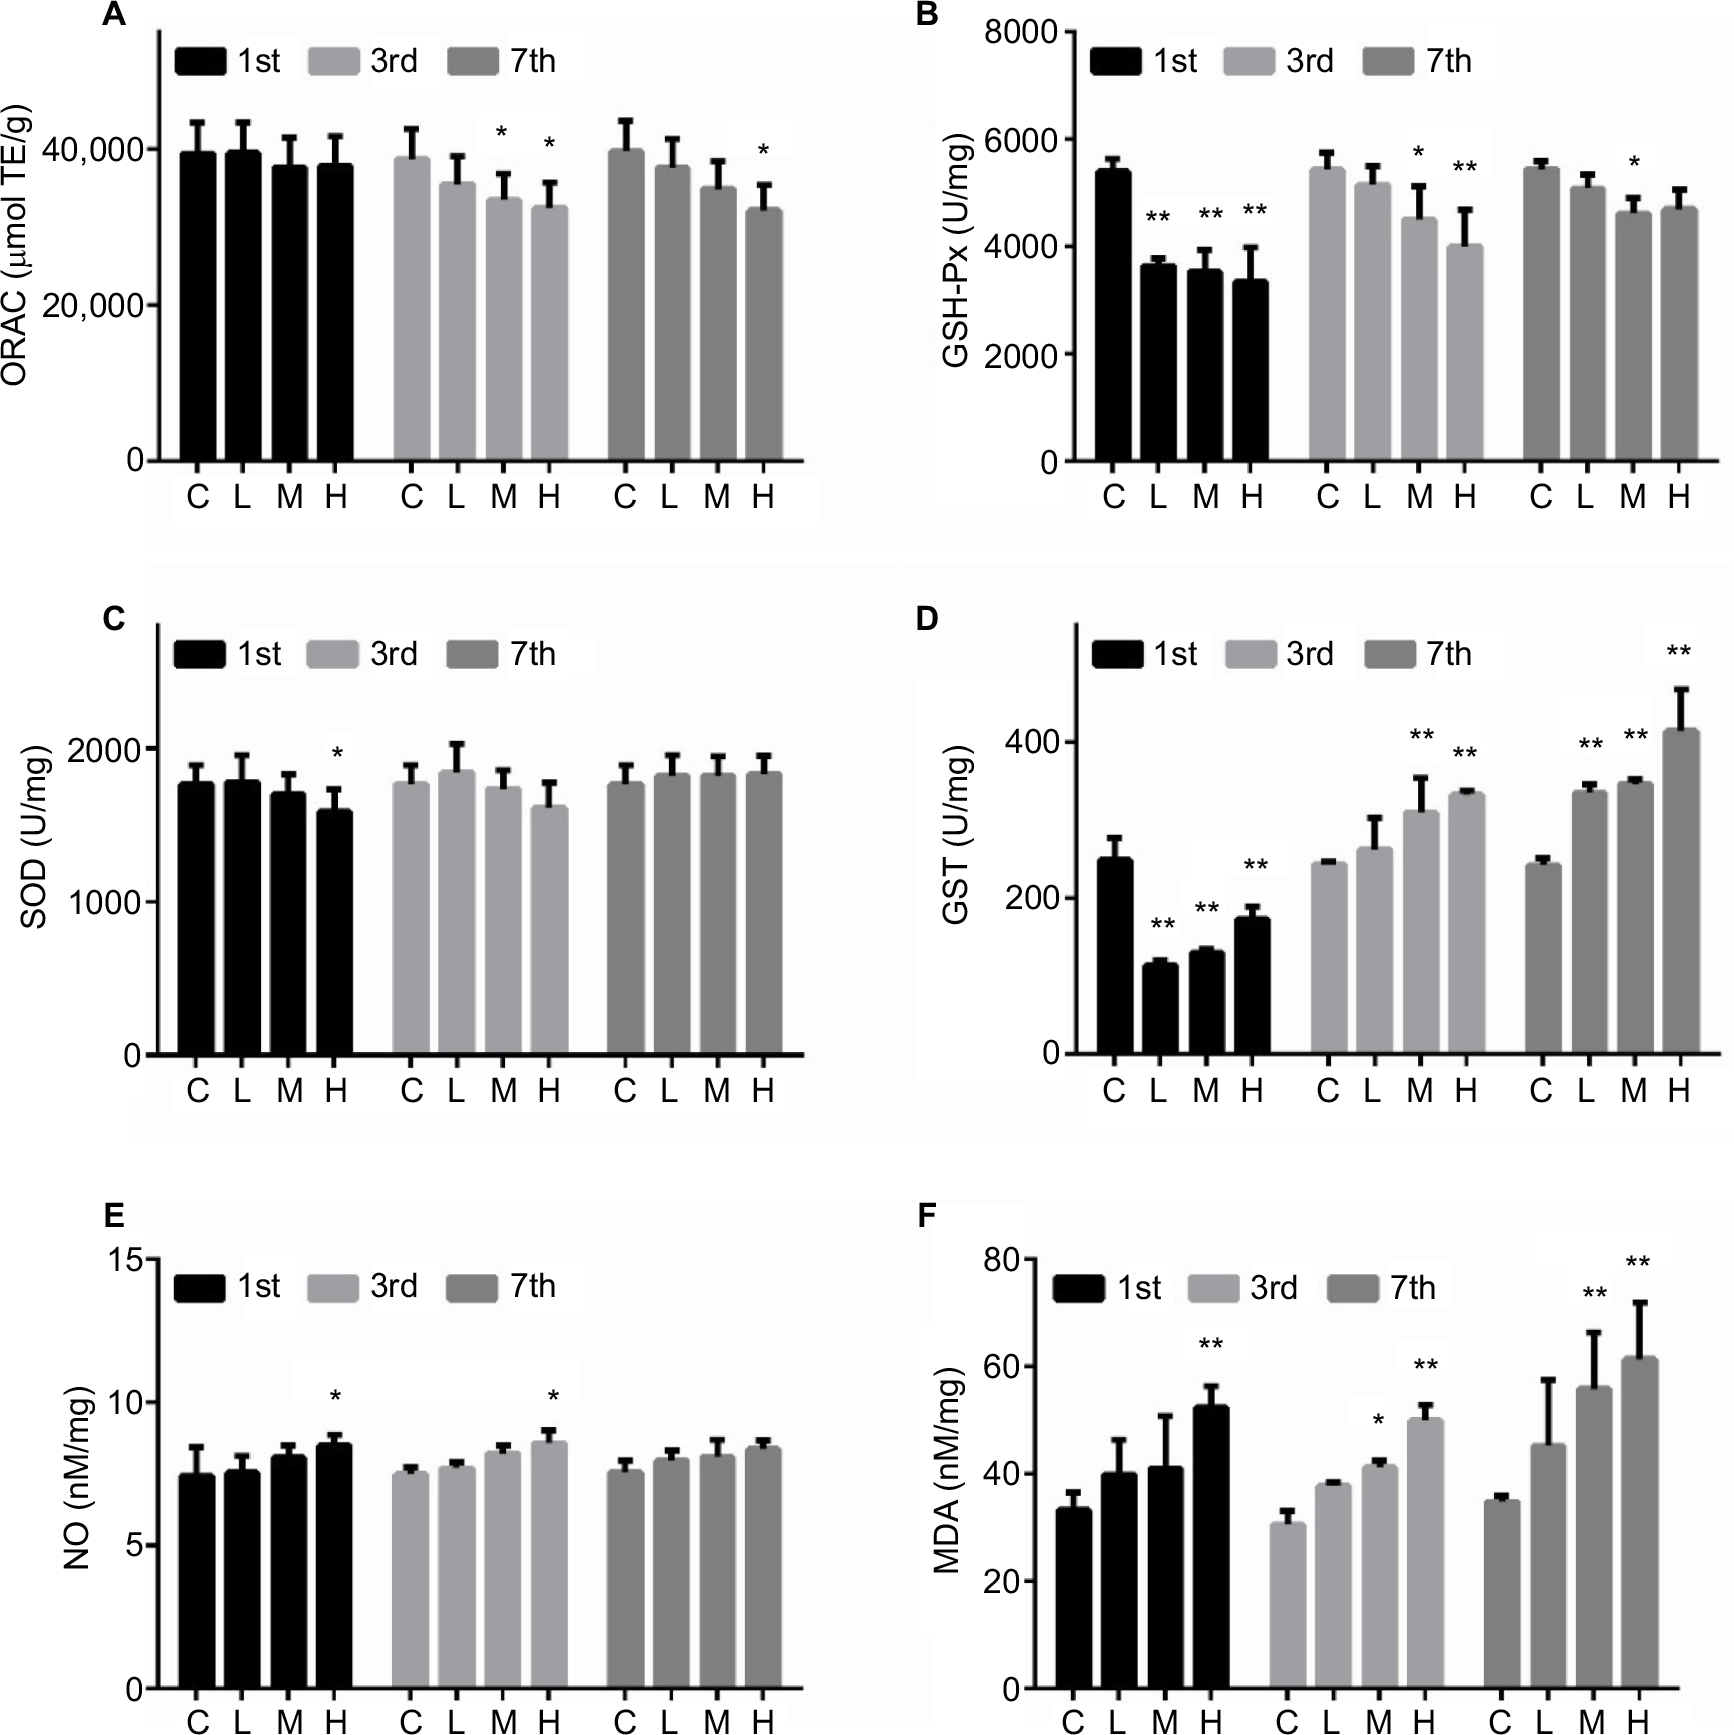 | Figure 3 Effect of MRSA on liver ORAC (A), GSH-Px (B), SOD (C), GST (D), NO (E), and MDA (F) levels in mice. Note: *p < 0.05, **p < 0.01 compared with the control group. Abbreviations: C, control group; H, high-dose group (4 × 10⁶ CFU/kg); L, low-dose group (1 × 10⁶ CFU/kg); M, middle-dose group (2 × 10⁶ CFU/kg); MRSA, methicillin-resistant Staphylococcus aureus; ORAC, oxygen radical absorbance capacity; GSH-Px, glutathione peroxidase; SOD, superoxide dismutase; GST, glutathione transferase; NO, nitric oxide; MDA, malondialdehyde. |
mRNA expression of CYP450s
The mRNA expression levels of CYP450s are shown in Figure 4. For CYP450 1A2 and 3A11 mRNA, a significant decrease was observed in all groups on day 1. The mRNA level of CYP 1A2 in the L and H groups was significantly decreased on days 3 and 7, but increased on day 7 in group M. The mRNA level of CYP450 3A11 was decreased significantly on day 3 and remained low in group L on day 7, but was significantly induced in groups M and H. The mRNA level of CYP450 2D22 was significantly suppressed by MRSA in the M and H groups on day 1, but was increased in the M group on day 7. The mRNA level of CYP450 2E1 was significantly reduced by MRSA in the M and H groups on day 1, increased in the L and M groups, but reduced in the H group on day 3, and then significantly increased in the M and H groups on day 7.
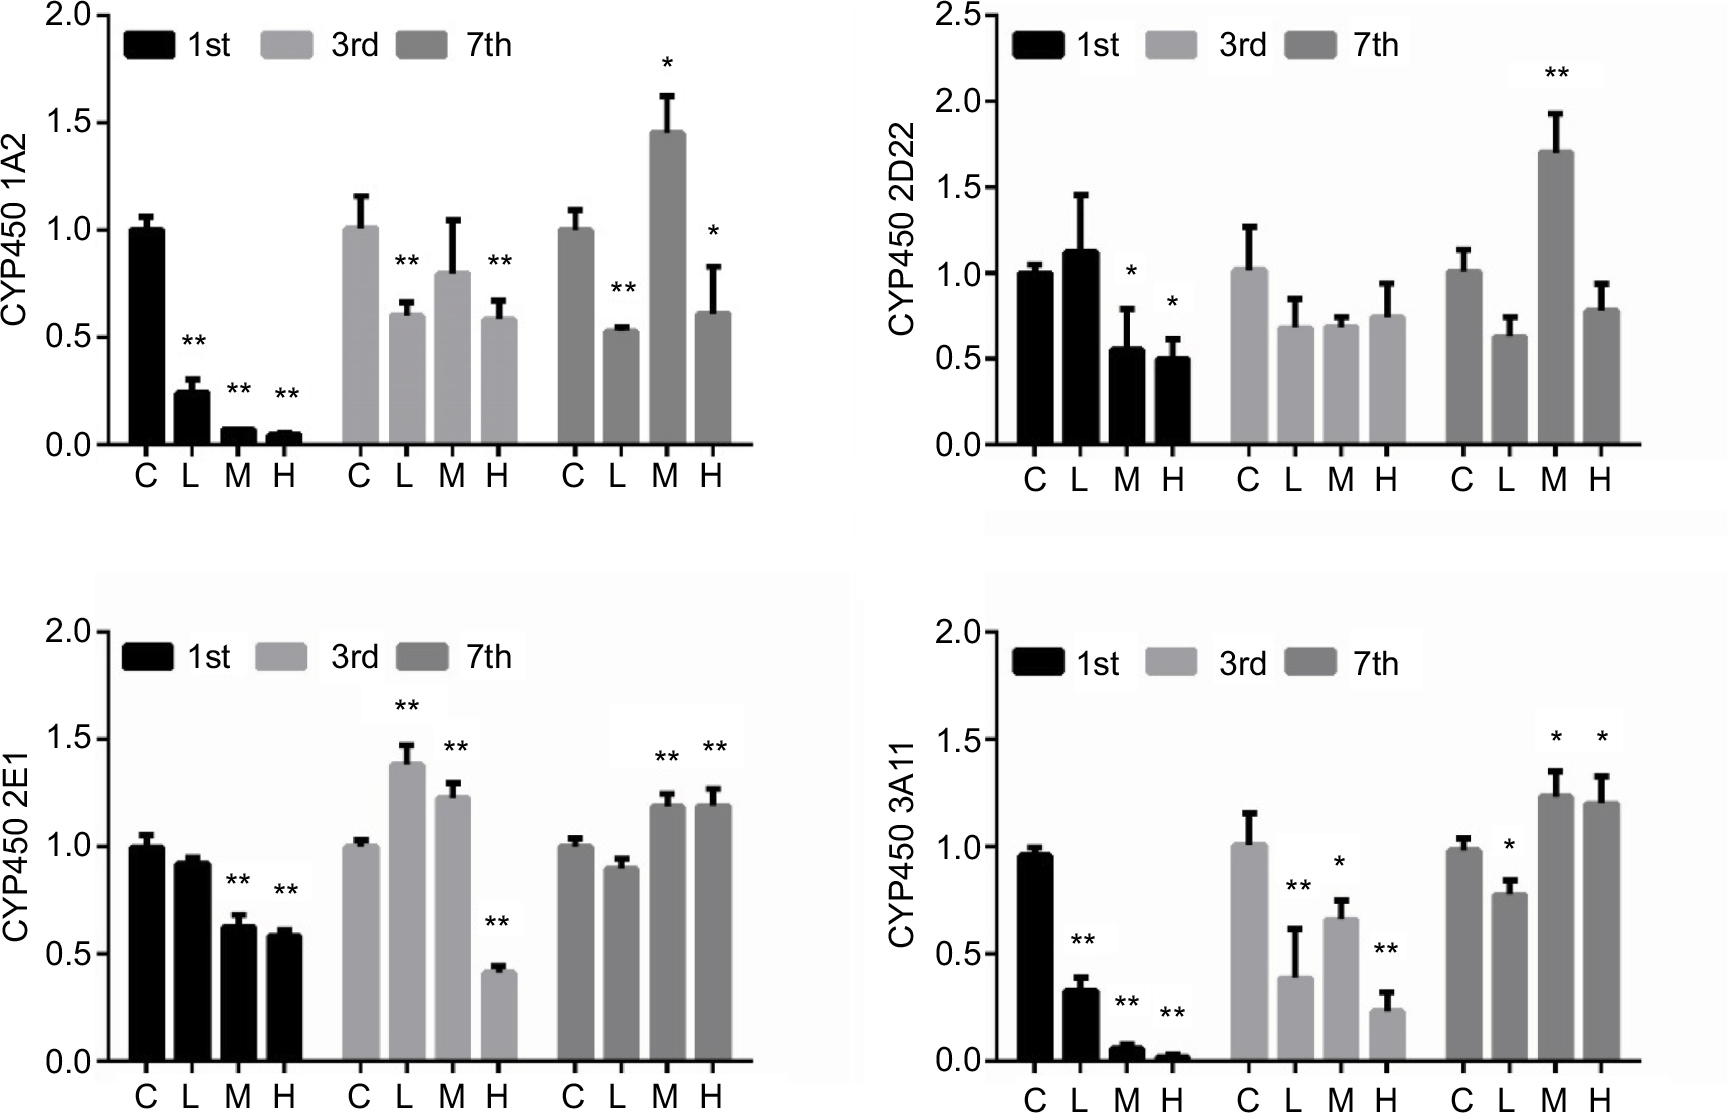 | Figure 4 The relative mRNA expression levels of CYP450 1A2 (A), 2D22 (B), 2E1 (C), and 3A11 (D) in the liver of mice. Note: *p < 0.05, **p < 0.01 compared with the control group. Abbreviations: C, control group; CYP450, cytochrome P450; H, high-dose group (4 × 10⁶ CFU/kg); L, low-dose group (1 × 10⁶ CFU/kg); M, middle-dose group (2 × 10⁶ CFU/kg). |
CYP450 activities
As shown in Figure 5, the trends in the activities of CYP450s were consistent with the observed mRNA levels. The activities of CYP450 1A2 and CYP450 3A11 decreased significantly in the infection groups on day 1. The activity of CYP450 1A2 was consistently suppressed on days 3 and 7, but recovered to normal levels in the M and L groups on day 3. The activity of CYP450 3A11 was continuously suppressed from day 3. CYP450 2D22 activity was decreased in the M and H groups on day 3. The activity of CYP450 2E1 was decreased significantly in the M and H groups for 7 days.
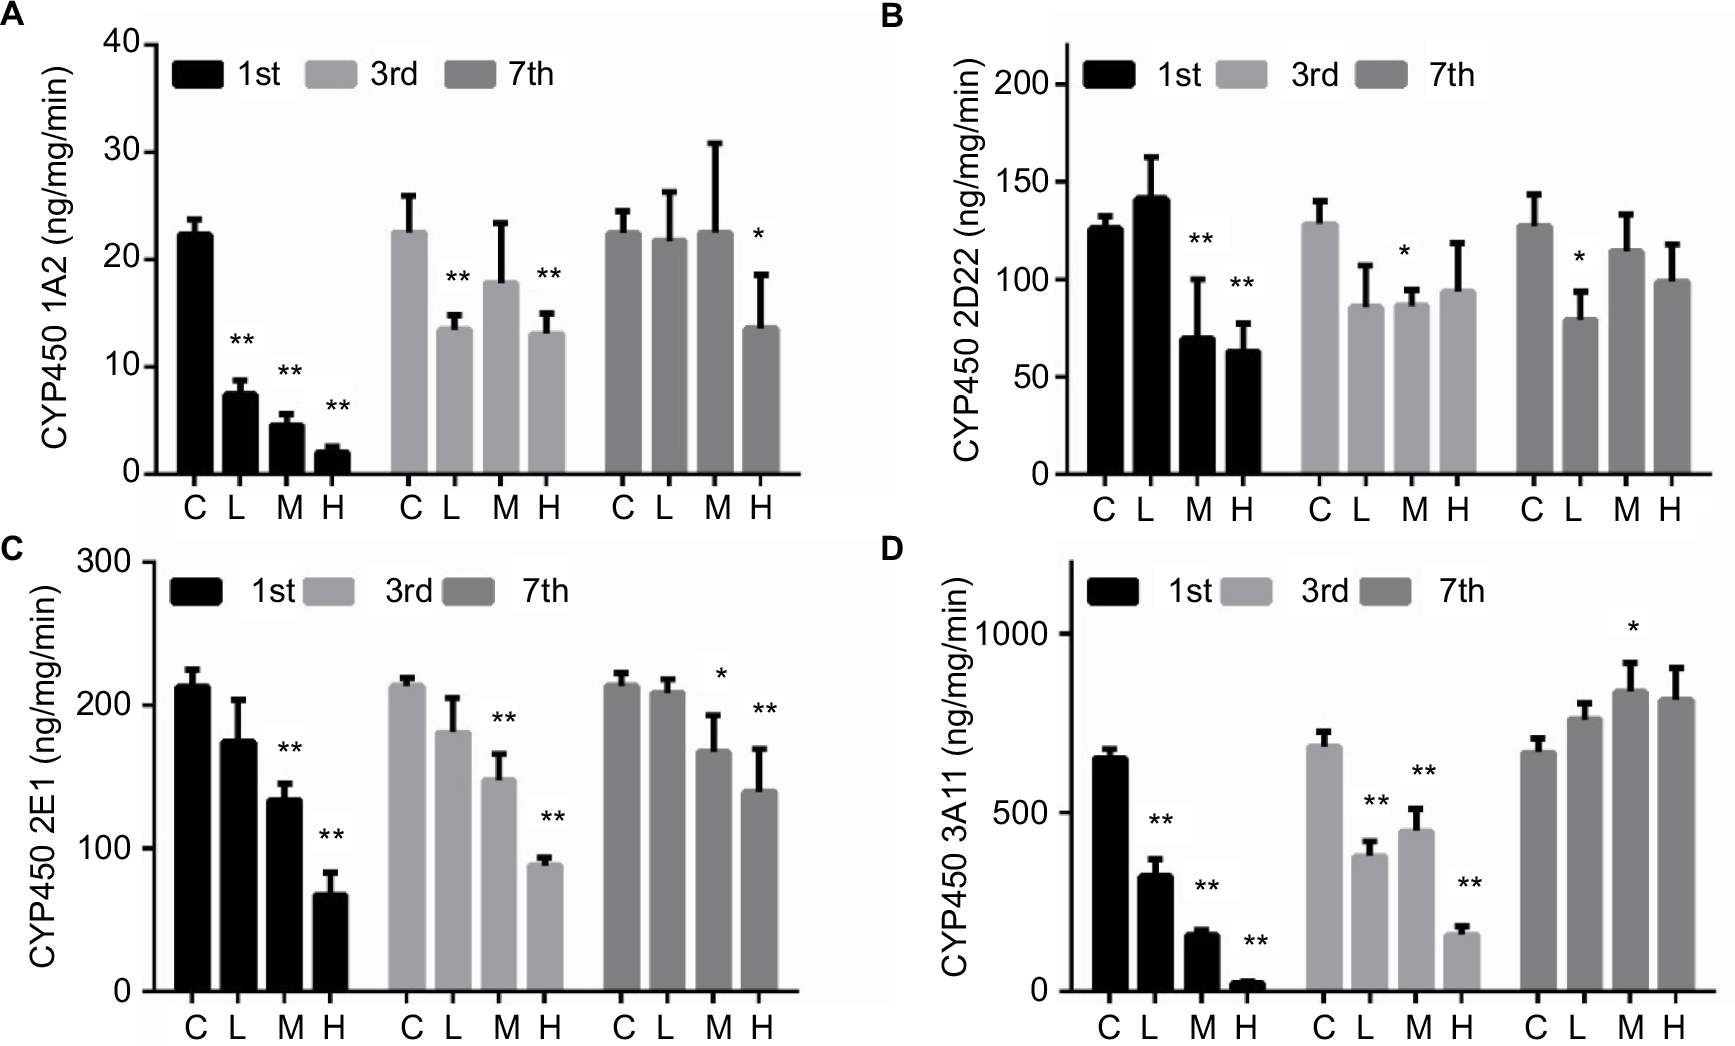 | Figure 5 The activities of CYP450 1A2 (A), 2D22 (B), 2E1 (C), and 3A11 (D) in the liver. Note: *p < 0.05, **p < 0.01 compared with the control group. Abbreviations: C, control group; CYP450, cytochrome P450; H is high-dose group (4 × 10⁶ CFU/kg); L, low-dose group (1 × 10⁶ CFU/kg); M, middle-dose group (2 × 10⁶ CFU/kg). |
Discussion
MRSA infection remains a serious hazard to global health; the complications caused by MRSA infection currently represent an unavoidable problem in clinical treatment and the toxins produced by the pathogen contribute to the most severe forms of the disease.29 The degree of infection will also depend on the patient’s physical condition, as older patients with other diseases are particularly prone to MRSA self-infection and may easily become a source of cross-infection.30 The three experimental doses applied in the present study were thought to reflect three different levels of infection; our results showed that 0.5× and 0.25× the MLD of MRSA resulted in 40% and 20% mortality in mice. The lethal dose was estimated to be 1.2 × 10⁶ CFU by intraperitoneal injection with MRSA in C57-BL6 and BALB/c mice.31 MRSA invades the bloodstream and produces acute systemic infections caused by toxins and other metabolites that lead to death. If a patient has low immunity, the MRSA infection will be more serious and the complexity of treatment will increase.32
Oxidative stress has been implicated in many chronic diseases.33 The process of chronic low-grade inflammation plays a central role in the pathogenesis of several chronic diseases.34 Oxidative stress and inflammation are closely related to pathophysiological processes, either of which can be easily induced by the other. Thus, both processes occur simultaneously in many pathological conditions.35,36 Several studies have indicated that MRSA infection could induce systemic inflammation and production of a large number of inflammatory mediators in both patients and experimental animals.37,38 The Toll-like receptor (TLR) family and nucleotide-binding oligomerization domain-containing proteins (NOD) family are the two main receptor families involved in the recognition of pathogen-associated molecular patterns and the induction of the inflammatory immune response,39 which causes the production of proinflammatory cytokines, such as IL-6, TNF-α, IL-1β, chemokines, interferons, and the anti-inflammatory cytokine IL-10.40 Our results indicated that MRSA induced a continuously high expression of proinflammatory cytokines, whereas the levels of IL-2 and TNF-α significantly decreased on the first day after MRSA infection. Given that a previous study showed that MRSA produced the short-term inhibition of white blood cells,41 we speculated that the mechanism of inhibition for some cytokines may be related to this effect. There are few reports to show that MRSA directly causes oxidative stress in vivo; however, given the link between inflammation and oxidative stress, we were unsurprised to find that MRSA leads to serious inflammation and oxidative stress in mice.
CYP450s are the main enzymes responsible for drug metabolism in the liver;42 their expression is regulated by various factors, including infection, disease, age, food, and stress.43–45 Inflammation and oxidative stress are the main causes for the changes of CYP450 caused by infection and other diseases.46 Researchers have found that infection and inflammation increase the expression of TNF-α, IL-2, and IL-6, which subsequently downregulated the expression of CYP450s.47 In addition to the inflammation caused by Escherichia coli, lipopolysaccharide is also a major cause of CYP450 enzyme inhibition.48 Therefore, the inhibition of CYP450s is caused by microbial infection and the toxins released by the pathogenic microorganisms. MRSA not only causes inflammation but also releases a variety of toxins in the host body, which lead to various deleterious effects.49,50 Jiang et al have reported that MRSA induced the production of IL-6, TNF-α, MCP-1, and IL-10, and caused liver damage in mice.51 MRSA can be recognized by TLR2 on the cell surface and by NOD2 in the cytosol, leading to the activation of NF-κB and MAPKs, which are responsible for the induction of proinflammatory cytokines by innate immune cells, including macrophages, dendritic cells, and neutrophils.52 The PI3K/Akt signaling pathway, together with the NF-κB and MAPK pathways, plays an important role in the peptidoglycan (PGN)-induced production of proinflammatory cytokines, chemokines. NF-κB has been implicated in the regulation of P450s through interaction with their induction mechanisms.53–55 Our results demonstrated that MRSA has a strong inhibitory effect on the mRNA levels and enzyme activities of CYP450 enzymes. The inhibitory effect of CYP450 1A2 and 3A11 was detected from 3 days after infection and resumed on the seventh day, whereas the inhibition effect of CYP450 2D22 and 2E1 lasted until 7 days after infection. MRSA infection caused the strongest inhibitory effects on the expression and activity of all enzymes on the first day of infection, and then decreases in IL-1β, IL-4, IL-6, and MIP-α were subsequently observed in the mouse liver. This inhibition of CYP450 enzymes was also accompanied by an increase in oxidative stress in the livers of mice infected with MRSA. As noted previously,56 different liver cytokine profiles are induced by different infectious or inflammatory stages; thus, it is to be expected that different infectious or inflammatory disease stages will have distinguishable effects on P450 expression and drug metabolism in the liver. Conversely, different cytokines will be responsible for the changes in P450 expression in different inflammatory states. Different doses of MRSA induce different release patterns of cytokines and oxidative stress at different infectious stages, which account for the changes in CYP450s.57
The CYP450 enzyme, a key determinant of drug–drug interactions, forms the basis of clinically personalized drug monitoring.58 For hospital-acquired infections that require anti-MRSA treatment, the infections are mostly accompanied by other diseases, so a variety of drugs are used concurrently. To avoid drug inefficiency or poisoning, it is important to consider the potential effects of pathogenic microorganisms on the host enzymes during the process of anti-infective treatment, especially for microorganisms which are constantly changing, to determine whether they will result in enhanced induction or inhibition of drug-metabolizing enzymes.
Conclusion
In conclusion, severe MRSA infection can cause strong inflammation and oxidative stress of the liver. This is mainly manifested by increased inflammatory factors, decreased antioxidant enzymes, and increased oxidative metabolites, which are accompanied by liver CYP450 enzyme expression and a rapid decrease in activity. Our results indicated that the drug treatment will be affected in the liver in cases of MRSA infection. Therefore, drug monitoring should be conducted to avoid unnecessary drug reactions in patients with MRSA.
Acknowledgments
This study was financially supported by grant from the Key Programs of the Chinese Academy of Sciences Sichuan Provincial Science and Technology Department (No. 2016JY0014), Sichuan provincial university research innovation team building program (No. 16TD0027), Chengdu University of Traditional Chinese national key disciplines in pharmacy, medicine research, and development of system resource utilization State Key Laboratory Breeding Base Open Fund, Sichuan Science and Technology Department of Science and Technology Support Program (No. 2016FZ0068), and Ministry of Education Chunhui Plan of China (No. Z2016120).
Disclosure
The authors report no conflicts of interest in this work.
References
Liu C, Bayer A, Cosgrove S. E, et al. Clinical practice guidelines by the Infectious Diseases Society of America for the treatment of methicillin-resistant Staphylococcus aureus infections in adults and children. Clin Infect Dis. 2011;52(3):e18–55. | ||
Li M, Wang Y, Zhu Y, et al. Increased community-associated infections caused by panton-valentine leukocidin–negative MRSA, Shanghai, 2005–2014. Emerg Infect Dis. 2016;22(11):1988–1991. | ||
Appelbaum P C. MRSA – the tip of the iceberg. Clin Microbiol Infect.2006;12(Suppl 2):3–10. | ||
Bal AM, David MZ, Garau J, et al. Future trends in the treatment of meticillin-resistant Staphylococcus aureus (MRSA) infection: an in-depth review of newer antibiotics active against an enduring pathogen. J Glob Antimicrob Resist. 2017;18(10):295–303. | ||
Purrello SM, Garau J, Giamarellos E, et al. Methicillin-resistant Staphylococcus aureus infections: a review of the currently available treatment options. J Glob Antimicrob Resist. 2016;7:178–186. | ||
Soranoglou V, Galanopoulos I, Giamarellos-Bourboulis EJ, et al. Efficacy of intramuscular moxifloxacin in the treatment of experimental osteomyelitis caused by methicillin-resistant Staphylococcus aureus. Int J Antimicrob Agents. 2017;50(2):186–190. | ||
Fessler A, Scott C, Kadlec K, Ehricht R, Monecke S, Schwarz S. Characterization of methicillin-resistant Staphylococcus aureus ST398 from cases of bovine mastitis. J Antimicrob Chemother. 2010;65(4):619–625. | ||
Yang X, Zhang J, Yu S, et al. Prevalence of Staphylococcus aureus and methicillin-resistant Staphylococcus aureus in retail ready-to-eat foods in China. Front Microbiol. 2016;7:816. | ||
Baker P, Cohen B, Liu J, et al. Incidence and risk factors for community-associated methicillin-resistant Staphylococcus aureus in New York City, 2006–2012. Epidemiol Infect. 2016;144(5):1014–1017. | ||
Abd El Tawab AA, Maarouf AAA, El-Hofyand FI, Mousa DH. Bacteriological and molecular studies on methicillin-resistant Staphylococcus aureus (MRSA) isolated from chicken meat and its products in Kaliobia Governorate. Benha Vet Med J. 2016;31(1):64–72. | ||
Takizawa Y, Shimizu T, Iwaya A, et al. A multiple superantigenic toxin pattern of methicillin-resistant Staphylococcus aureus (MRSA) as a risk factor in the development of toxic shock syndrome (TSS). Acta Medica Et Biologica. 2003;51:141–147. | ||
Torre A, Bacconi M, Sammicheli C, et al. Four-component Staphylococcus aureus vaccine 4C-Staph enhances Fc receptor expression in neutrophils and monocytes and mitigates S. aureus infection in neutropenic mice. Infect Immun. 2015; 83(8):3157–3163. | ||
Tsao SM, Hsu CC, Yin MC. Meticillin-resistant Staphylococcus aureus infection in diabetic mice enhanced inflammation and coagulation. J Med Microbiol. 2006;55(4):379–385. | ||
Khansari N, Shakiba Y, Mahmoudi M. Chronic inflammation and oxidative stress as a major cause of age-related diseases and cancer. Recent Pat Inflamm Allergy Drug Discov. 2009;3(1):73–80. | ||
Pou KM, Massaro JM, Hoffmann U, et al. Visceral and subcutaneous adipose tissue volumes are cross-sectionally related to markers of inflammation and oxidative stress: the Framingham Heart Study. Circulation. 2007;116(11):1234–1241. | ||
Tsao SM, Hsu CC, Yin MC. Garlic extract and two diallyl sulphides inhibit methicillin-resistant Staphylococcus aureus infection in BALB/cA mice. J Antimicrob Chemother. 2003;52(6):974–980. | ||
Tsao SM, Liu WH, Yin MC. Two diallyl sulphides derived from garlic inhibit meticillin-resistant Staphylococcus aureus infection in diabetic mice. J Med Microbiol. 2007;56(6):803–808. | ||
Muntane J. Regulation of drug metabolism and transporters. Curr Drug Metab. 2009;10(8):932–945. | ||
Renton KW. Regulation of drug metabolism and disposition during inflammation and infection. Expert Opin Drug Metab Toxicol. 2005;1(4):629–640. | ||
Morgan ET. Impact of infectious and inflammatory disease on cytochrome P450-mediated drug metabolism and pharmacokinetics. Clin Pharmacol Ther. 2009;85(4):434–438. | ||
Kikuchi R, McCown M, Olson P, et al. Effect of hepatitis C virus infection on the mRNA expression of drug transporters and cytochrome p450 enzymes in chimeric mice with humanized liver. Drug Metab Dispos. 2010;38(11):1954–1961. | ||
Wilson ID, Nicholson JK. Gut microbiome interactions with drug metabolism, efficacy and toxicity. Transl Res. 2017;179:204–222. | ||
Chaluvadi MR, Kinloch RD, Nyagode BA, et al. Regulation of hepatic cytochrome P450 expression in mice with intestinal or systemic infections of citrobacter rodentium. Drug Metab Dispos. 2009;37(2):366–374. | ||
Matsumoto K, Watanabe E, Kanazawa N, et al. Pharmacokinetic/pharmacodynamic analysis of teicoplanin in patients with MRSA infections. Clin Pharmacol. 2016;8(1):15–18. | ||
Rasmussen MK, Ekstrand B, Zamaratskaia G. Comparison of cytochrome P450 concentrations and metabolic activities in porcine hepatic microsomes prepared with two different methods. Toxicol in Vitro. 2011;25(1):343–346. | ||
Xu SF, Wu Q, Zhang BB, et al. Comparison of mercury sulfides with mercury chloride and methylmercury on hepatic P450, Phase-2 and transporter gene expression in mice. J Trace Elem Med Biol. 2016;37:37–43. | ||
Oestreicher MK. A simplified analytical method for a phenotyping cocktail of major CYP450 biotransformation routes. J Pharm Biomed Anal. 2004;35(5):1203–1212. | ||
Spaggiari D, Geiser L, Daali Y, Rudaz S. A cocktail approach for assessing the in vitro activity of human cytochrome P450s: an overview of current methodologies. J Pharm Biomed Anal. 2014;101:221–237. | ||
Yu KO, Randolph AG, Agan AA, et al. Staphylococcus aureus α-toxin response distinguishes respiratory virus–methicillin-resistant S. aureus coinfection in children. J Infect Dis. 2016;214(11):1638–1646. | ||
Yoshino K, Yasumatsu H, Sakae T, et al. MRSA infection in our hospital. Orthop Traumatol. 2010;44(4):1506–1508. | ||
Senna J, Aev A, dos Santos IB, et al. Determination of lethal and sublethal doses of Acinetobacter baumannii and methicillin-resistant Staphylococcus aureus (MRSA) in murine models using a reduced number of animals. JEAAS. 2015;1(3): 336–340. | ||
Shadyab AH, Crum-Cianflone NF. Methicillin-resistant Staphylococcus aureus (MRSA) infections among HIV-infected persons in the era of highly active antiretroviral therapy: a review of the literature. HIV Med. 2012;13(6):319–332. | ||
Stocker R, Keaney JF, Jr. Role of oxidative modifications in atherosclerosis. Physiol Rev. 2004;84(4):1381–1478. | ||
Wellen KE, Hotamisligil GS. Inflammation, stress, and diabetes. J Clin Invest. 2005;5(115):1111–1119. | ||
Barrett CW, Short SP, Williams CS. Selenoproteins and oxidative stress-induced inflammatory tumorigenesis in the gut. Cell Mol Life Sci. 2017;74(4):607–616. | ||
Biswas SK. Does the interdependence between oxidative stress and inflammation explain the antioxidant paradox. Oxid Med Cell Longev. 2016;2016(12):5698931. | ||
Ambrosch A, Halevy D, Fwity B, et al. Effect of daptomycin on local interleukin-6, matrix metalloproteinase-9, and metallopeptidase inhibitor 1 in patients with MRSA-infected diabetic foot. Int J Lower Extrem Wounds. 2013;12(2):100–105. | ||
Hou M, Zhang N, Yang J, et al. Antimicrobial peptide LL-37 and IDR-1 ameliorate MRSA pneumonia in vivo. Cell Physiol Biochem. 2013;32(3):614–623. | ||
McDonald C, Inohara N, Nunez G. Peptidoglycan signaling in innate immunity and inflammatory disease. J Biol Chem. 2005;280(21):20177–20180. | ||
O’Neill LA, Bowie AG. The family of five: TIR-domain-containing adaptors in Toll-like receptor signalling. Nat Rev Immunol. 2007;7(5):353–364. | ||
Griffin BR, Hamilton LA. Progression of a recurrent community-acquired methicillin-resistant Staphylococcus aureus (MRSA) infection. Lab Med. 2010;41(6):329–333. | ||
Scandlyn MJ, Stuart EC, Rosengren RJ. Sex-specific differences in CYP450 isoforms in humans. Exp Opin Drug Metab Toxicol. 2008;4(4):413–424. | ||
Fujita K. Food-drug interactions via human cytochrome P450 3A (CYP3A). Drug Metab Pers Ther. 2004;20(4):195–217. | ||
Guengerich FP. Cytochromes P450, drugs, and diseases. Mol Interv. 2003;3(4):194–204. | ||
Sinz M, Wallace G, Sahi J. Current industrial practices in assessing CYP450 enzyme induction: preclinical and clinical. AAPS J. 2008;10(2):391–400. | ||
Renton KW. Alteration of drug biotransformation and elimination during infection and inflammation. Pharmacol Ther. 2001;92(2–3):147–163. | ||
Renton KW. Regulation of drug metabolism and disposition during inflammation and infection. Exp Opin Drug Metab Toxicol. 2005;1(4):629–640. | ||
Fang C, Yoon S, Tindberg N, et al. Hepatic expression of multiple acute phase proteins and down-regulation of nuclear receptors after acute endotoxin exposure. Biochem Pharmacol. 2004;67(7):1389–1397. | ||
Rudkin JK, Laabei M, Edwards AM, et al. Oxacillin alters the toxin expression profile of community-associated methicillin-resistant Staphylococcus aureus. Antimicrob Agents Chemother. 2014;58(2):1100–1107. | ||
Lyttel JH, Morrison D, Gammack C, et al. A multiple superantigenic toxin pattern of methicillin-resistant Staphylococcus aureus (MRSA) as a risk factor in the development of toxic shock syndrome (TSS). Acta Medica Et Biologica. 2003;51(4):141–147. | ||
Jiang X, Wang Y, Qin Y, et al. Micheliolide provides protection of mice against Staphylococcus aureus and MRSA infection by down-regulating inflammatory response. Sci Rep. 2017;7:41964. | ||
Zheng Y, Guo Z, He W, et al. Ephedrine hydrochloride protects mice from LPS challenge by promoting IL-10 secretion and inhibiting proinflammatory cytokines. Int Immunopharmacol. 2012;13(1):46–53. | ||
Hayden MS, West AP, Ghosh S. NF-kappaB and the immune response. Oncogene. 2006;25(51):6758–6780. | ||
Zhou C, Tabb MM, Nelson EL, et al. Mutual repression between steroid and xenobiotic receptor and NF-kappaB signaling pathways links xenobiotic metabolism and inflammation. J Clin Invest. 2006;116(8):2280–2289. | ||
Gu X, Ke S, Liu D, et al. Role of NF-kappaB in regulation of PXR-mediated gene expression: a mechanism for the suppression of cytochrome P-450 3A4 by proinflammatory agents. J Biol Chem. 2006;281(26):17882–17889. | ||
Iber H, Sewer MB, Barclay TB, et al. Modulation of drug metabolism in infectious and inflammatory diseases. Drug Metab Rev. 1999;31(1):29–41. | ||
Aitken AE, Morgan ET. Gene-specific effects of inflammatory cytokines on cytochrome P4502C, 2B6 and 3A4 mRNA levels in human hepatocytes. Drug Metab Dispos. 2007;35(9):1687–1693. | ||
Nebert DW, Russell DW. Clinical importance of the cytochromes P450. Lancet. 2002;360(9340):1155–1162. |
 © 2018 The Author(s). This work is published and licensed by Dove Medical Press Limited. The full terms of this license are available at https://www.dovepress.com/terms.php and incorporate the Creative Commons Attribution - Non Commercial (unported, v3.0) License.
By accessing the work you hereby accept the Terms. Non-commercial uses of the work are permitted without any further permission from Dove Medical Press Limited, provided the work is properly attributed. For permission for commercial use of this work, please see paragraphs 4.2 and 5 of our Terms.
© 2018 The Author(s). This work is published and licensed by Dove Medical Press Limited. The full terms of this license are available at https://www.dovepress.com/terms.php and incorporate the Creative Commons Attribution - Non Commercial (unported, v3.0) License.
By accessing the work you hereby accept the Terms. Non-commercial uses of the work are permitted without any further permission from Dove Medical Press Limited, provided the work is properly attributed. For permission for commercial use of this work, please see paragraphs 4.2 and 5 of our Terms.