Back to Journals » Vascular Health and Risk Management » Volume 15
Effect of Long-Term Allopurinol Therapy on Left Ventricular Mass Index in Patients with Ischemic Heart Disease; A Cross-Sectional Study
Authors Alem MM ![]() , Aldosari SR
, Aldosari SR ![]() , Alkahmous AA, Obad AS, Fagir NM, Al-Ghamdi BS
, Alkahmous AA, Obad AS, Fagir NM, Al-Ghamdi BS ![]()
Received 5 August 2019
Accepted for publication 14 November 2019
Published 6 December 2019 Volume 2019:15 Pages 539—550
DOI https://doi.org/10.2147/VHRM.S226009
Checked for plagiarism Yes
Review by Single anonymous peer review
Peer reviewer comments 2
Editor who approved publication: Dr Daniel Duprez
Manal M Alem,1 Sarah R Aldosari,2 Alhassna A Alkahmous,2 Adam S Obad,2 Nagy M Fagir,3 Bandar S Al-Ghamdi2,3
1Department of Pharmacology, College of Clinical Pharmacy, Imam Abdulrahman Bin Faisal University, Dammam, Saudi Arabia; 2College of Medicine, Alfaisal University, Riyadh, Saudi Arabia; 3Heart Centre, King Faisal Specialist Hospital & Research Center, Riyadh, Saudi Arabia
Correspondence: Manal M Alem
Department of Pharmacology, College of Clinical Pharmacy, Imam Abdulrahman Bin Faisal University, PO Box 1982, Dammam 31441, Saudi Arabia
Email [email protected]
Background: Left ventricular hypertrophy (LVH), as assessed by measurement of left ventricular mass (LVM), is one of the most important cardiovascular risk factors. It is commonly present in patients with ischemic heart disease (IHD), irrespective of the level of blood pressure; recently, oxidative stress has been shown to be an important factor in its development. The question then arises: can this risk factor be modified by antioxidant treatment (e.g., with allopurinol, a xanthine oxidase inhibitor)?
Methods: This is an observational study with a cross-sectional design which explored the association between long-term (>12 months) allopurinol therapy and LV mass index (LVMI) as well as geometry in patients generally receiving standard treatments for IHD. The primary endpoint was LVMI measurement (by 2D-echocardiography) and secondary endpoints included the association of allopurinol use with LV function (ejection fraction), blood pressure, glycemic control, and lipid profile.
Results: Ninety-six patients on standard anti-ischemic drug treatment (control group) and 96 patients who were additionally taking allopurinol (minimum dose 100 mg/day) were enrolled. Both groups were matched for age, sex, height, and co-morbidities, but poorer kidney function in the allopurinol group required further sub-group analysis based on renal function. Allopurinol treatment was associated with the lowest LVMI in the patients with normal serum creatinine (median LVMI; 70.5 g/m2): corresponding values were 76.0 and 87.0 in the control group with, respectively, normal and elevated serum creatinine, and 89.5 in the allopurinol group with elevated serum creatinine (P=0.027). In addition, allopurinol was associated with better glycemic control (HbA1c) with a difference of 0.8% (95% CI; 1.3, 0.2) (P=0.004) as compared with control patients.
Conclusion: In our population, treatment with allopurinol (presumably because of its anti-oxidant properties) has shown a tendency to be associated with smaller LVM in IHD patients with normal serum creatinine, along with better glycemic control.
Keywords: IHD, LVMI, left ventricular geometry, allopurinol, glycemic control, HbA1c, Saudi Arabia
Introduction
Cardiovascular disease is the most common cause of death worldwide and ischemic heart disease (IHD) is the principal culprit. The Framingham Heart study (1970) established the left ventricular hypertrophy (LVH) as one of the most important risk factors for ischemic heart disease and mortality in a cohort of 5127 men and women over 14 years of follow-up.1 Electrocardiography was initially used for the detection of LVH, but this was replaced by echocardiographic techniques that allowed reliable, accurate, and non-invasive estimation of left ventricular mass (LVM). Echocardiographic measurements were then obtained in a cohort of 3220 men and women participating in the Framingham Heart study and were followed for 4 years to establish the prognostic value of LVM beyond traditional cardiovascular risk factors.2 Left ventricular (LV) geometric patterns were later found to possess an independent prognostic significance, with concentric hypertrophy having the worst prognosis, followed by eccentric hypertrophy, concentric remodeling, and normal geometry.3,4 In patients with IHD, left ventricular hypertrophy is an essential and common pathological finding irrespective of incident hypertension.5 In fact, its occurrence in this population carries an adverse impact on survival that is significantly greater than that of multivessel disease or LV systolic dysfunction.6 Another cardiovascular risk factor that has been significantly associated with LVM is serum uric acid, such association was studied mostly in hypertensive population7–11 with sex-related differences,9,10 and in general population studies12–14 with a wide range of serum uric acid concentration. More recent research has built up that oxidative stress and reactive oxygen species (ROS) (e.g., superoxide (O−2), hydroxyl radical (•OH), and hydrogen peroxide (H2O2)) creating nitroso-redox imbalance and mediate the development of LVH and remodeling.15 Xanthine oxidoreductase or xanthine oxidase (XO) is an enzyme system that is primarily responsible for uric acid production as the terminal product of purine metabolism contributes to the generation of ROS and oxidative stress. This raises the possibility that an “old” class of drugs, i.e., the xanthine oxidase inhibitors, might be repositioned among cardiovascular prevention strategies. The xanthine oxidase inhibitor drug, allopurinol, has shown antioxidant properties and prevented cardiac hypertrophy and remodeling in both animal models16–18 and clinical studies19–21 in addition to uric acid reduction. Since, concomitant allopurinol therapy is commonly added to standard anti-ischemic drug regimens in patients with IHD, due to hyperuricemia or gout. We sought via this cross-sectional study to explore any extra advantage allopurinol therapy might have on LV structure or geometric pattern in a Saudi population with IHD.
Methods
Study Design and Setting
This is an observational study with a cross-sectional design to test the association between long-term allopurinol use and LV mass index, and LV geometric pattern, on a random sample of patients with IHD, treated with standard anti-ischemic drug regimens. Secondary endpoints included its association with LV function (assessed by ejection fraction EF), blood pressure, glycaemic index, and lipid profile. The reporting system of this study was in accordance with the Strengthening the Reporting of Observational Studies in Epidemiology (STROBE) statement.22 And where applicable, sensitivity analysis was performed.
Participants
Selected patients were on regular follow-up with The Heart Center, King Faisal Specialist Hospital and Research Center (KFSH-RC), Riyadh, Saudi Arabia. The KFSH-RC is a 1589-bed tertiary health care institute, and referral center located in Riyadh, the capital of Saudi Arabia. Patients were enrolled into the allopurinol group if they were >18 years of age, diagnosed with ischemic heart disease according to one of the following criteria: cardiac catheterization, CT coronary angiography, cardiac nuclear medicine, or the presence of regional wall motion abnormalities consistent with myocardial ischemia or infarction and receiving allopurinol therapy (with any dose) for gout or hyperuricemia for a minimum of 12-month duration.
These patients were selected with the help of Hospital Information Technology Affairs (HITA) with search terms of IHD and allopurinol therapy for all inpatients who were admitted electively or from emergency department from Jan 1st 2010 till Dec 31st 2017. Original search revealed 10,708 patients who were sub-divided to 907 patients on allopurinol therapy (from which active arm was selected randomly) and the remaining 9801 were not on such therapy (from which control patients were selected).
Control patient selection was based on one-to-one matching according to age, sex, and systemic hypertension. Patients were excluded if they were awaiting percutaneous coronary angiography (PCI), coronary artery bypass grafting (CABG) for urgent or severe IHD, had moderate-severe valvular heart disease, or uncontrolled blood pressure (>180/120 mmHg). The study was conducted in accordance with the ethical principles contained in the Declaration of Helsinki (2013), the ICH Harmonized Tripartite Good Clinical Practice Guidelines, the policies and guidelines of the Research Ethics Committee (REC) of the KFSH-RC, and the laws of Saudi Arabia. The study protocol was approved by Research Ethics Committee at KFSH-RC (Project 2181034), Riyadh, Saudi Arabia. A waiver of signed consent was obtained based on the study design and lack of intervention.
Study Flow Chart
Suitable patients were identified based on the flow chart presented in Figure 1.
 |
Figure 1 Study flow chart. Abbreviations: HITA, Hospital Information Technology Affairs at King Faisal Specialist Hospital and Research Center; IHD, ischemic heart disease. |
Variables
Data collected included: demographic information (age, sex, nationality, height, weight, body mass index (BMI)); ischemic heart disease presentation (stable angina, unstable angina, ST-elevation myocardial infarction (STEMI), non ST-elevation myocardial infarction (NSTEMI)); the investigation modality for their IHD (cardiac catheterization, CT coronary angiography, cardiac nuclear imaging, and/or echocardiography); and co-morbidities; including systemic hypertension, diabetes mellitus (DM), chronic heart failure (CHF) transient ischemic attacks (TIA), stroke, and smoking status. Their cardiac medications were recorded; these included angiotensin-converting enzyme inhibitors (ACEI), angiotensin receptor blockers (ARB), beta-blockers, calcium channel blockers, nitrates, thiazide/loop diuretics, aldosterone receptor antagonists, antiplatelet agents, and statins.
Anti-diabetic medications were also recorded (insulin preparations, sulphonylureas, biguanides, meglitinides, thiazolidinediones, alpha glycosidase inhibitors, dipeptidyl peptidase-4 inhibitors, and glucagon-like peptide-1 analogs). For the allopurinol group, the dose, start date, discontinuation date (if relevant), duration of therapy in months, and serum uric acid (if available).
The transthoracic echocardiogram report was reviewed, and data such as systolic blood pressure (SBP), diastolic blood pressure (DBP), heart rate (HR), along with LV required dimensions to calculate LV mass (LVM), LV mass index (LVMI), LV geometry pattern, and ejection fraction were incorporated.
The duration of allopurinol therapy was calculated in relation to the date of the echocardiogram report, confirming that it was more than or equal to12 months. Blood biochemistry (renal function test, serum uric acid, glycated hemoglobin (HbA1c), lipid profile) was extracted to match the echocardiogram date. Correspondingly, for the control group, the most recent echocardiogram was taken along with the matching blood biochemistry data.
Measurements of LVM, LVMI, and LV Geometric Pattern
LVM was calculated according to the guidelines of the American Society of Echocardiography and the European Association of Cardiovascular Imaging, using linear measurements derived from transthoracic echocardiogram 2-D images according to the following equation:23

LVM was indexed to body surface area (BSA) (g/m2) and referred to as LVMI because of the strong association between LVM and BSA.24 Left ventricular relative wall thickness (RWT) was calculated using the formula (2 × posterior wall thickness)/(LV end diastolic dimension).23 This allows further classification of LV geometry, according to the following criteria:
- Patients with normal LVM can either have normal geometry (RWT ≤ 0.42) or concentric remodeling (RWT ≥ 0.42)
- Patients with increased LVM can have either concentric hypertrophy (RWT ≥ 0.42) or eccentric hypertrophy (RWT ≤ 0.42)
There are reports in the literature that LVH has been underestimated in overweight or obese patients if indexed to BSA.25 Therefore, it was recommended to use LVM indexed to height to allometric power of 2.7 for more reliable evaluation of LVM in overweight/obese patients.26 However, the indexation for risk stratification in obese patients remains debatable.
Sample Size
According to the study by Myerson et al which calculated the sample size needed to detect a statistically significant change in mean LV mass of 10 g with 90% power, 78 patients in each group would be required if 2D echocardiogram was used for the LVM measurement.27 Accordingly, 100 patients were targeted for recruitment in each group, with 2 groups of 96 patients included in the final analysis.
Statistical Analysis
Data are reported as mean ± SD for continuous variables and as a number and percentage for categorical variables. Median and interquartile ranges were used for non-normally distributed data. The two-sample t-test and chi-square test were used to compare the two groups in terms of continuous, and categorical variables, respectively. The Mann–Whitney U-test was used for non-normally distributed data. Relationships between continuous variables were quantified using the Spearman’s rank correlation coefficient. Sensitivity analysis was performed to compare LVMI among patient groups using the Kruskal–Wallis test. Multiple linear regression analysis was done for the whole patient population to determine the predictors of LVMI (g/m2). Independent variables included in the model were basic demographic factors (age, sex, SBP, BMI), allopurinol use, underlying systemic hypertension or DM, and serum creatinine. All statistical analyses and normality testing were done using Minitab Statistical Software, V18, Pennsylvania, USA.
Results
Baseline Characteristics
According to the study flow chart, 192 patients (64% male) with IHD (83% diagnosed primarily by cardiac catheterization) were enrolled in the final analysis of the study. Table 1 shows the baseline characteristics of the two patient groups which were matched for age, sex, and height. However, the allopurinol group patients were heavier: with an estimated weight difference of 10 kg (95% CI; 4.3, 16) (P=0.001) and an estimated BMI difference of 3.6 (95% CI; 1.6, 5.6) (P=0.000) (Mann–Whitney U-tests).
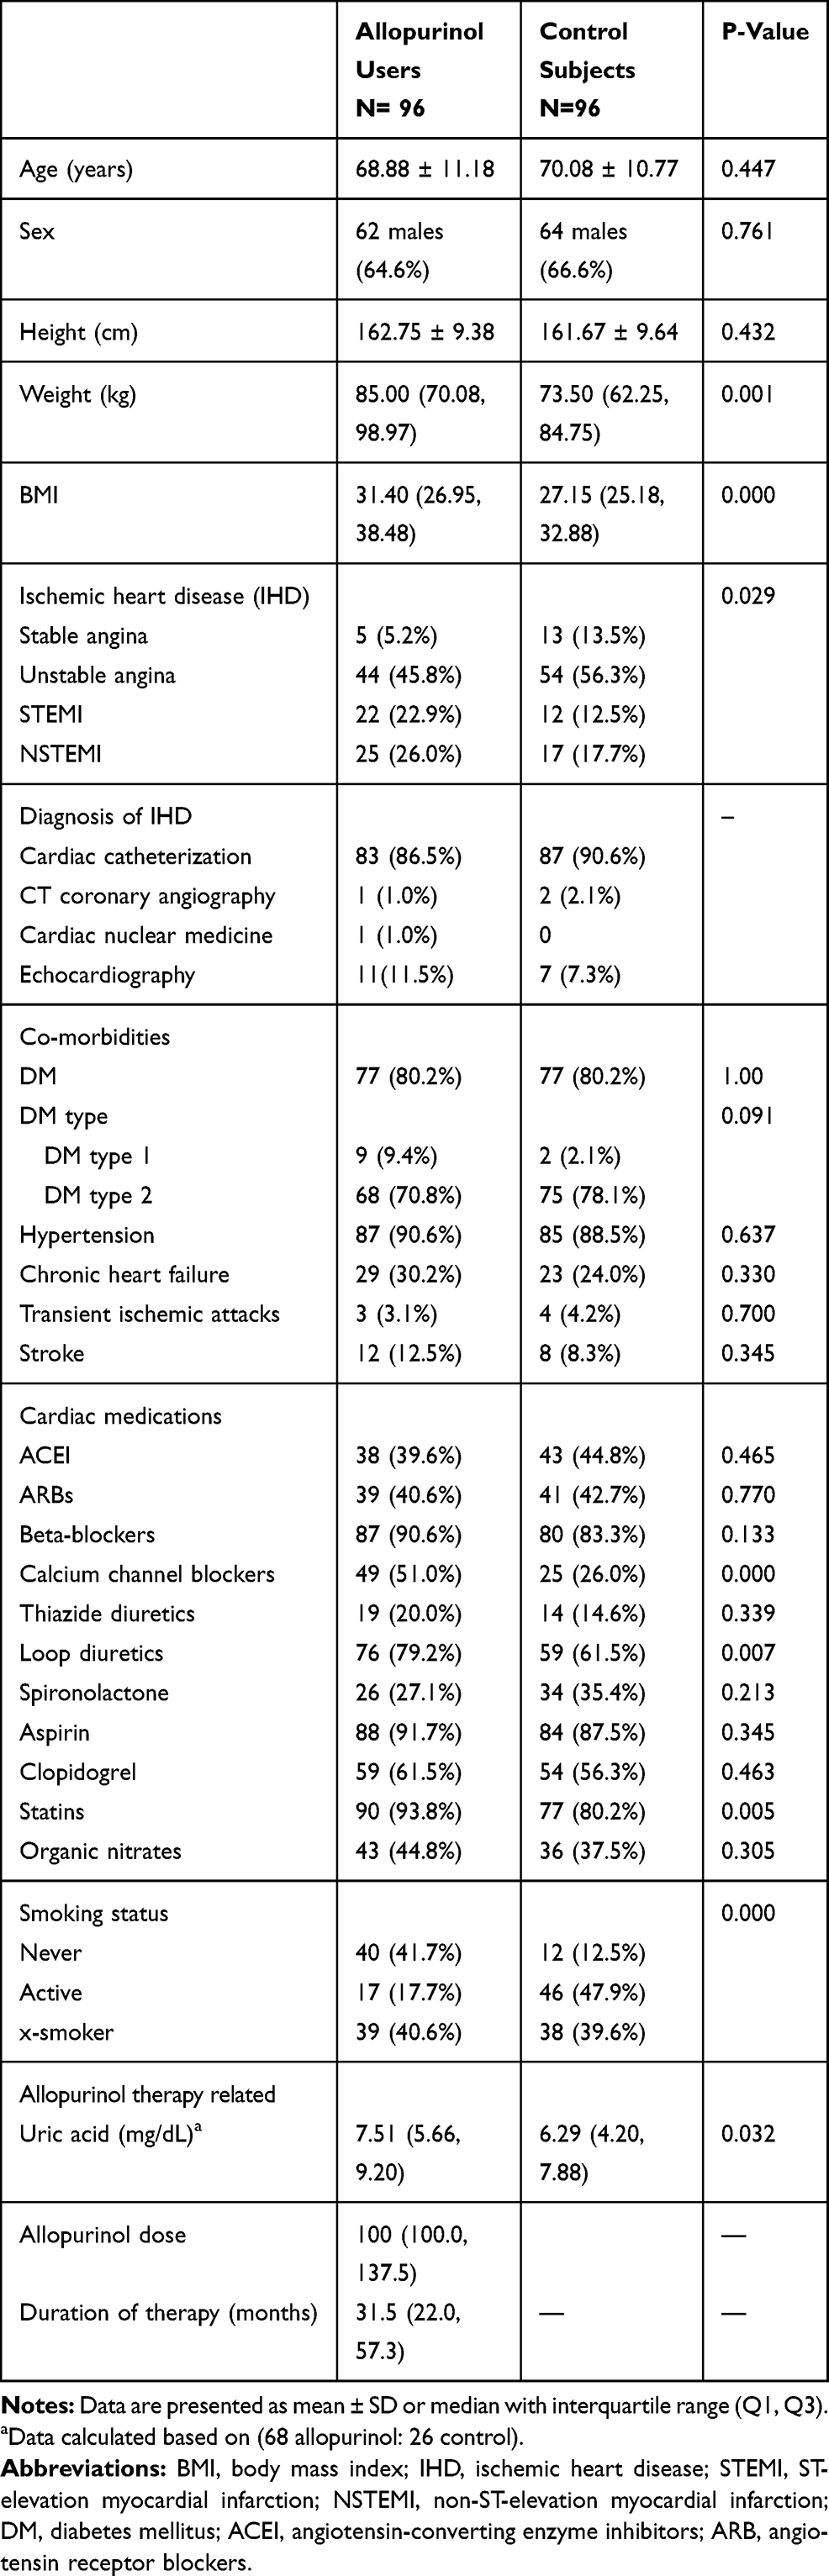 |
Table 1 Baseline Patient Characteristics |
The two groups were matched for co-morbidities including systemic hypertension (87%), DM (80%), CHF (29%), stroke (10%), and TIA (3.6% of the participants). They were also matched for their cardiac medications apart from a significantly higher number of patients on calcium channel blockers, loop diuretics and statins in the allopurinol group.
The median dose of allopurinol in this study was relatively small – 100 mg/day (a minimum dose of 50 mg/day and a maximum dose of 300 mg/day). This reflects dose adjustments according to kidney function and eGFR in the allopurinol group. The median duration of allopurinol therapy was 31.5 months (a minimum duration was 12 months, and a maximum duration was 87 months). Unfortunately, prior to referral to KFSH-RC, measurements of uric acid were not part of the routine (Table 1).
Study Endpoints
The primary endpoint of this study was to compare LVMI and LV geometric patterns among the two patient groups. Table 2 shows that LVM was higher in the allopurinol group as compared with the control group (P=0.022). This difference disappeared when LVMI (BSA) was compared between the two groups (P=0.340), but it persisted when LVMI (height 2.7) was used (P=0.046). Relative wall thickness was similar between the two groups and comparison of the LV geometric patterns failed to show any significant difference.
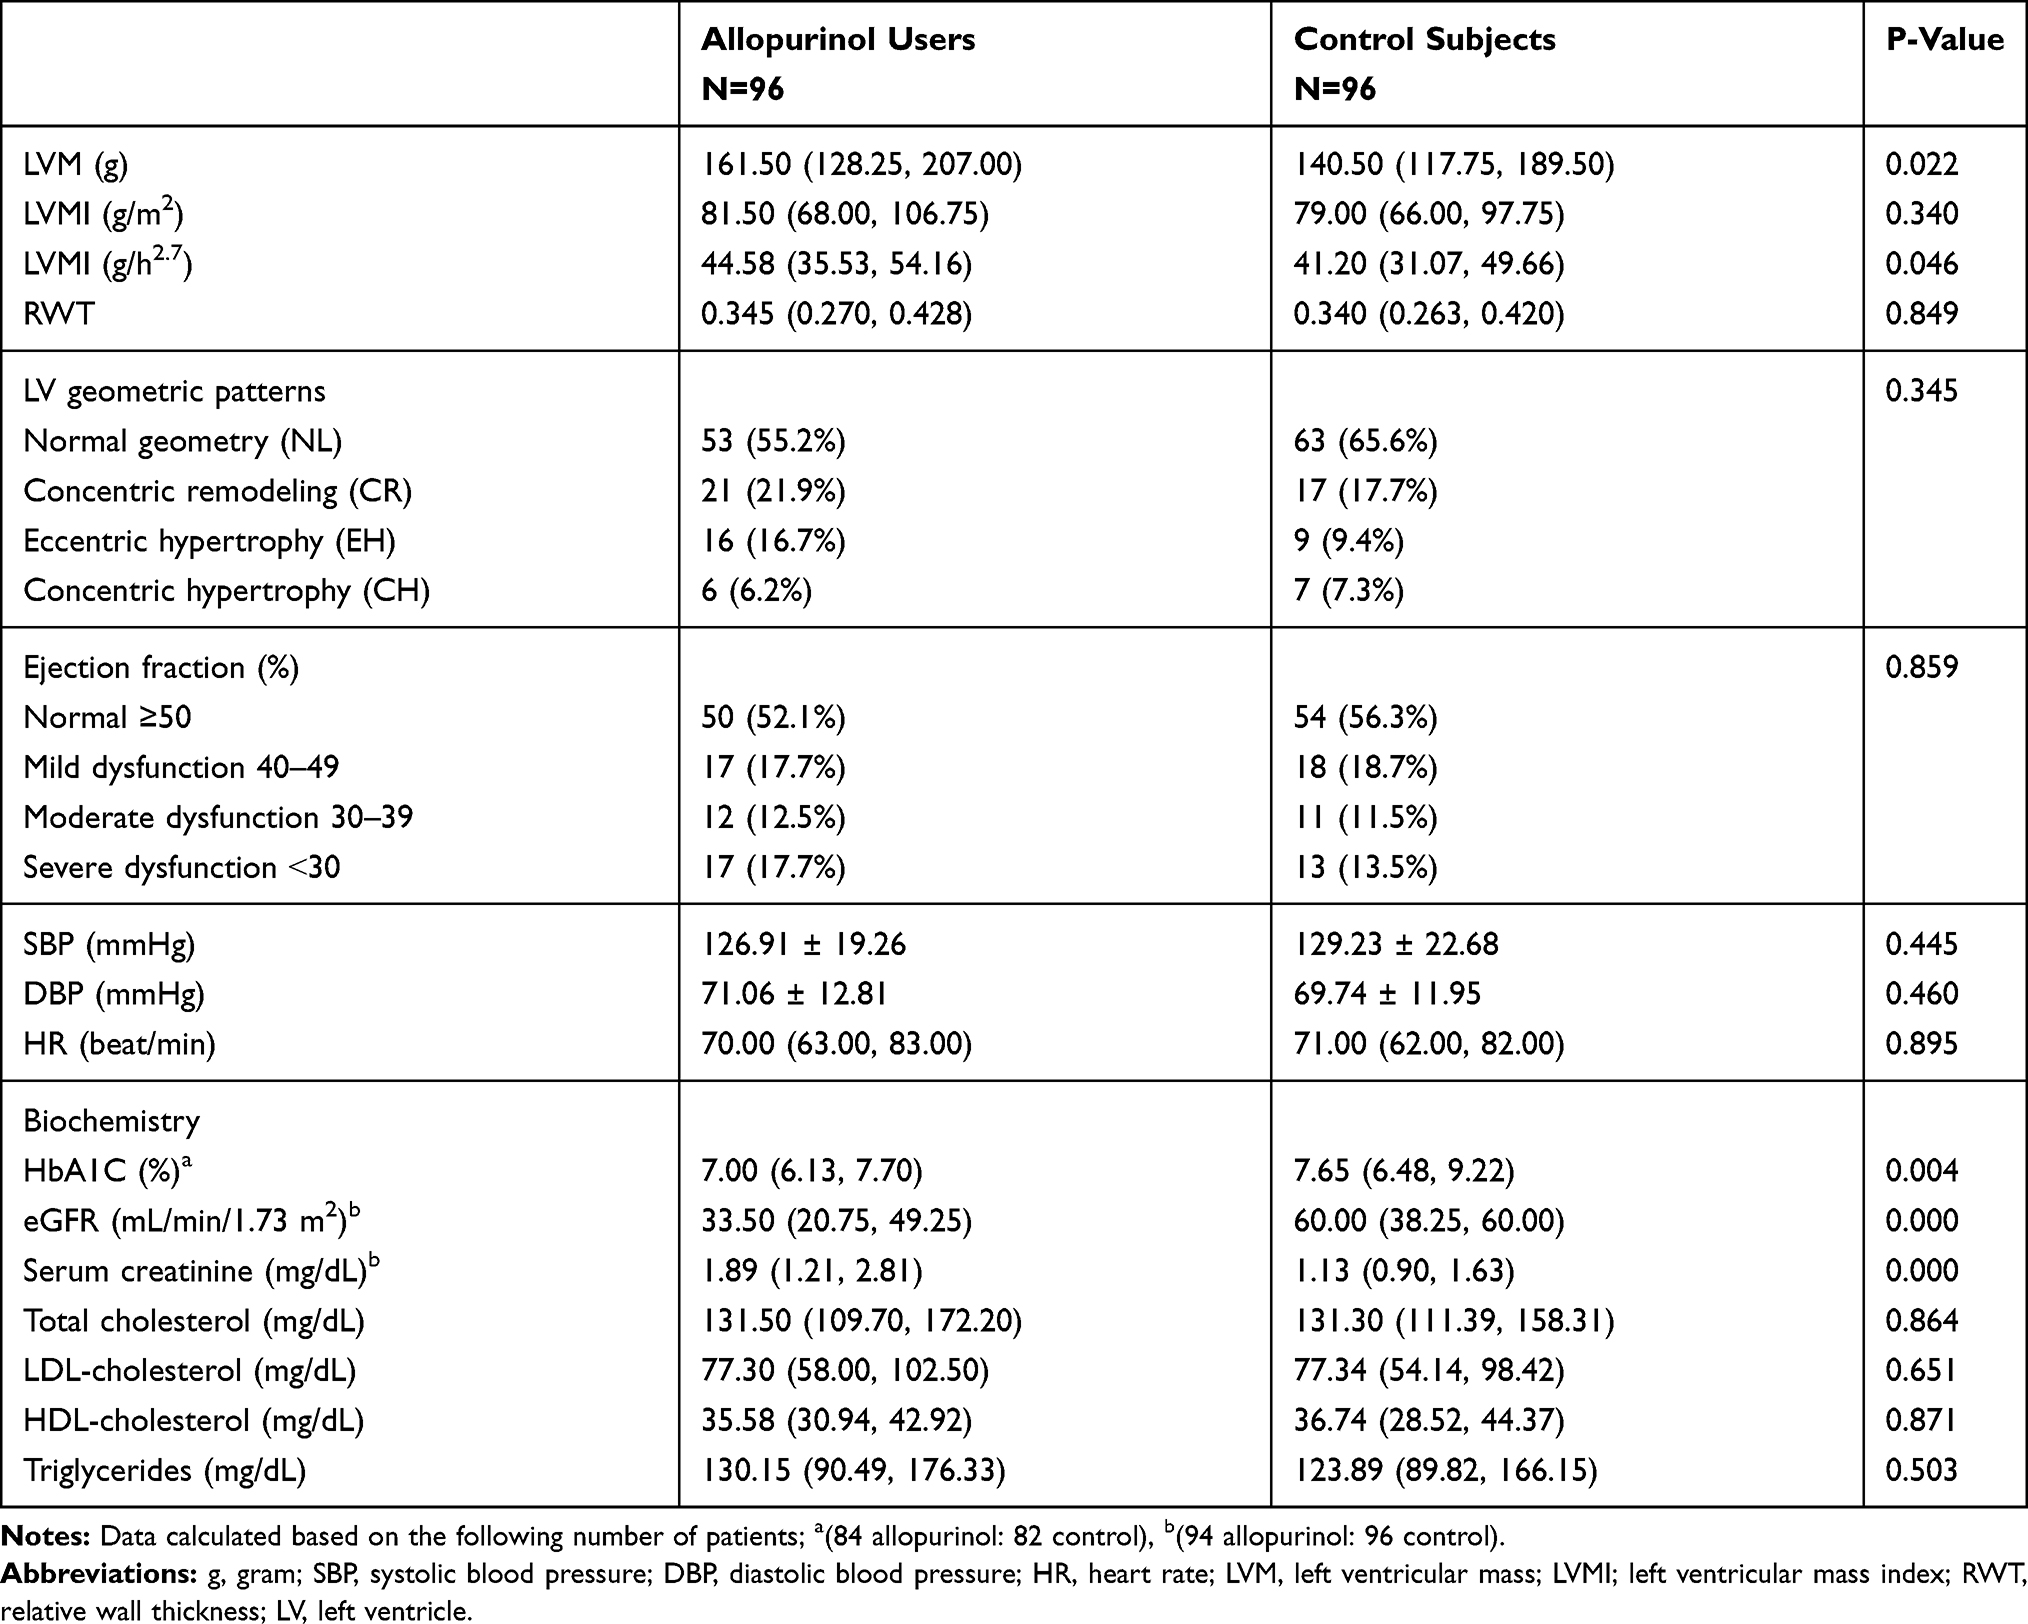 |
Table 2 LVMI, LV Geometric Patterns, Hemodynamics, and Biochemical Profile for the Two Study Groups |
Secondary endpoints of this study included the association of allopurinol therapy with LV function (ejection fraction EF), systolic blood pressure (SBP), diastolic blood pressure (DBP), and lipid profile. None of these endpoints showed a significant difference between study groups (Table 2).
Other Biochemical Endpoints
Glycated hemoglobin (HbA1C), which reflects recent glycemic control over 2–3 months, was found to be significantly lower in the allopurinol group compared with the control group. The estimation for the difference was −0.8% (95% CI; −1.3, −0.2) (P=0.004) in favor of allopurinol therapy, despite similar incidence of DM between the two study groups, and comparable use of insulin and oral hypoglycemic agents (Tables 1–3). Another observation in this random sample of patients on allopurinol therapy was that they had significantly poorer kidney function when compared with control patients.
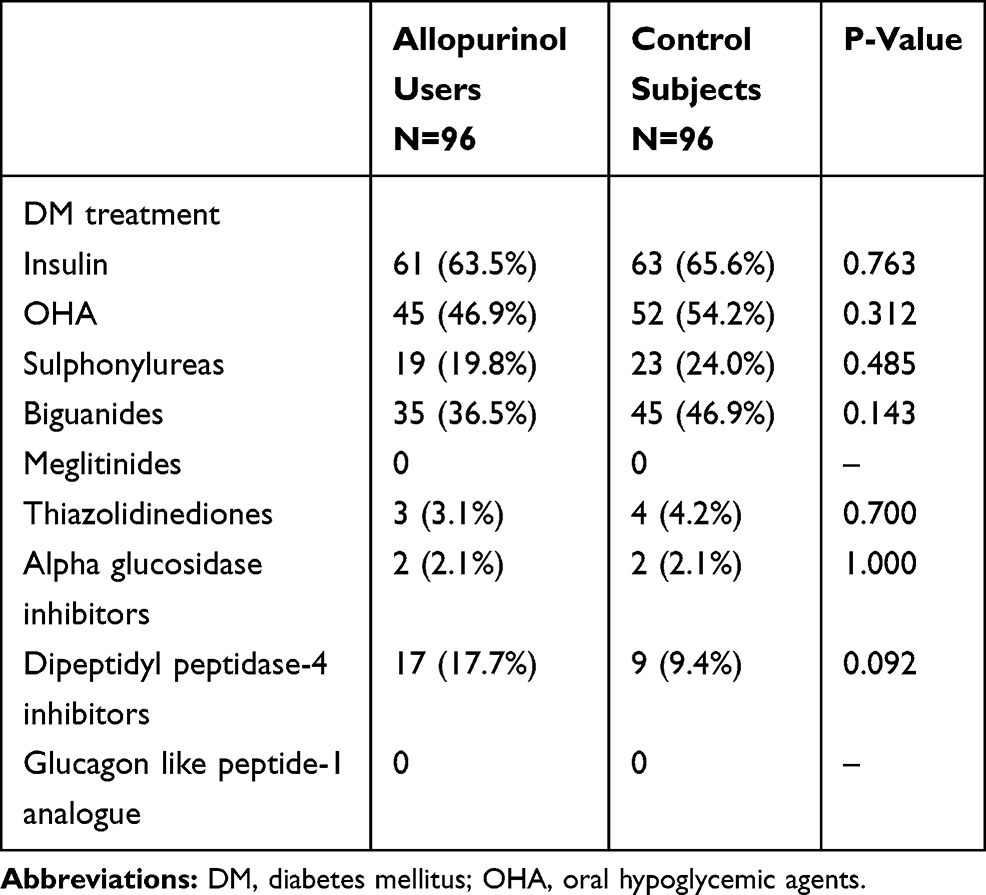 |
Table 3 Treatment of DM in the Two Study Groups |
In our hospital, it was not possible to obtain the exact estimated Glomerular filtration rate (eGFR) if it is above 60 mL/min/1.73 m2. Accordingly, GFR stages 1 and 2 are considered as one group. In this combined stage of GFR, there are 18 patients in the allopurinol group (18.75%), as compared with 49 patients in the control group (51.04%) (P=0.000). Based on this classification, the estimation for the difference in eGFR between the two groups was −14 mL/min/1.73 m2 in allopurinol group compared with the control group (95% CI; −21, −8) (P=0.000). Corresponding difference in serum creatinine was 0.62 mg/dL that came to be higher in allopurinol group compared with controls (95% CI; 0.37, 0.87) (P=0.000) (Table 2). Due to this biochemical limitation, serum creatinine level was used in the multiple linear regression analysis.
Predictors of LVMI and LV Geometric Patterns in This Patient Population
LVMI in this sample of 192 patients with IHD was further analyzed by correlation analysis and multiple linear regression to explore its relationship with the reported hemodynamic or biochemical factors. Table 4 demonstrates that LVM correlated positively with BMI, while LVMI correlated negatively with it. Kidney function estimated by eGFR had a significant negative relationship with LVMI, and serum creatinine had a positive correlation with LVM and LVMI. Age, blood pressure, and serum uric acid were not significantly correlated with LVM or LVMI in this patient population (Table 4).
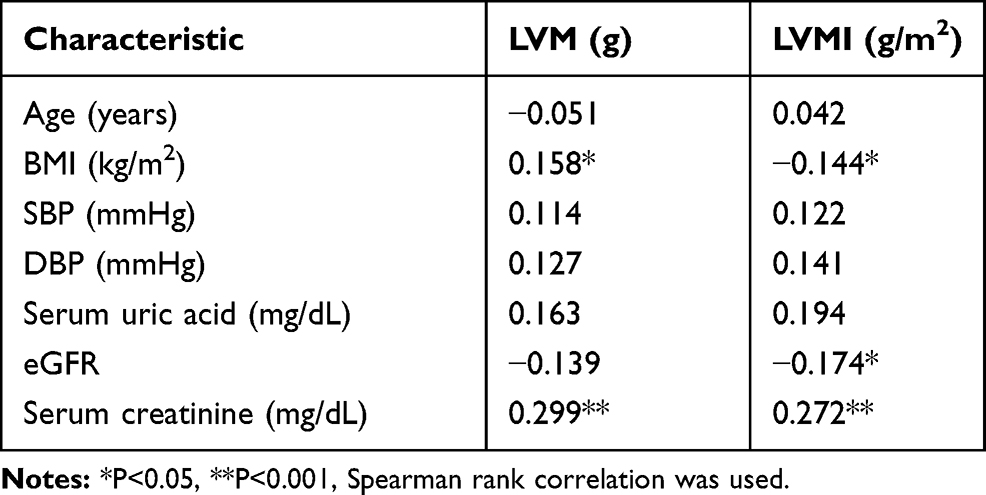 |
Table 4 Correlation of Clinical and Hemodynamic Characteristics with LVM and LVMI in All Patients |
Results from the multiple regression analysis showed that the significant predictors of LVMI were female sex (β=−13.30, p=0.005), and serum creatinine (β=6.08, p=0.000). This suggests that LVMI in this patient population is likely to be lower in female patients and higher in those with abnormally high serum creatinine. Allopurinol use was not a significant predictor of LVMI. This model explained 18% of the variability in LVMI, as indicated by the R-square values (Table 5). With such strong relationships between LVMI and BMI and kidney function, and the unexpected differences between the two study groups, sensitivity analysis was performed due to baseline imbalances to see if these confounding factors might have masked any benefit for allopurinol use.
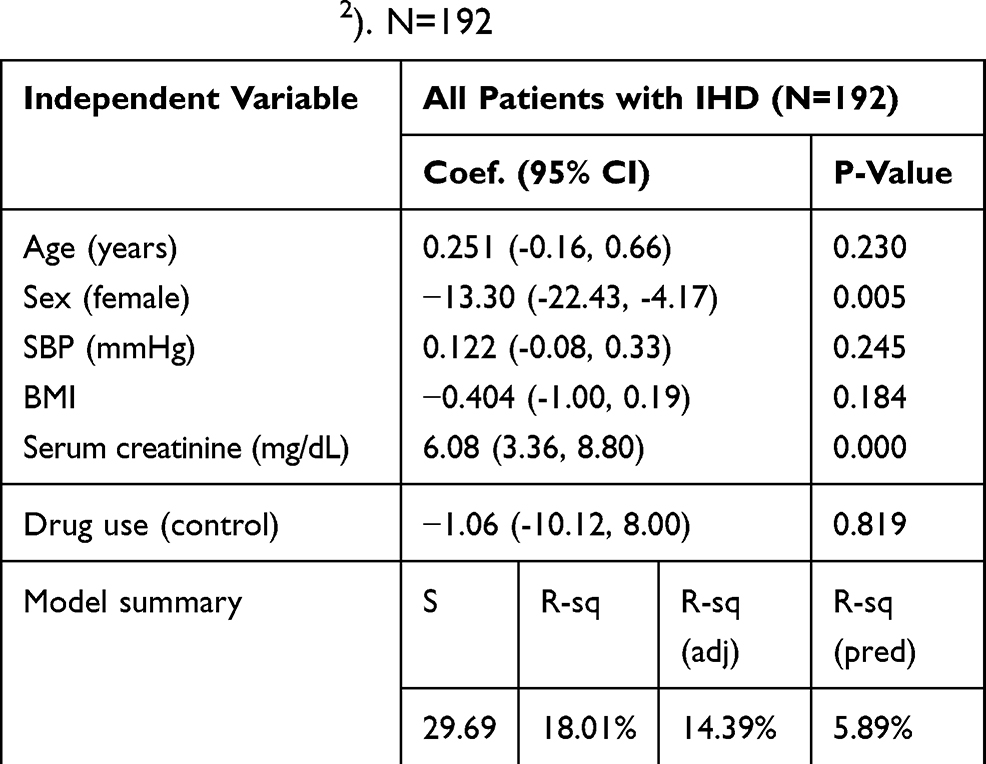 |
Table 5 Multiple Linear Regression Model for Left Ventricular Mass Index LVMI (g/m2). N=192 |
Sensitivity Analysis
Comparison of LVMI (g/m2) among the patients was performed using the Kruskal–Wallis test. The patients were divided into 4 groups based on allopurinol use and serum creatinine: normal serum creatinine, up to 1.2 mg/dL (group 1, n= 24); allopurinol users with normal serum creatinine (group 2, n=70); allopurinol users with abnormally high serum creatinine (group 3, n=57); control patients with normal serum creatinine and (group 4, n=39); control patients with abnormally high serum creatinine (Table 6). LVMI comparisons showed that there were significant differences among the 4 groups: the lowest LVMI value observed in the allopurinol group with normal serum creatinine (median LVMI; 70.5), while corresponding values in the other groups were 76.0 in the control group with normal serum creatinine, 89.5 in the allopurinol group with abnormally high serum creatinine, and 87.0 in the control group with abnormally high serum creatinine (P=0.027) (Table 6). Pairwise comparisons between group 1 vs group 3, and group 2 vs group 4 did not reach statistical significance with, respectively, p=0.377 and p=0.364.
 |
Table 6 Comparison of LVMI (g/m2) Among the 4 Patient Groups |
Comparison of LVMI indexed to height (g/h2.7) as our population is overweight-obese, among the 4 groups using the same test showed similar results. There is a significant difference among the 4 groups, with the lowest LVMI value observed in the allopurinol group with normal serum creatinine (median LVMI; 35.7), while corresponding values in the other groups were 37.2 in the control group with normal serum creatinine, 47.8 in the allopurinol group with abnormally high serum creatinine, and 44.5 in the control group with abnormally high serum creatinine (P=0.006) (Table 7). Similarly, pairwise comparisons between group 1 vs group 3, and group 2 vs group 4 did not reach statistical significance with, respectively, p=0.914 and p=0.118.
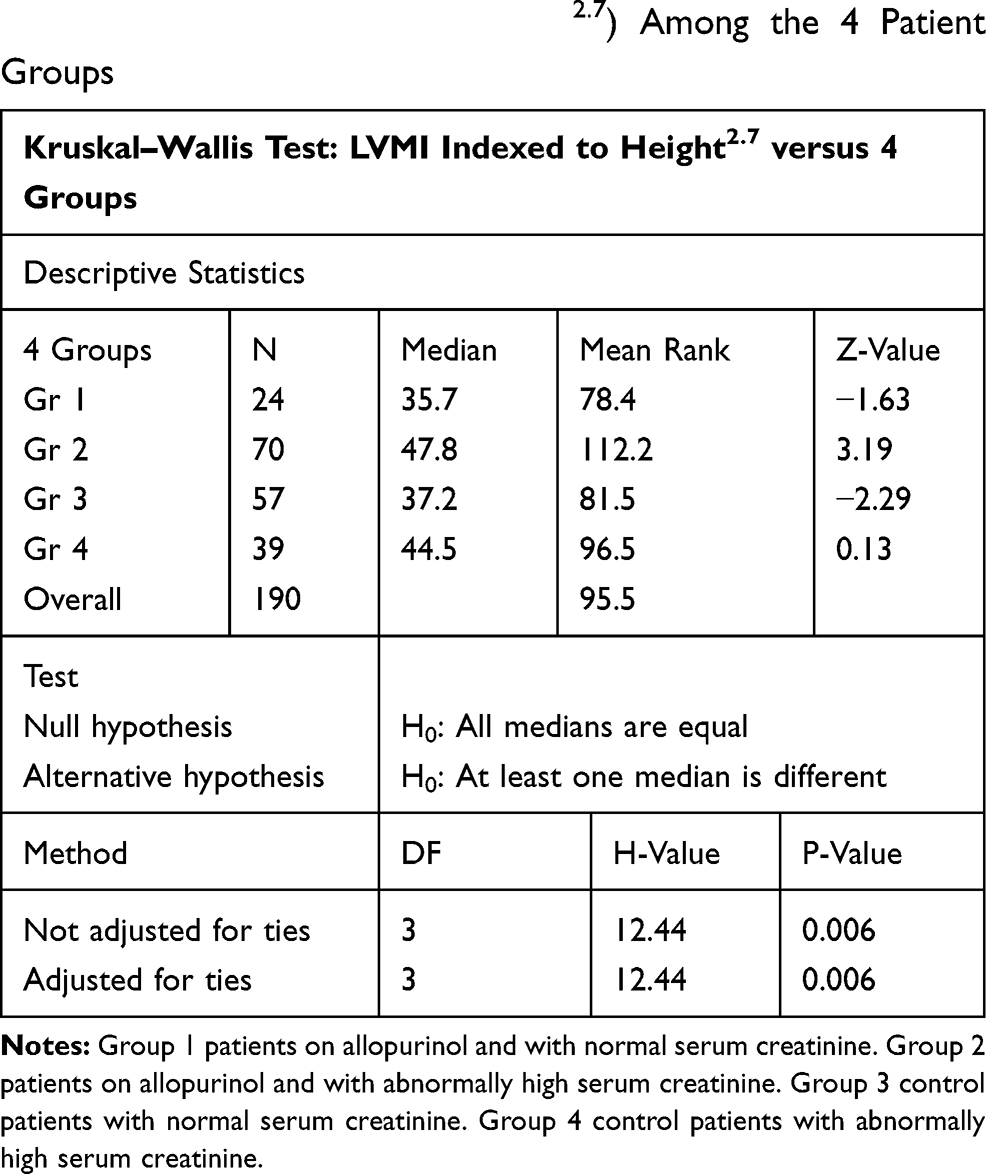 |
Table 7 Comparison of LVMI (g/h2.7) Among the 4 Patient Groups |
With regard to LV geometric patterns, similar comparisons among the 4 groups, i.e, group 1 vs group 3, and group 2 vs group 4, showed no significant differences with, respectively, p=0.576 and p=0.461 (data not shown).
Considering the difference in BMI between the two groups, LVMI was compared among the patient groups with regard to allopurinol use and BMI up to a normal value of 25 using similar analyses (group 1, n=18); allopurinol users with normal BMI (group 2, n=78); allopurinol users with abnormally high BMI (group 3, n=23); control patients with normal BMI and (group 4, n= 73); control patients with abnormally high BMI. There were no significant differences in LVMI or LV geometric patterns among the 4 groups (data not shown).
Discussion
This cross-sectional study was designed to test the association between long-term allopurinol use and LVMI in a Saudi population of patients with IHD, but the results were compromised by a higher incidence of CKD and a higher BMI in the allopurinol group. However, sensitivity analysis based on normal or abnormal serum creatinine showed a trend for allopurinol use to be associated with smaller LVMI (g/m2) in patient with normal serum creatinine. The same trend was observed when we analyzed LVMI (g/h2.7).
Ultimately, the lack of statistical significance may simply reflect different reasons and lack of statistical power. For example, the unexpected differences between the groups in renal function and BMI, and then issues relating to the dose of allopurinol, the method of LVM measurements, the baseline values of LVM in our population, and other confounding factors.
First, the matching process between the two groups was designed to be 1-to-1 matching based on age, sex, and systemic hypertension as the most important factors associated with LVM.5,28,29 The unpredicted differences in BMI and renal function – median BMI was 3.6 kg/m2 higher and eGFR was14 mL/min/1.73 m2 lower in the allopurinol group – would have had an effect on the measured LVMI, as these two co-morbid factors are associated with higher LVMI.30,31 Secondly, when we compare our results with the three prospective studies that assessed changes in LVMI in response to allopurinol therapy,19–21 these well-designed studies had a small yet statistically significant decrease in left ventricular mass index (LVMI; in g/m2), as assessed by cardiac magnetic resonance (CMR) imaging after 9 months allopurinol therapy. The first study by Kao et al was conducted on patients with chronic kidney disease,19 the second study was on patients with type 2 diabetes mellitus (DM);20 moreover, the last study was on patients with IHD.21 Such benefit was found to be independent from uric acid reduction.19,21 These studies used higher doses (in the range of 300–600 mg/day, while the median dose in our study was 100 mg/day). A further consideration is that all used cardiac magnetic resonance (CMR) methods which have better accuracy and reproducibility when compared with 2D echocardiography32 and hence smaller sample size requirements.27 Another observation of note is that the baseline LVMI in their populations was 61.6,19 60.67,20 and 70.98 g/m2,21 and these are lower than the 79 g/m2 in our control group. This raises issues relating to allopurinol dosage and potential reversibility: for example, the composition of the myocardial tissue, in particular, myocardial fibrosis which is more likely in patients with CKD.33,34 Thirdly, other confounding factors related to concurrent medications which our patient’s population were maintained on, require cautious interpretation. While allopurinol and control groups were matched for ACEI, ARBs, and beta-blockers intake, larger numbers of patients in allopurinol group were on calcium channel blockers (possess urate lowering properties) and loop diuretics (possess urate increasing properties).35
With regard to secondary endpoints, there were no significant changes in EF, blood pressure, or lipid profile. This is in agreement with the three aforementioned clinical studies although positive results have been reported elsewhere.36–38
The significant difference in HbA1C between the two groups in favor of allopurinol therapy, with an estimated difference of 0.8% between the two groups who were matched for incidence and treatment of DM, can be interpreted as a potential advantage for allopurinol therapy in our population. Cautiously, we can interpret this potential advantage to be of greater magnitude since higher numbers of patients in the allopurinol group were receiving statins and loop diuretics, both of which are known to increase insulin resistance.39–42 The observed difference, although small, is clinically significant as 1% rise in HbA1c has been associated with a 30% increase in all-cause mortality and a 40% increase in cardiovascular/IHD mortality in diabetic patients, whilst a reduction of 0.2% could reduce all cause-mortality by 10%.43 Our results are supported by a few studies in the literature reporting that allopurinol therapy improved insulin sensitivity in a population with type 2 DM and another with asymptomatic hyperuricemia.44–46 In animal models, several different mechanisms have been identified to account for this beneficial effect.47–50
Allopurinol is an “old” drug that has shown promising effects beyond reducing uric acid production, albeit dose–response issues require clarification. Its antioxidant properties on endothelial function in CHF patients have been shown to be dose-dependent (300 mg vs 600 mg/d)51 and its anti-ischemic properties in patients with IHD were demonstrated with high dose (600 mg/day).52 On the other hand, such dose (600 mg/d) did not show any benefit on clinical status, exercise capacity, or quality of life in high-risk heart failure patients at 24 weeks, a duration that might have not been long enough to observe any benefits (EXACT-HF study).53 In another two studies, doses ≥ 300 mg/day in comparison with controls were associated with a 31% risk reduction for cardiovascular events and a 25% risk reduction for mortality in a population-based cohort study,54 and a reduced risk of non-fatal myocardial infarction in another population-based case–control study OR=0.30 (95% CI; 0.13, 0.72).55 A third study demonstrated that doses ≥ 300 mg/day in comparison with low doses were associated with a 41% risk reduction in all-cause mortality in a population with chronic heart failure.56
In contrast, beneficial results with doses smaller than 300 mg/d have also been reported in the literature: for example, improvement in endothelial function was shown with a 300 mg/d dose in patients with CKD,57 while a 100 mg/day dose has been found to slow renal disease progression and reduce the risk of cardiovascular events in the same population.58,59
Therefore, future studies are needed to assess the effect of allopurinol treatment on LVM on a larger Saudi population stratified according to renal function, and assessed via cardiac magnetic resonance, preferably with gadolinium administration to assess myocardial fibrosis, in addition to LVM and geometric pattern. Correspondingly, the question of improved glycemic control would be better tested and confirmed on a larger population.
Study Limitations
Our study has a number of limitations, first, the method of measurement of LVM was 2D echocardiogram. A 3D echocardiogram would be preferred and comparable to CMR in accuracy and reproducibility.27 In our hospital, there is a current change to assess LVM with 3D echocardiogram which would facilitate future studies. Second, the power calculation and sample size were based on a minimum of 78 patients in each group; however, subgroup analysis did not necessarily have adequate power. Third, our data are missing uric acid concentration in all patients which could have allowed studying its contribution to LVMI in our population as reported in other populations.13
Conclusion
Allopurinol is an established drug (for the treatment of gout) that is being repositioned among cardiovascular prevention strategies on account of its antioxidant properties. While dose–response issues require clarification, it has been shown despite the limitations of this study to be associated with smaller LVMI in this observational study. Concomitantly, its use was also associated with better glycemic control.
These findings, along with others in the current literature, encourage more research on the extended effects of allopurinol treatment, e.g., regression of LVH, endothelial function, and glycemic control. However, definitive answers will require prospective studies (ideally) with state-of-the-art methodologies.
Acknowledgments
We thank Dr Rami Bustami, Associate Professor of Healthcare Management, Biostatistics & Epidemiology-College of Business, Alfaisal University, Riyadh, Saudi Arabia, for his advice on statistics and data analysis.
Disclosure
The authors report no conflicts of interest in this work.
References
1. Kannel WB, Gordon T, Castelli WP, Margolis JR. Electrocardiographic left ventricular hypertrophy and risk of coronary heart disease. The Framingham Study. Ann Intern Med. 1970;72(6):813–822. doi:10.7326/0003-4819-72-6-813
2. Levy D, Garrison RJ, Savage DD, Kannel WB, Castelli WP. Prognostic implications of echocardiographically determined left ventricular mass in the Framingham Heart Study. N Engl J Med. 1990;322(22):1561–1566. doi:10.1056/NEJM199005313222203
3. Krumholz HM, Larson M, Levy D. Prognosis of left ventricular geometric patterns in the Framingham Heart Study. J Am Coll Cardiol. 1995;25(4):879–884. doi:10.1016/0735-1097(94)00473-4
4. Tsao CW, Gona PN, Salton CJ, et al. Left ventricular structure and risk of cardiovascular events: a Framingham heart study cardiac magnetic resonance study. J Am Heart Assoc. 2015;4(9):e002188. doi:10.1161/JAHA.115.002188
5. Ang DS, Pringle SD, Struthers AD. The cardiovascular risk factor, left ventricular hypertrophy, is highly prevalent in stable, treated angina pectoris. Am J Hypertens. 2007;20(10):1029–1035. doi:10.1016/j.amjhyper.2007.04.021
6. Liao Y, Cooper RS, McGee DL, Mensah GA, Ghali JK. The relative effects of left ventricular hypertrophy, coronary artery disease, and ventricular dysfunction on survival among black adults. JAMA. 1995;273(20):1592–1597. doi:10.1001/jama.1995.03520440046035
7. Ramirez AJ, Christen AI, Sanchez RA. Serum uric acid elevation is associated to arterial stiffness in hypertensive patients with metabolic disturbances. Curr Hypertens Rev. 2018;14(2):154–160. doi:10.2174/1573402114666180413143312
8. Chen HH, Sun YS, Liu ML. [Association between ambulatory arterial stiffness index with left ventricular mass index in the elderly hypertensive patients]. Zhonghua Xin Xue Guan Bing Za Zhi. 2016;44(9):750–753. doi:10.3760/cma.j.issn.0253-3758.2016.09.004
9. Ofori S, Akpa M. Relationship between uric acid and left ventricular mass and geometry in Nigerian patients with untreated essential hypertension. Niger J Cardiol. 2015;12(2):129–135. doi:10.4103/0189-7969.152024
10. Matsumura K, Ohtsubo T, Oniki H, Fujii K, Iida M. Gender-related association of serum uric acid and left ventricular hypertrophy in hypertension. Circ J. 2006;70(7):885–888. doi:10.1253/circj.70.885
11. Catena C, Colussi G, Capobianco F, Brosolo G, Sechi LA. Uricaemia and left ventricular mass in hypertensive patients. Eur J Clin Invest. 2014;44(10):972–981. doi:10.1111/eci.12331
12. Liu CW, Chen KH, Tseng CK, Chang WC, Wu YW, Hwang JJ. The dose-response effects of uric acid on the prevalence of metabolic syndrome and electrocardiographic left ventricular hypertrophy in healthy individuals. Nutr Metab Cardiovasc Dis. 2019;29(1):30–38. doi:10.1016/j.numecd.2018.10.001
13. Mitsuhashi H, Yatsuya H, Matsushita K, et al. Uric acid and left ventricular hypertrophy in Japanese men. Circ J. 2009;73(4):667–672. doi:10.1253/circj.CJ-08-0626
14. Cuspidi C, Facchetti R, Bombelli M, et al. Uric acid and new onset left ventricular hypertrophy: findings from the PAMELA population. Am J Hypertens. 2017;30(3):279–285. doi:10.1093/ajh/hpw159
15. Takimoto E, Kass DA. Role of oxidative stress in cardiac hypertrophy and remodeling. Hypertension. 2007;49(2):241–248. doi:10.1161/01.HYP.0000254415.31362.a7
16. Laakso JT, Teravainen TL, Martelin E, Vaskonen T, Lapatto R. Renal xanthine oxidoreductase activity during development of hypertension in spontaneously hypertensive rats. J Hypertens. 2004;22(7):1333–1340. doi:10.1097/01.hjh.0000125441.28861.9f
17. Engberding N, Spiekermann S, Schaefer A, et al. Allopurinol attenuates left ventricular remodeling and dysfunction after experimental myocardial infarction: a new action for an old drug? Circulation. 2004;110(15):2175–2179. doi:10.1161/01.CIR.0000144303.24894.1C
18. Gao X, Xu Y, Xu B, et al. Allopurinol attenuates left ventricular dysfunction in rats with early stages of streptozotocin-induced diabetes. Diabetes Metab Res Rev. 2012;28(5):409–417. doi:10.1002/dmrr.2295
19. Kao MP, Ang DS, Gandy SJ, et al. Allopurinol benefits left ventricular mass and endothelial dysfunction in chronic kidney disease. J Am Soc Nephrol. 2011;22(7):1382–1389. doi:10.1681/ASN.2010111185
20. Szwejkowski BR, Gandy SJ, Rekhraj S, et al. Allopurinol reduces left ventricular mass in patients with type 2 diabetes and left ventricular hypertrophy. J Am Coll Cardiol. 2013;62(24):2284–2293. doi:10.1016/j.jacc.2013.07.074
21. Rekhraj S, Gandy SJ, Szwejkowski BR, et al. High-dose allopurinol reduces left ventricular mass in patients with ischemic heart disease. J Am Coll Cardiol. 2013;61(9):926–932. doi:10.1016/j.jacc.2012.09.066
22. Vandenbroucke JP, von EE, Altman DG, et al. Strengthening the Reporting of Observational Studies in Epidemiology (STROBE): explanation and elaboration. PLoS Med. 2007;4(10):e297. doi:10.1371/journal.pmed.0040297
23. Lang RM, Badano LP, Mor-Avi V, et al. Recommendations for cardiac chamber quantification by echocardiography in adults: an update from the American Society of Echocardiography and the European Association of Cardiovascular Imaging. J Am Soc Echocardiogr. 2015;28(1):1–39. doi:10.1016/j.echo.2014.10.003
24. Devereux RB, Lutas EM, Casale PN, et al. Standardization of M-mode echocardiographic left ventricular anatomic measurements. J Am Coll Cardiol. 1984;4(6):1222–1230. doi:10.1016/S0735-1097(84)80141-2
25. Rosa EC, Moyses VA, Sesso RC, et al. Left ventricular hypertrophy evaluation in obese hypertensive patients: effect of left ventricular mass index criteria. Arq Bras Cardiol. 2002;78(4):341–351. doi:10.1590/S0066-782X2002000400001
26. Cuspidi C, Meani S, Negri F, et al. Indexation of left ventricular mass to body surface area and height to allometric power of 2.7: is the difference limited to obese hypertensives? J Hum Hypertens. 2009;23(11):728–734. doi:10.1038/jhh.2009.16
27. Myerson SG, Bellenger NG, Pennell DJ. Assessment of left ventricular mass by cardiovascular magnetic resonance. Hypertension. 2002;39(3):750–755. doi:10.1161/hy0302.104674
28. Gardin JM, Siscovick D, Anton-Culver H, et al. Sex, age, and disease affect echocardiographic left ventricular mass and systolic function in the free-living elderly. The Cardiovascular Health Study. Circulation. 1995;91(6):1739–1748.
29. Gosse P. Left ventricular hypertrophy–the problem and possible solutions. J Int Med Res. 2005;33 Suppl 1:3A–11A. doi:10.1177/14732300050330S102
30. Brunner D JM, Schreiner PJ, Xie X, et al. Demographics and correlates of five-year change in echocardiographic left ventricular mass in young black and white adult men and women: the Coronary Artery Risk Development in Young Adults (CARDIA) study. J Am Coll Cardiol. 2002;40(3):529–535. doi:10.1016/S0735-1097(02)01973-3
31. Levin A, Singer J, Thompson CR, Ross H, Lewis M. Prevalent left ventricular hypertrophy in the predialysis population: identifying opportunities for intervention. Am J Kidney Dis. 1996;27(3):347–354. doi:10.1016/S0272-6386(96)90357-1
32. Armstrong AC, Gidding S, Gjesdal O, Wu C, Bluemke DA, Lima JA. LV mass assessed by echocardiography and CMR, cardiovascular outcomes, and medical practice. JACC Cardiovasc Imaging. 2012;5(8):837–848. doi:10.1016/j.jcmg.2012.06.003
33. Reichek N. Left ventricular hypertrophy regression and allopurinol: more questions than answers. J Am Coll Cardiol. 2013;62(24):2294–2296. doi:10.1016/j.jacc.2013.08.695
34. Mark PB, Johnston N, Groenning BA, et al. Redefinition of uremic cardiomyopathy by contrast-enhanced cardiac magnetic resonance imaging. Kidney Int. 2006;69(10):1839–1845. doi:10.1038/sj.ki.5000249
35. Choi HK, Soriano LC, Zhang Y, Rodriguez LA. Antihypertensive drugs and risk of incident gout among patients with hypertension: population based case-control study. BMJ. 2012;12(344):d8190. doi:10.1136/bmj.d8190
36. Agarwal V, Hans N, Messerli FH. Effect of allopurinol on blood pressure: a systematic review and meta-analysis. J Clin Hypertens (Greenwich). 2013;15(6):435–442. doi:10.1111/j.1751-7176.2012.00701.x
37. Shelmadine B, Bowden RG, Wilson RL, Beavers D, Hartman J. The effects of lowering uric acid levels using allopurinol on markers of metabolic syndrome in end-stage renal disease patients: a pilot study. Anadolu Kardiyol Derg. 2009;9(5):385–389.
38. Bowden RG, Shelmadine BD, Moreillon JJ, Deike E, Griggs JO, Wilson RL. Effects of uric acid on lipid levels in CKD patients in a randomized controlled trial. Cardiol Res. 2013;Apr(2):56–63.
39. Sato H, Carvalho G, Sato T, et al. Statin intake is associated with decreased insulin sensitivity during cardiac surgery. Diabetes Care. 2012;35(10):2095–2099. doi:10.2337/dc11-2251
40. Kain V, Kapadia B, Misra P, Saxena U. Simvastatin may induce insulin resistance through a novel fatty acid mediated cholesterol independent mechanism. Sci Rep. 2015;8(5):13823. doi:10.1038/srep13823
41. Schliess F, von DS, Haussinger D. Insulin resistance induced by loop diuretics and hyperosmolarity in perfused rat liver. Biol Chem. 2001;382(7):1063–1069. doi:10.1515/BC.2001.133
42. Dimitriadis G, Leighton B, Parry-Billings M, Tountas C, Raptis S, Newsholme EA. Furosemide decreases the sensitivity of glucose transport to insulin in skeletal muscle in vitro. Eur J Endocrinol. 1998;139(1):118–122. doi:10.1530/eje.0.1390118
43. Khaw KT, Wareham N, Luben R, et al. Glycated haemoglobin, diabetes, and mortality in men in Norfolk cohort of european prospective investigation of cancer and nutrition (EPIC-Norfolk). BMJ. 2001;322(7277):15–18. doi:10.1136/bmj.322.7277.15
44. Liu P, Wang H, Zhang F, Chen Y, Wang D, Wang Y. The effects of allopurinol on the carotid intima-media thickness in patients with type 2 diabetes and asymptomatic hyperuricemia: a three-year randomized parallel-controlled study. Intern Med. 2015;54(17):2129–2137. doi:10.2169/internalmedicine.54.4310
45. Takir M, Kostek O, Ozkok A, et al. Lowering uric acid with allopurinol improves insulin resistance and systemic inflammation in asymptomatic hyperuricemia. J Investig Med. 2015;63(8):924–929. doi:10.1097/JIM.0000000000000242
46. Fujimura Y, Yamauchi Y, Murase T, et al. Relationship between plasma xanthine oxidoreductase activity and left ventricular ejection fraction and hypertrophy among cardiac patients. PLoS One. 2017;12(8):e0182699. doi:10.1371/journal.pone.0182699
47. El-Bassossy HM, Elberry AA, Azhar A, Ghareib SA, Alahdal AM. Ameliorative effect of allopurinol on vascular complications of insulin resistance. J Diabetes Res. 2015;2015:178540. doi:10.1155/2015/178540
48. Lanaspa MA, Sanchez-Lozada LG, Cicerchi C, et al. Uric acid stimulates fructokinase and accelerates fructose metabolism in the development of fatty liver. PLoS One. 2012;7(10):e47948. doi:10.1371/journal.pone.0047948
49. Xu C, Lin Y, Lu C, et al. Uric acid regulates hepatic steatosis and insulin resistance through the NLRP3 inflammasome-dependent mechanism. J Hepatol. 2016;64(4):925–932. doi:10.1016/j.jhep.2015.11.022
50. Choi YJ, Yoon Y, Lee KY, et al. Uric acid induces endothelial dysfunction by vascular insulin resistance associated with the impairment of nitric oxide synthesis. FASEB J. 2014;28(7):3197–3204. doi:10.1096/fj.13-247148
51. George J, Carr E, Davies J, Belch JJ, Struthers A. High-dose allopurinol improves endothelial function by profoundly reducing vascular oxidative stress and not by lowering uric acid. Circulation. 2006;114(23):2508–2516. doi:10.1161/CIRCULATIONAHA.106.651117
52. Noman A, Ang DS, Ogston S, Lang CC, Struthers AD. Effect of high-dose allopurinol on exercise in patients with chronic stable angina: a randomised, placebo controlled crossover trial. Lancet. 2010;375(9732):2161–2167. doi:10.1016/S0140-6736(10)60391-1
53. Givertz MM, Anstrom KJ, Redfield MM, et al. Effects of xanthine oxidase inhibition in hyperuricemic heart failure patients: the xanthine oxidase inhibition for hyperuricemic heart failure patients (EXACT-HF) Study. Circulation. 2015;131(20):1763–1771. doi:10.1161/CIRCULATIONAHA.114.014536
54. Wei L, Mackenzie IS, Chen Y, Struthers AD, MacDonald TM. Impact of allopurinol use on urate concentration and cardiovascular outcome. Br J Clin Pharmacol. 2011;71(4):600–607. doi:10.1111/bcp.2011.71.issue-4
55. de Abajo FJ, Gil MJ, Rodriguez A, et al. Allopurinol use and risk of non-fatal acute myocardial infarction. Heart. 2015;101(9):679–685. doi:10.1136/heartjnl-2014-306670
56. Struthers AD, Donnan PT, Lindsay P, McNaughton D, Broomhall J, MacDonald TM. Effect of allopurinol on mortality and hospitalisations in chronic heart failure: a retrospective cohort study. Heart. 2002;87(3):229–234. doi:10.1136/heart.87.3.229
57. Alem MM. Allopurinol and endothelial function: a systematic review with meta-analysis of randomized controlled trials. Cardiovasc Ther. 2018;36(4):e12432. doi:10.1111/cdr.2018.36.issue-4
58. Goicoechea M, de Vinuesa SG, Verdalles U, et al. Effect of allopurinol in chronic kidney disease progression and cardiovascular risk. Clin J Am Soc Nephrol. 2010;5(8):1388–1393. doi:10.2215/CJN.01580210
59. Goicoechea M, Garcia V, Verdalles U, et al. Allopurinol and progression of CKD and cardiovascular events: long-term follow-up of a randomized clinical trial. Am J Kidney Dis. 2015;65(4):543–549. doi:10.1053/j.ajkd.2014.11.016
 © 2019 The Author(s). This work is published and licensed by Dove Medical Press Limited. The
full terms of this license are available at https://www.dovepress.com/terms
and incorporate the Creative Commons Attribution
- Non Commercial (unported, 3.0) License.
By accessing the work you hereby accept the Terms. Non-commercial uses of the work are permitted
without any further permission from Dove Medical Press Limited, provided the work is properly
attributed. For permission for commercial use of this work, please see paragraphs 4.2 and 5 of our Terms.
© 2019 The Author(s). This work is published and licensed by Dove Medical Press Limited. The
full terms of this license are available at https://www.dovepress.com/terms
and incorporate the Creative Commons Attribution
- Non Commercial (unported, 3.0) License.
By accessing the work you hereby accept the Terms. Non-commercial uses of the work are permitted
without any further permission from Dove Medical Press Limited, provided the work is properly
attributed. For permission for commercial use of this work, please see paragraphs 4.2 and 5 of our Terms.