")
Back to Journals » Nutrition and Dietary Supplements » Volume 12
Effect of Iodine Deficiency on Academic Performance of School Children in Dawro Zone, Southwest Ethiopia: A Prospective Cohort Study
Authors Asfaw A, Belachew T
Received 21 April 2020
Accepted for publication 31 July 2020
Published 24 August 2020 Volume 2020:12 Pages 157—166
DOI https://doi.org/10.2147/NDS.S259104
Checked for plagiarism Yes
Review by Single anonymous peer review
Peer reviewer comments 2
Editor who approved publication: Dr Chandrika J Piyathilake
Agize Asfaw,1 Tefera Belachew2
1Department of Public Health, College of Medicine and Health Sciences, Wolkite University, Gubre, Ethiopia; 2Department of Nutrition and Dietetics, College of Public Health and Medical Sciences, Jimma University, Jimma, Ethiopia
Correspondence: Agize Asfaw
Department of Public Health, College of Medicine and Health Sciences, Wolkite University, PO Box 07, Gubre, Ethiopia
Tel +251 911542030
Email [email protected]
Background: The most visible effect of iodine deficiency (ID) is goiter, but the worst and much greater public health problem is its impact on the developing brain. Despite relatively increased attention to the consequences of ID on physical health, there are only a few studies on the influence of ID on schooling in Ethiopia. The main objective of this study was to determine the effect of chronic ID on academic performance of school children in southwest Ethiopia.
Methods: This study was conducted on 652 schoolchildren selected from six primary schools in southwest Ethiopia. Using prospective cohort study design, 362 iodine-deficient and 290 iodine-sufficient children were followed for the difference in academic grade scores for a period of 18 months.
Results: Average grade score of children for both groups was 72.5%. Among iodine-deficient children, about two-thirds (65.8%) performed below the mean grade score (χ2 (df), 46.86 (1), p< 0.001). Both school absenteeism and dropout from school were significantly higher for iodine-deficient children. For example, for a single day’s absence from a class, the average grade score declined by 1.1 points (β=− 1.10, 95% CI, − 1.52, − 0.70).
Conclusion: Despite the efforts made by the Ethiopian government on universal salt iodization and other iodine deficiency disorder prevention programs for the last decade, many south Ethiopian children were unable to utilize their full academic potential due to chronic iodine deficiency.
Trial Registration: PACTR201809544276357 (www.pactr.org), Registered September 14, 2018.
Keywords: academic performance, grade scores, iodine deficiency, school absenteeism, southwest Ethiopia
Introduction
Iodine is an essential micronutrient for regulation of physical growth and neural development. Inadequate intake of iodine can lead to insufficient synthesis of thyroid hormones.1 When these hormones are low in the blood of pregnant woman, the developing fetal brain can be impaired. The impairment may persist into later life and can lead to reduced educational outcomes.2–4
The most visible effect of ID is goiter, but the worst and much greater public health problem is its impact on the developing brain. The resulting impairment in cognitive development has an immediate effect on child learning capacity by reducing the ability of a child to master school educational materials, reduce their ability to concentrate at school, increase the chance of repeating grades, and dropping out early from school.5–7
In iodine-deficient areas children may not attain their full growth, development, and education potential. If the deficiency occurs in pregnancy and/or infancy, it has a relatively immediate effect on child learning capacity.8–10 In 2013, a systematic review and meta-analysis in Canada reviewed clinical and community trial studies and revealed that iodine-deficient populations had up to 13.5 intelligence quotient (IQ) points lower than iodine-sufficient ones.11
Another study conducted in Tanzania to assess ID and schooling attainment revealed iodine-deficient children had lower rates of grade attainment for age, and fewer students progressing to institutions of higher education.12 Conversely, a recently published iodized salt intervention study in Ethiopia has shown that the exposure to iodized salt from pre-pregnancy or early pregnancy to infancy resulted in higher cognitive development.13
Even though the Iodine Global Network (IGN) by its global scorecard of iodine nutrition 201714 categorized Ethiopia as ”adequate” in iodine intake at national level, several recently published sub-national and area-specific studies revealed that the country is still iodine deficient.15–19 In addition, despite relatively increased attention to the consequences of ID on physical health, there are only a few studies on the influence of ID on schooling in Ethiopia. Therefore, the main objective of this study was to determine the effect of chronic ID on academic performance of schoolchildren in Dawro zone, southwest Ethiopia by answering the following research questions:
- What are the effects of iodine deficiency on the academic performance of school children?
- Is there any difference in nutritional status between iodine-deficient and -sufficient children at baseline?
- Is there any difference in school absenteeism and/or drop-out between iodine-deficient and -sufficient children at endline?
Materials and Methods
Description of the Study Area
The study was conducted in Dawro zone primary schools, southwest Ethiopia. The zone is found in South Nation Nationalities and People’s Region (SNNPR) with a total land area of about 4,437 km2. It has five districts and one town administration with a total population of 702,517 in 2016. The town administration, namely “Tarcha” is the capital of the zone and located at a distance of 322 km from Hawassa, the regional capital and 500 km from Addis Ababa, the national capital in the southwest direction. Dawro is bordered on the south by Gamo Gofa, on the west by the Konta special district, on the north with the Oromia region, on the northeast by Hadiya and Kembata Tembaro zones, and on the east by Wolayita zone (Figure 1).
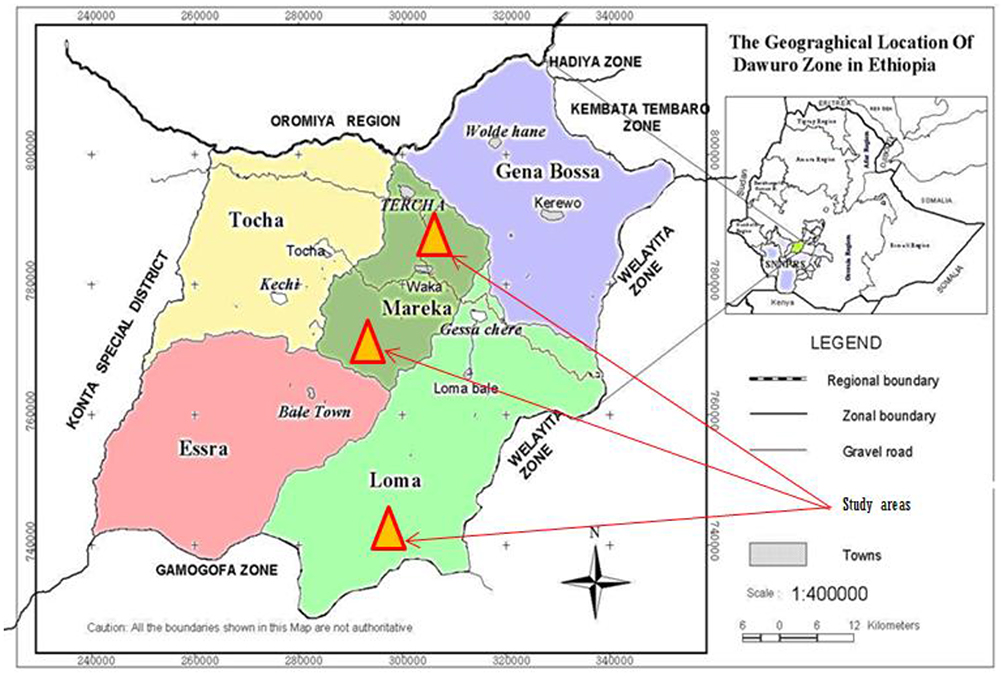 |
Figure 1 Map of Dawro Zone and its location in Ethiopia, 2016. Note: Adapted with permission from Dawro Zone Health Department. |
In the districts selected for this study (Loma, Mareka, and Tarcha), there were a total of 142 primary schools and 61,327 enrolled students in 2016 academic year, of them 32,112 (52.4%) were male and the remaining 29, 215 (47.6%) were female.
Study Design
A prospective cohort study design was carried out from February 2016 to June 2017. The study followed two cohorts of children (iodine deficient vs iodine sufficient) over a period of 18 months to track their academic performance based on their average grade scores.
Sample Size Determination
This study was a part of the research project dealing with IDD, its magnitude and consequence on schoolchildren using different study designs (cross-sectional, cluster randomized controlled trial and prospective cohort). The sample size determination and sampling technique was applied for the whole project. It was calculated using a method (GPOWER 3:0 software) that takes into account the intracluster correlation coefficient (ICC), the average cluster size, the expected effect size, and the power of the study with expected 10% dropout rate. The final sample size was 652.
Sampling Technique
Dawro zone has five districts and one town administration. Two out of the five districts were selected by simple random sampling (SRS) and the town administration was included. The list of primary schools (sampling frame) was obtained from district education offices and the town administration bureau. Again, SRS was applied to select two primary schools from each district and the town (total six primary schools). Then, the sample was allocated proportional to the number of students of each school. Eligible children from these schools were randomly selected and given a unique identifying number.
Participant Recruitment
Before this study, a baseline survey was conducted on school-age children (6–12 years) from March 1 to 24, 2017 to determine the iodine nutrition status using goiter prevalence and urinary iodine concentration (UIC) as indicators.20 As recommended by the World Health Organization (WHO) and other previous studies, UIC <100 μg/l is an indicator of current ID,21,22 whereas goiter prevalence indicates the existence of long-term ID in the population.23 However, we cannot use UIC to classify the iodine nutrition status of the study children for two reasons: first, a single spot UIC measurement cannot be used to categorize iodine nutrition status in an individual level.24 Secondly, the fact that urine samples were collected from sub-samples of 20% in the mentioned baseline study; hence it is difficult to classify those children whose urine was not analyzed for UIC (80%).
Therefore, this study used the goiter examination result (data) from the baseline survey and classified children based on their exposure status. According to the baseline study, all children with visible or palpable thyroid swelling (grade 2 and grade 1 goiter respectively) were classified as “children with ID” and the rest (normal) were classified as “children without ID”. Hence; the current study used those children with ID as the exposed group (n=362) and those without ID as the non-exposed group (n=290).
Data Collection and Measurement
Data on demographic and socio-economic variables were collected from children’s biological mothers or primary caretakers through house-to-house visits using a pre-tested structured interviewer-administered questionnaire. The data collectors were health extension worker of the respective areas. Before the actual data collection, training was given for 12 health extension workers on how to collect the data, ethical issues, revisiting closed houses and their work relationship with the supervisor.
To appreciate whether there is any difference in nutritional status between iodine-deficient and -sufficient children at baseline, anthropometric data was collected by two trained diploma nurses under close supervision of the principal investigator (PI). Weight and height of both groups were measured using standard procedures and calibrated measuring scales. Weight was measured to the nearest 0.1 kg with an electronic scale. Since all children were older (>24 months) height was measured in a standing position using a vertical measuring wooden board and read to the nearest 0.1 cm. Age of the student was obtained by asking each student/the guardian and cross-checked with the school registrar in case of doubt. Based on WHO 2006 multi-center growth reference study25 weight-for-age (WAZ), height-for-age (HAZ), and BMI-for-age (BAZ) were calculated.
Academic performance was followed by registering every test score including the final examination, whereas school absenteeism and drop-out were followed by taking daily attendance. The follow-up continued for both groups independently from February 2016 to June 2017. Data collected on all three variables (grade score, school absenteeism, and dropout) were submitted to PI every semester for three consecutive semesters. Finally, the mean of the three semesters was determined for average grade score.
Operational Definitions
Semester: in Ethiopian schooling context, a semester refers to a school session of 4–5 months, which divide the academic year into two terms excluding the two non-academic months (July and August). Usually, semester 1 is from September to January and semester 2 is from February to June.
Grade scores: the average score of students (out of 100%) on the standard school tests given in a semester.
Average grade score: this is a number representing the average value of the accumulated final grades (percent) earned in subjects (courses) over three semesters.
School absenteeism: this is defined as students’ non-attendance at school during school hours for at least a day in the last academic semester.
Dropout: any student who left the school without either completing the semester or formally transferring to another school is considered as dropout.
Data Quality Assurance
To ensure data quality, a structured questionnaire was developed first in English then translated to the local language and back to English by language experts to maintain its consistency. Five percent of the sample was pre-tested in a district that was not selected for this study. Two Diploma nurses were trained for anthropometric data collection for 2 consecutive days. The training was skill-based and supported with demonstrations on how to measure weight and height. The aim of the demonstration was to minimize inter-individual variability in measurement. Every day data collection was monitored and supervised by the supervisor and PI. The weight scale was adjusted to zero before each measurement. Heavy clothes and shoes were removed, and children were weighed wearing light shirts. A standard format was prepared and used to collect data on academic performance, school absenteeism, and dropout.
Statistical Analysis
Anthropometric data were analyzed using WHO anthroplus software and the WHO 2007 reference data was used as a standard to determine Z scores.25,26 Z scores of < −2 standard deviation (SD) for height-for-age and weight-for-age were used to determine the prevalence of stunting and underweight, respectively. To assess acute malnutrition (thinness) among children and adolescents 5–19 years, WHO recommends Body Mass Index (BMI). Accordingly, the Z-score of <-2SD for BMI-for-age was used to determine the prevalence of thinness.
The other data were entered into Epi info version 3.5.3, transferred to IBM SPSS version 21 (SPSS Inc, Armonk, NY, USA) for analysis. Descriptive statistics were used to summarize the data. The household wealth index was constructed using principal component analysis (PCA). We included 20 variables that were related to household assets, land ownership, livestock ownership and the constructed index was used to categorize the households into three socio-economic classes, namely; rich, medium, and poor.
The dependent variable was academic achievement (average grade score) of the students. Independent variables factored in the model included age, sex, nutritional status, IDD status, school absenteeism and socio-economic status of parents. A linear regression model was fitted to assess the association of each independent variable with the continuous outcome variable (average grade score) after checking for all assumptions (normality, linearity and homoscedasticity). Then, all variables with a p-value < 0.2 were entered into the multivariable linear regression model at the same time to control for confounding. Variables with a p-value of 0.05 or less were considered as statistically significant.
Results
Socio-Demographic Characteristics of the Children and Their Parents
The mean (± standard deviation) age of the children was 10.78 (1.12). The number of females was slightly higher (54.8%) than males. More than half (59.0%) of the parents did not attend formal education and about 39.6% were in the poor wealth category. The baseline socio-demographic characteristics and nutritional status of participants were comparable for both exposed and non-exposed groups except for the age category and family size. Relatively higher numbers of children with a more advanced age (11–12 years) and a smaller family size (≤5) were found in exposed groups (Table 1).
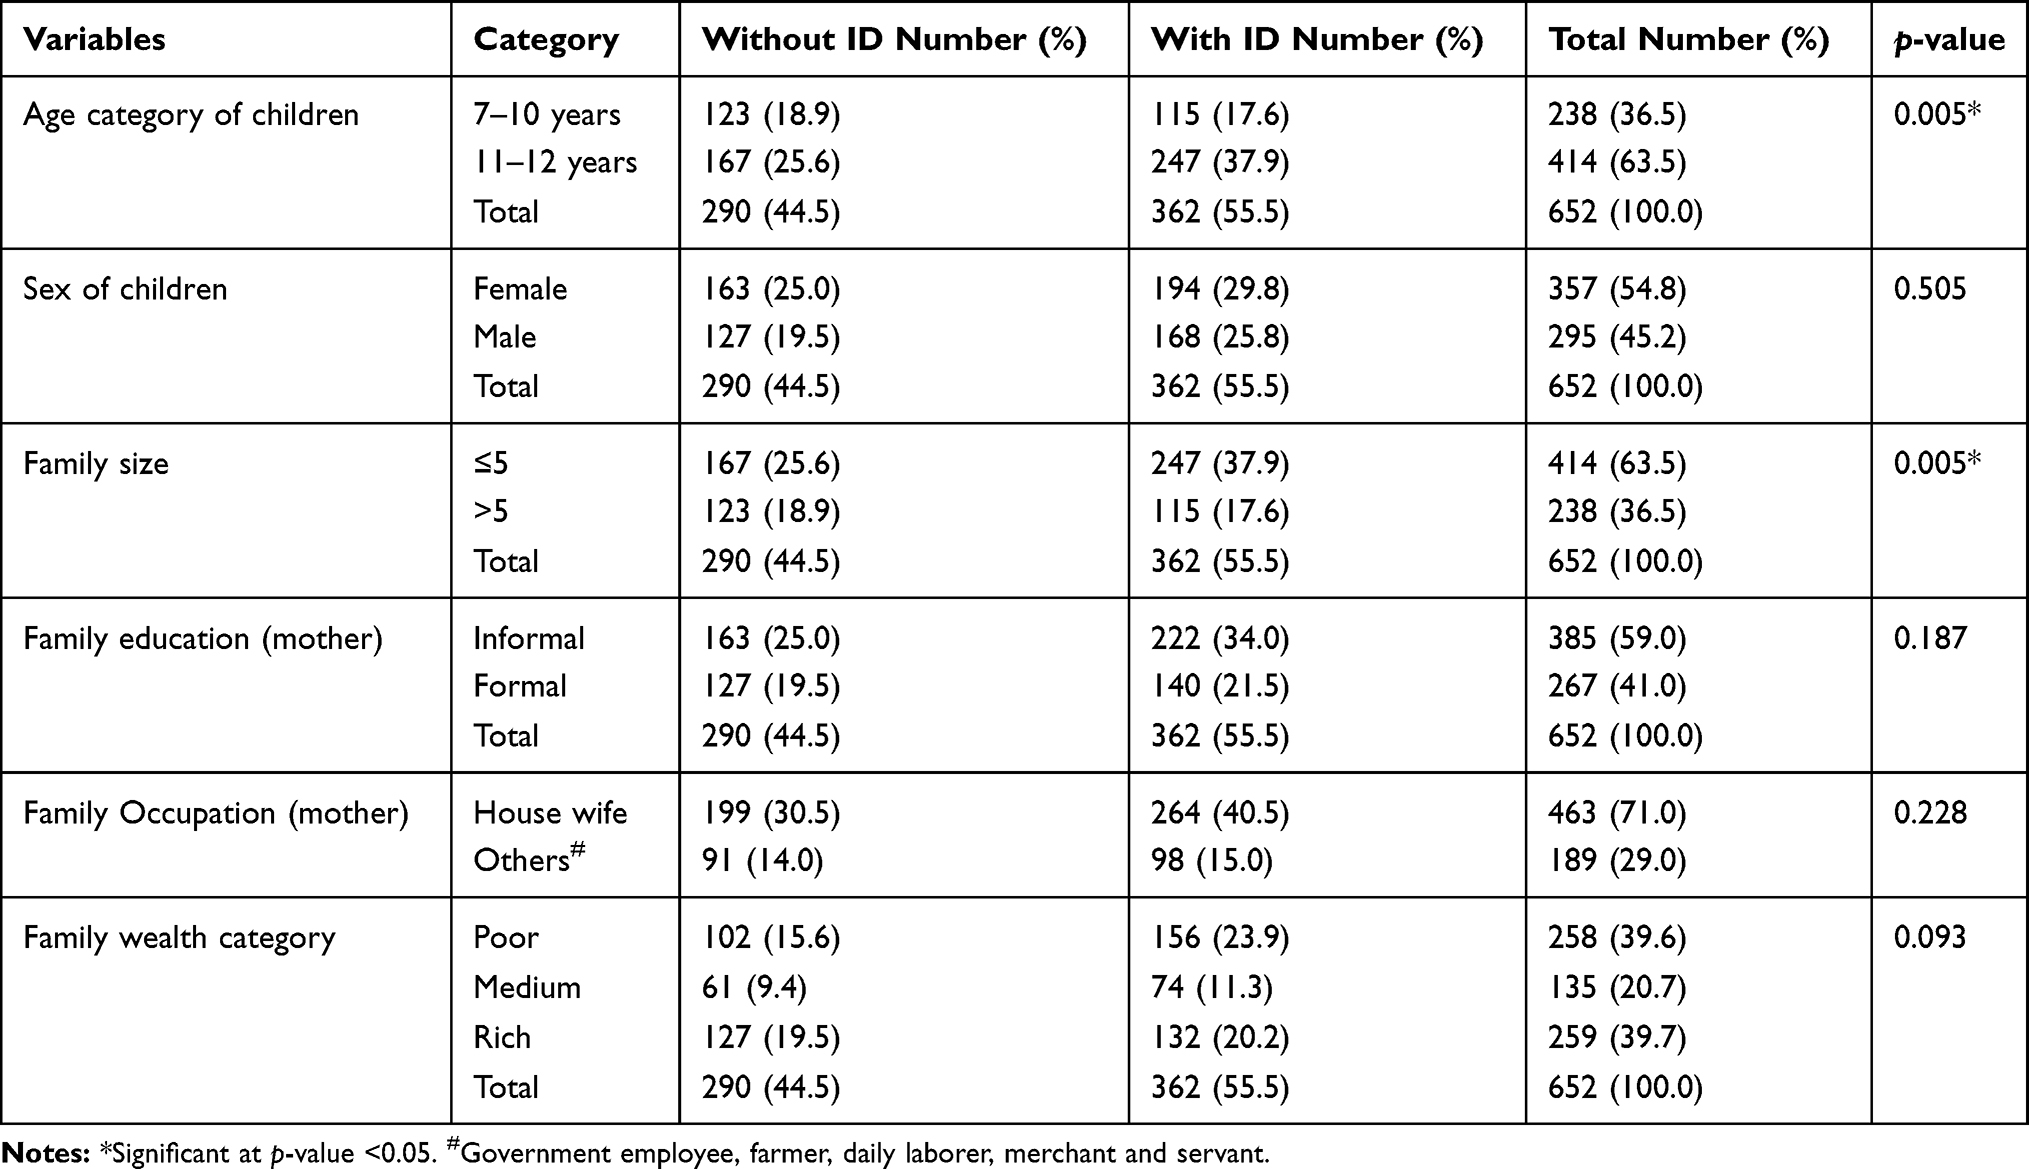 |
Table 1 Socio-Economic Profile of Study Participants and Their Family with Respect to ID Exposure Status of Schoolchildren at Baseline in Southwest Ethiopia, 2017 |
The Response Rate
At baseline, 652 children (362 with ID and 290 without ID) were identified and classified based on their exposure status. A total of 319 (88.1%) among the exposed and 269 (92.8%) among the non-exposed (total 588) completed the follow-up period for academic achievement with an overall response rate of 90.2% (Figure 2).
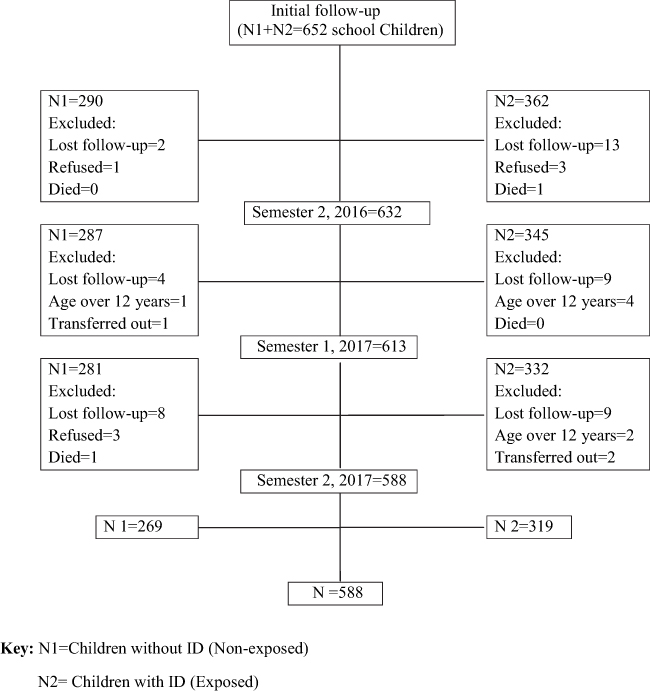 |
Figure 2 Study profiles of school children in southwest Ethiopia, 2016–2017. |
Nutritional Status of Children at Baseline
One of the research questions of this study was whether there was any difference in nutritional status between iodine-deficient and -sufficient children at the beginning (baseline). To answer this question, both iodine-deficient and -sufficient children were assessed for the baseline nutritional status and followed for academic performance for 1½ years. The prevalence of undernutrition was 32.8% for stunting, 11.3% for underweight and 6.2% for thinness among those who completed the follow-up period. The indices were comparable for both groups at baseline (Table 2).
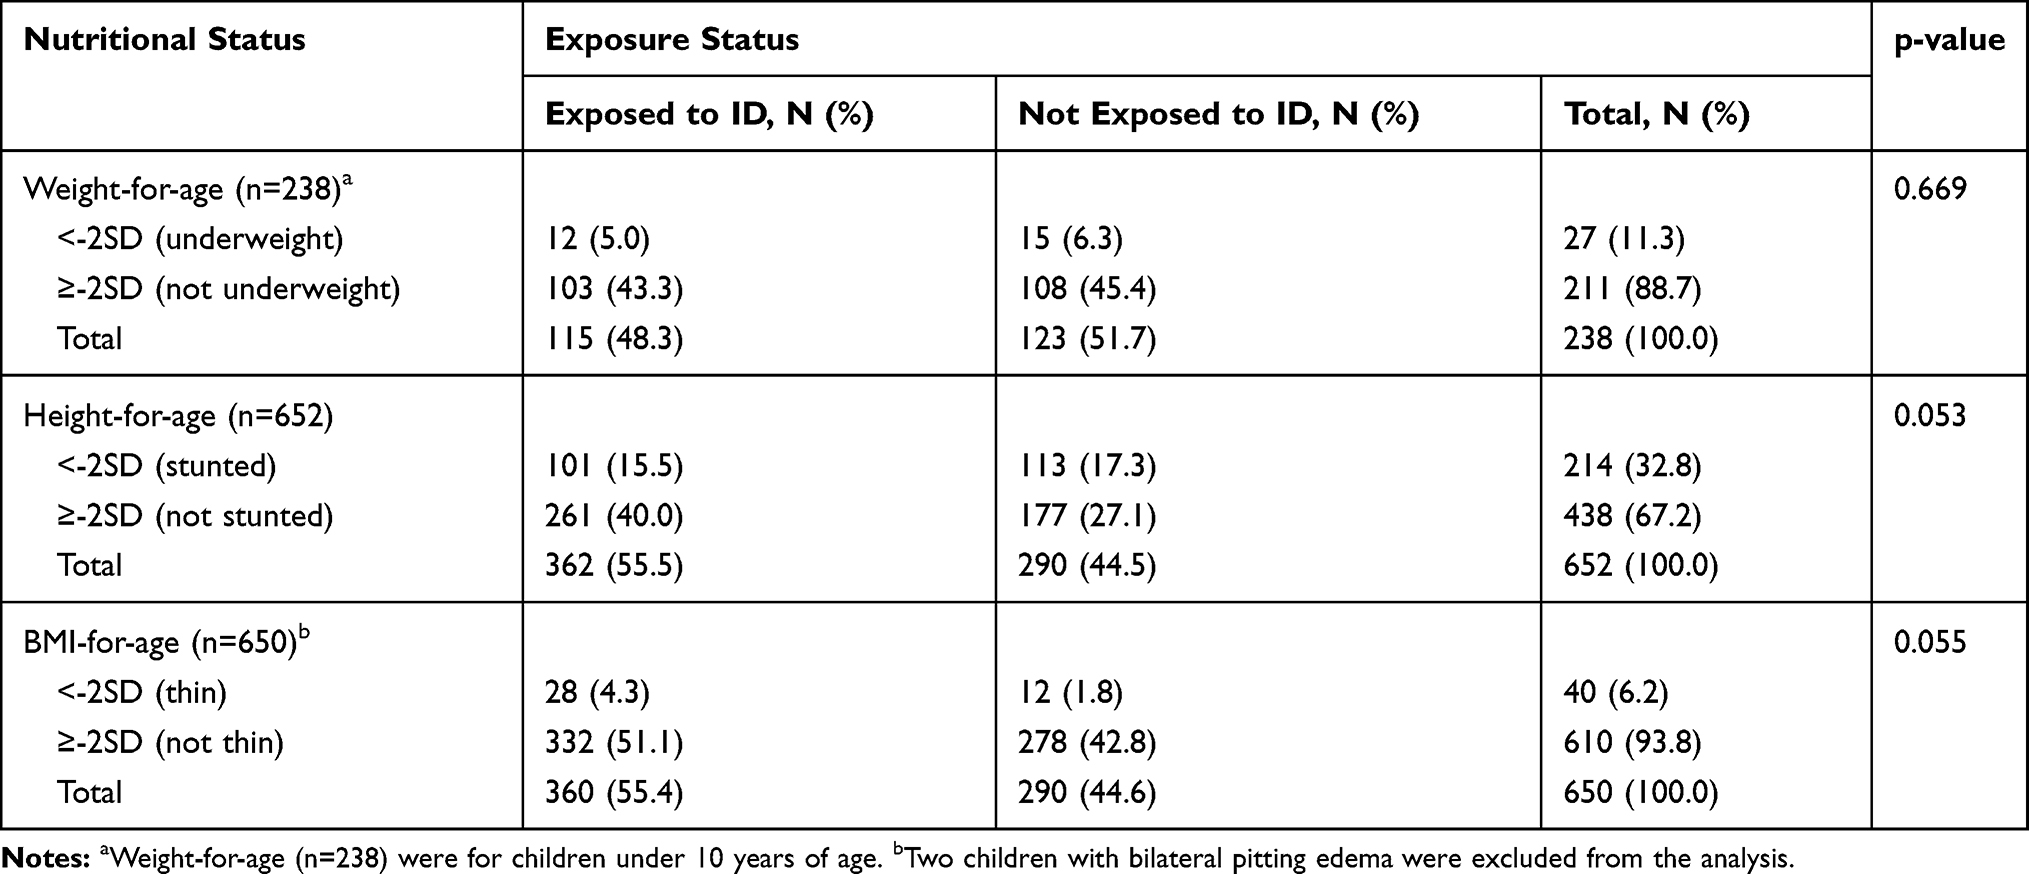 |
Table 2 Baseline Nutritional Status and ID Exposure Status of School Children in Southwest Ethiopia, 2016 (n=652) |
Academic Achievement and School Absenteeism of Children
Average grade score of children for both groups was 72.5%. Among iodine-deficient children, more than two-thirds (65.8%) performed below the mean grade score as compared to their iodine- sufficient counterparts 101 (37.5%) and such difference in scores was statistically significant (p<0.001) (Table 3).
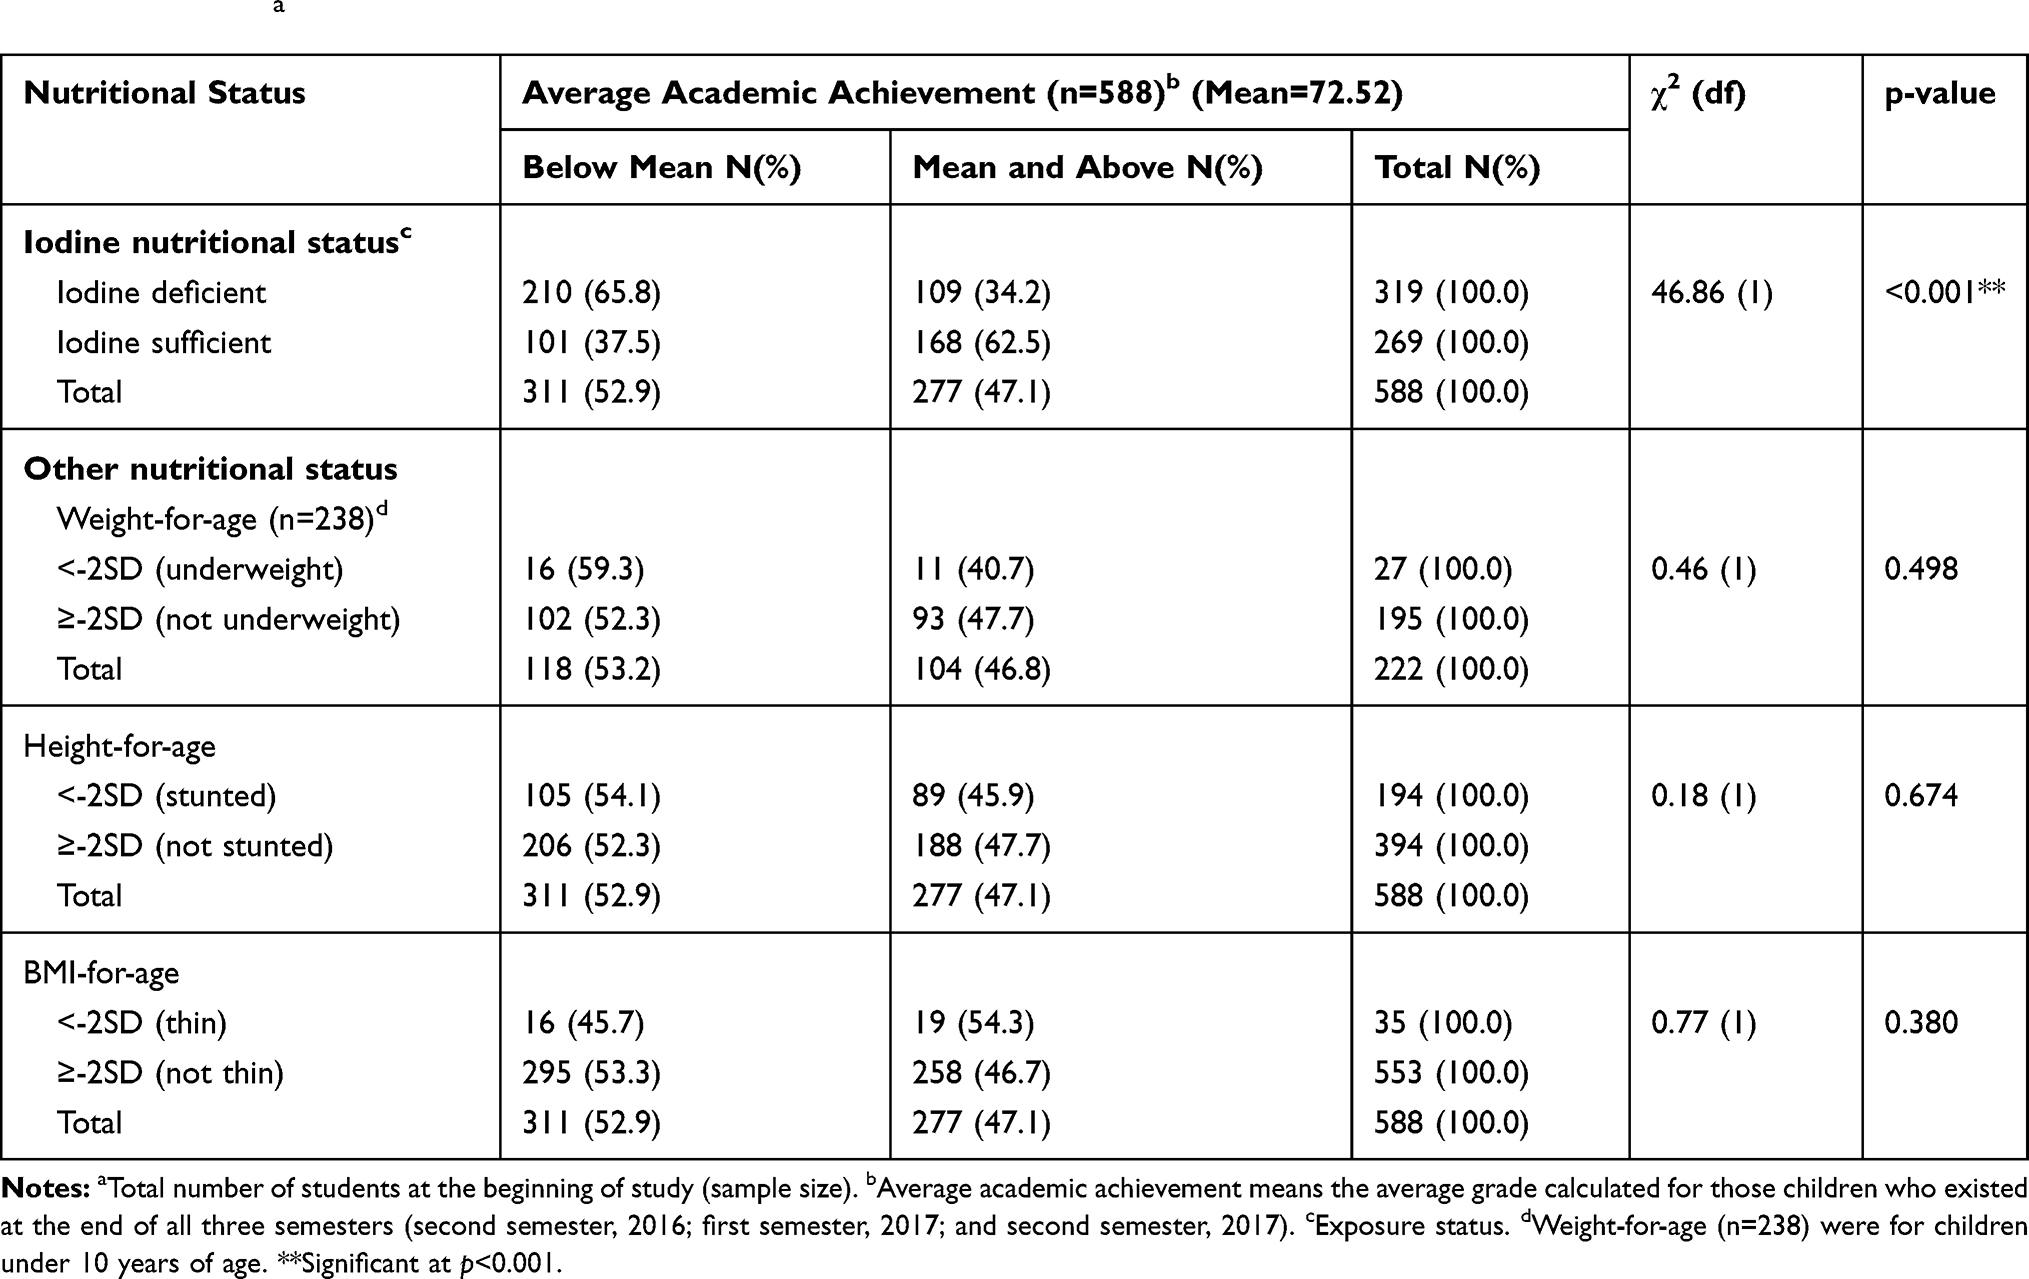 |
Table 3 Average Academic Achievement of School Children with Respect to Their Baseline Nutritional Status in Southwest Ethiopia, 2016–17, (n=652)a |
More than one-third (36.5%) of the iodine-deficient group had long bouts of absenteeism as compared to their iodine-sufficient counterparts, whose score in absenteeism was only 5.5%. The study also noted significant differences in dropout (11.9% among those with iodine deficiency vs 7.2% among those with iodine sufficiency) (Figure 3).
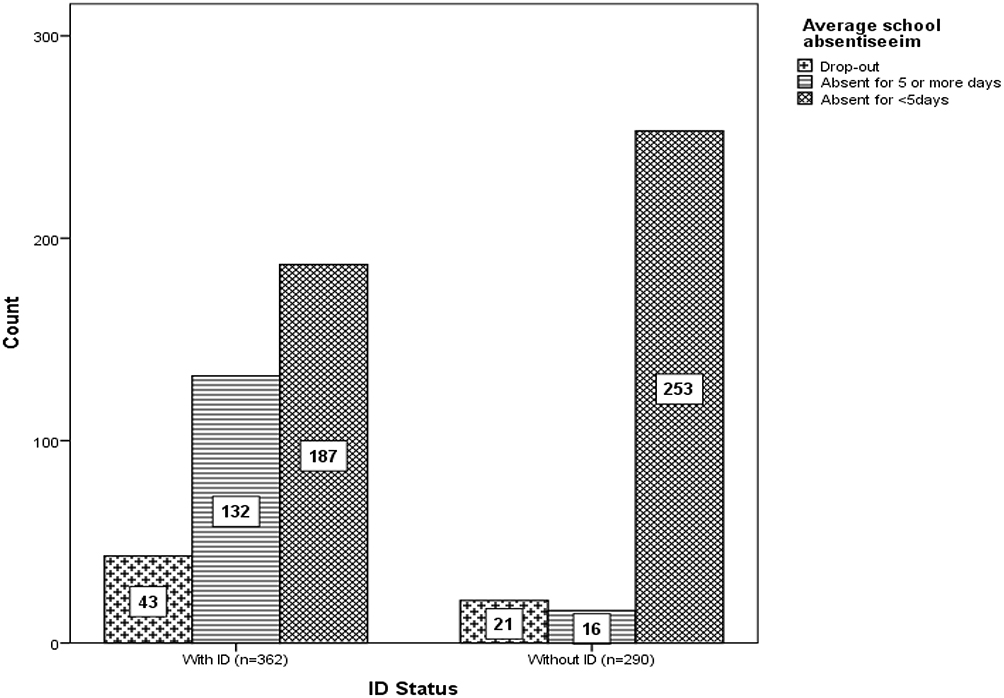 |
Figure 3 Average school absenteeism and ID exposure status of children in southwest Ethiopia, 2017. |
Factors Associated with Academic Achievement
Overall ID exposure status, average school absenteeism, stunting, and family wealth status were found to be important predictors of academic achievement after controlling for child age, sex, family size, and family educational status. Iodine deficiency and low grade (below average) achievement were positively associated. Iodine-deficient children were 4.49 times at higher risk of achieving low grade in their academic performance when compared with the iodine-sufficient children (β=4.49; 95% CI 2.74, 6.24). Similarly, stunted children were 2.34 times more at risk of low grade achievement when compared with their non-stunted counterparts (β=2.34; 95% CI 0.66, 3.99). Children from poor families were 2.57 times at higher risk of achieving low grades when compared with children from rich families (β=2.57; 95% CI 0.99, 4.15). On average, for a single day's absence from a class, the average grade score dropped by 1.10 points (β=−1.10; 95% CI −1.52, −0.70) (Table 4).
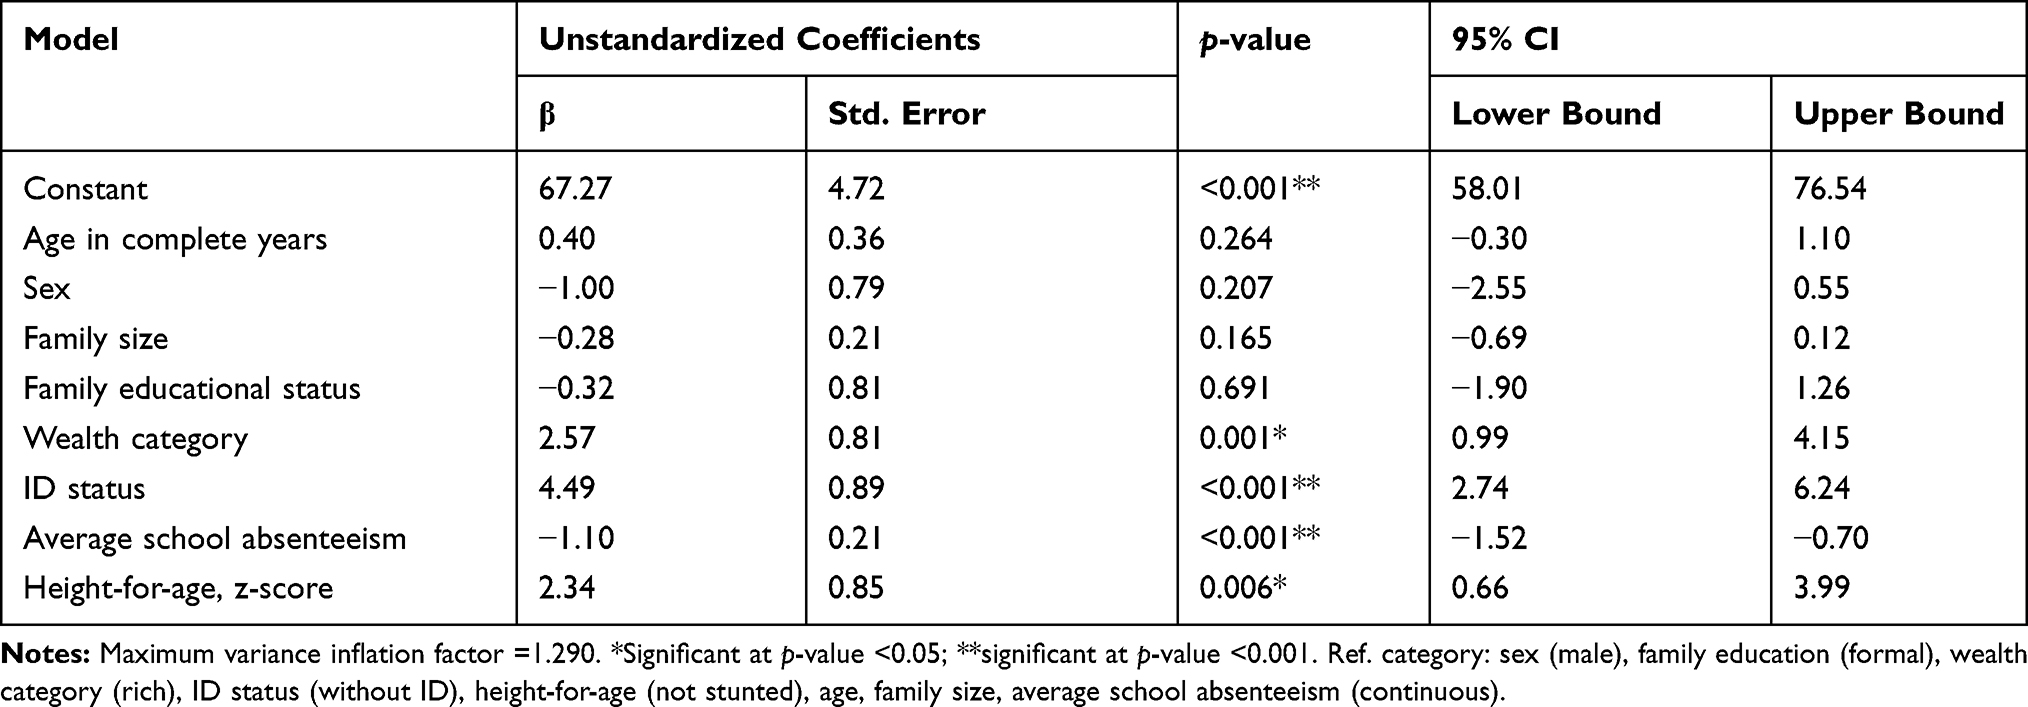 |
Table 4 Multivariable Linear Regression Model Predicting Average Grade Score of Students in Southwest Ethiopia, 2016–17 |
Discussion
In Ethiopia, despite relatively increased attention to the consequences of ID on physical health, little attention has been given for its effect on mental potential of children and their academic performance at school. The present study was aimed to cover this gap. The finding from this study revealed that ID was a significant predictor of lower academic achievement even after controlling for the potential confounders including baseline nutritional status, age and sex of the children, family size and educational status. Studies conducted in Australia,2 Pakistan,4 and Nigeria7 were in agreement with the current study finding.
In our study, children who were exposed to ID had shown more than a fourfold risk of achieving low grades in school when compared with the non-exposed children. Similar findings were reported by a systematic review and meta-analysis conducted in Canada in 2013. The review examined the effect of ID on mental development of children 5 years old and under and found that, regardless of study design, ID had a substantial impact on mental development.11 Conversely, a recently published iodized salt intervention study in Ethiopia revealed that early exposure to iodized salt in pre-pregnancy to infancy resulted in higher cognitive development.13
Both family wealth status and school absenteeism were significant predictors of academic achievement in this study. Children from poor families were approximately at three times higher risk of achieving low grades when compared with children from rich families. Regarding school absenteeism, for a single day's absence from a class, the average grade score declined by 1.10 points. Similar findings were reported by a study conducted in iodine-deficient schoolgirls in Lahore (Pakistan) who had shown better results in academic performance and school attendance with increasing family monthly income and decreasing severity of ID.4
Age and sex were not associated with academic achievement in this study. Unlike our study, the previously mentioned study in Lahore did not show the relationship of academic achievement and sex, since it was done on girls only. However; it clearly indicated that there was no significant difference among girls of different age groups in academic performance and school attendance, which is in agreement with our finding.4
In summary, there are striking observations in this study: children who were exposed to IDD had shown more than a fourfold risk of achieving low grades in school; more than a third had long bouts of absenteeism from class and about 12.0% dropped out from school. The practical implication of this finding is that, in addition to its impact on physical health, ID has significant effect on academic performance, school attendance and full utilization of mental potential at school. It also has an impact on future economic productivity of children as reflected by the poor economic status of the family. This should alarm public health program managers to take additional actions for this preventable condition.
One of the strengths of this study was the fact that it tried to assess the effect of ID on academic achievement of children, which was relatively the most neglected area in Ethiopia, using a well-designed prospective cohort. In this study, the exposure status was clearly defined at baseline by using the clinical indicator of chronic iodine nutrition deficiency (goiter).21–23 However; it has also limitations that should be acknowledged. In measuring intellectual capacity, genetic variation of children could be a potential confounder, which was not measured in our study. In addition, IQ testing was not used to measure the intellectual capacity of these children. As it is well known, IQ of children can vary according to geographical location, age, gender, socio-economic status, and school environment.9 Therefore; it was very difficult to measure it in the absence of a standardized testing system in the current study area.
Conclusions
Exposure to long-term ID leads to low school performance of children, increased absence from the class and dropout from the school. Iodine-deficient children were unable to utilize their full mental potential at school in southern Ethiopia.
Abbreviations
BAZ, BMI for age Z score; BMI, body mass index; HAZ, height for age Z score; IRB, Institutional Review Board; IQ, Intelligence Quotient; ICC, intracluster correlation coefficient; ID, iodine deficiency; IDD, iodine deficiency disorder; IGN, Iodine Global Network; PCA, Principal Component Analysis; PI, principal investigator; SRS, simple random sampling; SNNPR, South Nation Nationalities and People’s Region; UIC, urinary iodine concentration; VIF, Variance Inflation Factor; WAZ, weight for age Z score; WHO, World Health Organization.
Data Sharing Statement
All data used and/or analyzed during the current study are available from the corresponding author on reasonable request.
Ethical Considerations
Ethical clearance and approval was obtained from Jimma University, College of Public Health and Medical Sciences ethical clearance review committee (IRB). An official letter of co-operation (Ref. No-RPGC/4052/08) was written by the University to Dawro zone administrative and health offices. The zonal offices in turn wrote official letters to their respective district offices and school directors. A written consent was obtained from the parents of each pupil through the school director and parent committee for disclosure of school performance (grade scores) of the student. Moreover, all the study participants/guardians were informed about the purpose and confidentiality of the information along with their right to refuse. The study was also registered on pan African clinical trials registration with a registration number of PACTR201809544276357 on September 14, 2018.
Acknowledgments
The authors would like to thank the study subjects, data collectors and supervisors; without their willingness and participation this study could not have been achieved. Our special thanks go to Jimma University, Wolkite University and Dawro zone administration and health departments for their continuous support and encouragement.
Author Contributions
Both authors contributed to data analysis, drafting or revising the article, have agreed on the journal to which the article will be submitted, gave final approval of the version to be published, and agree to be accountable for all aspects of the work.
Disclosure
The authors report no conflicts of interest in this work.
References
1. WHO. Guideline: Fortification of Food-Grade Salt with Iodine for the Prevention and Control of Iodine Deficiency Disorders. Geneva:World Health Organization; 2014. Available from:http://apps.who.int/iris/bitstream/handle/10665/136908/9789241507929eng.pdf?ua=1.
2. Hynes KL, Otahal P, Burgess JR, Oddy WH, Hay I. Reduced educational out comes persist into adolescence following mild iodine deficiency in utero, despite adequacy in childhood: 15-year follow-up of the gestational iodine cohort investigating auditory processing speed and working memory. Nutrients. 2017;9(12):1354. doi:10.3390/nu9121354
3. Marianne H, Ragnhild E, Ida H, et al. Language delay and poorer school performance in children of mothers with inadequate iodine intake in pregnancy: results from follow-up at 8 years in the Norwegian Mother and Child Cohort Study. Eur J Nutr. 2019;58(8):3047–3058. doi:10.1007/s00394-018-1850-7
4. Mushtaq R, Ramzan M, Bibi A. Effects of iodine deficiency goiter on academic performance of girls. Biomedica. 2014;30(1):40–53.
5. Mezgebu Y, Mossie A, Rajesh PN, Fentahun H. Iodine deficiency disorder and its association with academic performance among children in Jimma Town, Southwestern Ethiopia. J Food Nutr Sci. 2017;5(2):44–50. doi:10.11648/j.jfns.20170502.14
6. Chinyoka K. Impact of poor nutrition on the academic performance of grade seven learners: a case of Zimbabwe. Int J Learn Dev. 2014;4(3):73–84. doi:10.5296/ijld.v4i3.6169
7. Umar AI, Umar RA, Wasagu RSU, Oche MO. Effect of inadequate iodine status on academic performance of secondary school girls in Sokoto State, Nigeria. Greener J Epidemiol Public Health. 2018;6(1):029–033. doi:10.15580/GJEPH.2018.1.122117184
8. Michael B. The Effects of Iodine Deficiency in Pregnancy and Infancy. Switzerland Pediatr Perinatal Epidemiol. 2012;26(Suppl. 1):108–117. doi:10.1111/j.1365-3016.2012.01275.x
9. Ranabhat C, Kim CB, Park MB, et al. Determinants of body mass index and intelligence quotient of elementary school children in mountain area of Nepal: an explorative study. Children. 2016;3(3). doi:10.3390/children3010003
10. Biesalski Hans K, Jana T. Micronutrients in the life cycle: requirements and sufficient supply. NFS J. 2018;11(2018):1–11. doi:10.1016/j.nfs.2018.03.001
11. Karim Bougma, Frances E, Aboud, Kimberly B, Grace S, Marquis G. Iodine and mental development of children 5 years old and under: a systematic review and meta-analysis. Nutrients. 2013;5(4):1384–1416. doi:10.3390/nu5041384
12. Erica and Omar Robles. Iodine Deficiency and Schooling Attainment in Tanzania. Harvard University press; 2006.
13. Mohammed H, Marquis GS, Aboud F, Bougma K, Samuel A. Pre-pregnancy iodized salt improved children’s cognitive development in randomized trial in Ethiopia. Matern Child Nutr. 2020;e12943.
14. Iodine Global Network. Global Scorecard of Iodine Nutrition in 2017 in the General Population and in Pregnant Women (PW). Zurich, Switzerland: IGN; 2017.
15. Hailu S, Wubshet M, Woldie H, Tariku A. Iodine deficiency and associated factors among school children: a cross-sectional study in Ethiopia. Belgian Public Health Assoc. 2016;74(46):1–13.
16. Bitew S, Gebremariam Y, Admasie A, Chane T. Assessing the status of iodine deficiency disorder (IDD) and associated factors in Wolaita and Dawro Zones School Adolescents, southern Ethiopia. BMC Res Notes. 2017;10(156):254.
17. Keno T, Ahrens C, Lauvai J, Kurabachew H, Konrad H, Scherbaum V. Iodine status in pregnant women & school children of the Aira district in Ethiopia. NFS J. 2017;7(1):1–7. doi:10.1016/j.nfs.2017.03.001
18. Bekele A, Adilo T. Prevalence of goiter and its associated factors among primary school children in Chole District, Arsi Zone, Ethiopia: a cross-sectional study. BMC Nutr. 2019;5(5). doi:10.1186/s40795-018-0267-2
19. Fereja M, Gebremedhin S, Gebreegziabher T, Girma M, Barbara J. Prevalence of iodine deficiency and associated factors among pregnant women in Ada district, Oromia region, Ethiopia: a cross- sectional study. BMC Pregnancy Childbirth. 2018;18(1):257. doi:10.1186/s12884-018-1905-z
20. Asfaw A, Belachew T. Magnitude of iodine deficiency disorder and associated factors in Dawro zone, southwest Ethiopia; the hidden hunger: a cross-sectional study. BMC Nutr. 2020;5(5). doi:10.1186/s40795-020-00345-8
21. Hussain H, Selamat R, Kuay LK, et al. Urinary Iodine: biomarker for population iodine nutrition, biochemical testing - clinical correlation and diagnosis. Intech Open. 2019. doi:10.5772/intechopen.84969
22. WHO. Urinary iodine concentrations for determining iodine status deficiency in populations. Vitamin and Mineral Nutrition Information System. Geneva; 2013. (http://www.who.int/nutrition/vmnis/indicators/urinaryiodine.).
23. WHO. Assessment of Iodine Deficiency Disorders and Monitoring Their Elimination: A Guide for Program Managers: Geneva; 2007.
24. WHO/CDC.Methodological Approaches to Estimating Global and Regional Prevalence of Vitamin and Mineral Deficiencies. Report on the Joint World Health Organization/US Centers for Disease Control and Prevention Technical Consultation. Atlanta; 2014.
25. WHO. World Health Organization Child Growth Standards Based on Length/Height, Weight and Age: WHO Multicenter Growth References Study Group. Acta Pædiatrica; 2006.
26. WHO. World Health Organization Reference 2007 Software for Assessing Children and Adolescents (5–19years). Acta Pædiatrica: WHO multicenter growth references study group; 2006.
 © 2020 The Author(s). This work is published and licensed by Dove Medical Press Limited. The full terms of this license are available at https://www.dovepress.com/terms.php and incorporate the Creative Commons Attribution - Non Commercial (unported, v3.0) License.
By accessing the work you hereby accept the Terms. Non-commercial uses of the work are permitted without any further permission from Dove Medical Press Limited, provided the work is properly attributed. For permission for commercial use of this work, please see paragraphs 4.2 and 5 of our Terms.
© 2020 The Author(s). This work is published and licensed by Dove Medical Press Limited. The full terms of this license are available at https://www.dovepress.com/terms.php and incorporate the Creative Commons Attribution - Non Commercial (unported, v3.0) License.
By accessing the work you hereby accept the Terms. Non-commercial uses of the work are permitted without any further permission from Dove Medical Press Limited, provided the work is properly attributed. For permission for commercial use of this work, please see paragraphs 4.2 and 5 of our Terms.