Back to Journals » Nature and Science of Sleep » Volume 13
Effect of Interaction Between Slow Wave Sleep and Obstructive Sleep Apnea on Insulin Resistance: A Large-Scale Study
Authors Huang W ![]() , Liu Y, Wang X, Li X
, Liu Y, Wang X, Li X ![]() , Liu Y
, Liu Y ![]() , Zou J, Xu H, Zhu H, Yi H
, Zou J, Xu H, Zhu H, Yi H ![]() , Guan J, Yin S
, Guan J, Yin S
Received 16 March 2021
Accepted for publication 20 May 2021
Published 4 June 2021 Volume 2021:13 Pages 739—749
DOI https://doi.org/10.2147/NSS.S311130
Checked for plagiarism Yes
Review by Single anonymous peer review
Peer reviewer comments 2
Editor who approved publication: Dr Elena Urrestarazu
Weijun Huang,1– 3,* Yuenan Liu,1– 3,* Xiaoting Wang,1– 3 Xinyi Li,1– 3 Yupu Liu,1– 3 Jianyin Zou,1– 3 Huajun Xu,1– 3 Huaming Zhu,1– 3 Hongliang Yi,1– 3 Jian Guan,1– 3 Shankai Yin1– 3
1Department of Otorhinolaryngology Head and Neck Surgery, Shanghai Jiao Tong University Affiliated Sixth People’s Hospital, Shanghai, People’s Republic of China; 2Otolaryngology Institute of Shanghai Jiao Tong University, Shanghai, People’s Republic of China; 3Shanghai Key Laboratory of Sleep Disordered Breathing, Shanghai, People’s Republic of China
*These authors contributed equally to this work
Correspondence: Huajun Xu; Hongliang Yi Email [email protected]; [email protected]
Objective: Slow-wave sleep (SWS) and obstructive sleep apnea (OSA) have attracted recent research attention. However, their joint effects on insulin resistance (IR) remain unclear. This study explored whether SWS influences the relationship between OSA and IR.
Methods: We enrolled potential participants in our sleep center from 2007 to 2019. We collected demographic and clinical characteristics and determined IR status. SWS was derived from polysomnography data. Logistic regression analysis was used to reveal the associations between SWS and IR.
Results: In all, 6966 participants (5709 OSA and 1257 primary snoring [PS] subjects) were enrolled. Less SWS increased the risk of IR in OSA patients but not in PS patients. OSA patients with SWS < 6.5% were more likely to have IR than were those with SWS > 21.3%. OSA was an independent risk factor for IR after adjusting for potential confounding factors. In stratified analyses according to the percentage of SWS, OSA patients with SWS < 6.5% had an odds ratio for IR of 2.461 (95% CI, 2.018– 3.002) compared to the PS group after adjusting for potential confounders.
Conclusion: Less SWS is associated with higher odds for IR in OSA patients but not in PS patients. OSA is independently associated with IR. In addition, OSA combined with an extreme lack of SWS has a more harmful effect on the status of IR than OSA itself.
Keywords: obstructive sleep apnea, slow-wave sleep, insulin resistance
Introduction
Sleep-disordered breathing has attracted research attention, especially in terms of abnormal ventilation during sleep. Obstructive sleep apnea (OSA) is a sleep breathing disorder with a prevalence of 3.5–4.6% in adults and 2–8% in children.1,2 In OSA subjects, repeated upper airway obstruction during sleep can lead to decreased blood oxygen saturation and sleep disorders. OSA increases the risk of cardiovascular, cerebrovascular, and metabolic diseases, leading to loss of work and death among middle-aged and elderly people.3 In addition, sleep fragmentation can cause daytime sleepiness, which then increases the incidence of related traffic accidents. Therefore, OSA has become an important public health problem.4
As we all know, the sleep period consists of rapid eye movement (REM) and non-rapid eye movement (NREM), which alternate during sleep.5,6 Slow-wave sleep (SWS or N3) stages is one of the NREM sleep apart from N1 and N2 stage.7 Circadian rhythms and homeostatic processes regulate sleep.5,8,9 The circadian rhythm is driven by the internal biological clock and is synchronized with the light/dark cycle, which can regulate sleep tendency throughout the entire day (24 h). Homeostatic processes express the sleep pressure that accumulates during wakefulness and determine the duration of sleep, and more specifically the percentage of SWS. SWS, or deep sleep, is thus a homeostatic process thought to reflect the restorative role of sleep.10
A growing number of people experience poor sleep quality due to sleep fragmentation and other factors, and sleep deprivation is becoming a major problem. We should be paying more attention to OSA and SWS suppression, which are common globally, and are thought to be independent risk factors for metabolic,11,12 cognitive,13,14 and cardiovascular problems.15
The significance of SWS is not restricted to neurophysiological restoration but encompasses a broad range of functions. Increasing evidence supports a crucial role for SWS in modulating a multitude of physiological processes, including memory consolidation,16 energy conservation,10 clearance of metabolites,17 and immunity.18 Other neuroendocrine changes that occur during SWS include increased release of growth hormone, higher insulin sensitivity, and decreased corticotropic and sympathetic nervous system activity.19,20 During SWS sleep, the upper airway appears to be less susceptible in OSA patients compared to their REM and NREM sleep stages. The apnea-hypopnea index (AHI) and lowest oxygen saturation clearly improve in most patients once they have achieved the SWS stage.21
Insulin resistance (IR) leads to various adverse clinical outcomes and increases the risk for the diseases mentioned above because of the decreased cellular response to insulin.22 IR is associated with sleep apnea23 and SWS deprivation.19 An experimental SWS deprivation model predicted a decrease in insulin sensitivity.19 In another study, SWS was not related to fasting blood glucose, insulin, or C-peptide levels when adolescents had mixed meals, nor did it impair insulin sensitivity or β-cell reactivity but young healthy-weight adults showed a decline of 25% from baseline insulin sensitivity after SWS suppression for 3 days.24
Other studies have had different outcomes. In one, less REM sleep led to higher cortisol concentrations and a higher homeostatic model assessment of insulin resistance (HOMA-IR) index, with no correlation between SWS and the index.25 In another, variation in SWS was related to variation in glucose metabolism but not insulin sensitivity.26
Despite such studies, the severity and medical implications of sleep disorders are seldom considered. Many sleep-related breathing disorders can lead to significant suppression of SWS. Little is known of the effects of less SWS in OSA, particularly with regard to IR. Whether OSA and decreased SWS are independently correlated with IR has not been determined. Moreover, these associations in Han Chinese populations have not yet been explored.
We performed a large-scale, hospital-based study to explore whether an objectively measured decrease in SWS% and OSA are independently associated with IR, and whether SWS influences the relationship between OSA and IR.
Methods
Study subjects were enrolled from 2007 to 2019 at our sleep center. This study was performed in accordance with the Declaration of Helsinki. The study protocol was approved by the Ethics Committee of Shanghai Jiao Tong University Affiliated Sixth People’s Hospital (Approval No: 2019-KY-050[K]) and was registered at the Chinese Clinical Trial Registry (No. ChiCTR1900025714). We obtained informed consent from all subjects.
Subject Recruitment
Subjects were enrolled according to the following inclusion and exclusion criteria. All participants were adults (aged ≥ 18 years) and underwent standard polysomnography (PSG). OSA patients had not previously been treated. Subjects with chronic diseases such as pulmonary, hepatic, and cardiac disease, or other comorbid sleep disorders (insomnia, upper airway resistance syndrome, narcolepsy and restless legs syndrome) were excluded. The participants did not take anxiolytics, antidepressants, hypnotics, antipsychotics, or anti-diabetes drugs. We learned about their general health status including habits such as smoking, alcohol consumption, and medication use through a comprehensive questionnaire. Participants completed the Epworth Sleepiness Scale (ESS).27 Those who scored an ESS value > 10 were considered to have excessive daytime sleepiness (EDS).28
Clinical and Biochemical Measurements
We used the mean values of two consecutive measurements to assess the physical condition of subjects including height (m), weight (kg), circumferences of neck, waist, and hip (cm), and blood pressure (mmHg), before PSG.29 Blood pressure was measured by a standard mercury sphygmomanometer after resting for 15 min. Body mass index (BMI) was the weight divided by the height squared (kg/m2). At 07:00 the next morning, fasting blood samples were taken from each participant. The glycolipid metabolism index was measured in our laboratory. The HOMA-IR index was calculated as fasting insulin (μU/mL) multiplied by fasting glucose (mmol/L) and the result divided by 22.5.30 Subjects with HOMA-IR ≥ 2.5 were classified into the IR group.31 Subjects diagnosed by their physician and using antihypertensive medications were considered to have hypertension. The diagnoses of diabetes and hyperlipidemia relied on their past history and the lipid index according to the 2016 ESC/EAS guidelines for the management of dyslipidemias.32
Polysomnography
All enrolled participants underwent full-night standard PSG at our sleep center using Alice 4, 5 or 6 devices (Respironics Inc, Pittsburgh, PA, USA). A skilled technician manually checked the data and PSG output reports according to the AASM 2007 guidelines.33 SWS was expressed as a percentage of TST and categorized into quartiles (for patients with OSA: > 21.3%, 13.1–21.3%, 6.5–13% and < 6.5%; for primary snorers: > 24.7%, 17.1–24.7%, 10.6–17%, < 10.6%). Patients with an AHI ≥ 5 events/h were included in the OSA group, while subjects with an AHI < 5 events/h were considered primary snoring (PS) subjects. Then OSA was classified into mild (AHI ≥ 5, < 15/h), moderate (AHI ≥ 15, < 30/h), and severe OSA (AHI ≥ 30/h).
Statistical Analyses
The sample size was determined based on power analysis. According to our data, 27.53% of primary snorers have IR, compared to 57.3% of those with OSA. With a power of 90% and α of 0.05, 228 participants were required. Assuming an attrition rate of 15%, a minimum of 263 participants were required. Continuous variables are shown as means ± SD. Skewed data are presented as the median (IQR). Categorical data are presented as percentages. We used ANOVA, t test, the Kruskal–Wallis tests, and the χ2 test to further analyze the data. OSA and non-OSA (primary snorers with an AHI < 5) groups were compared. For SWS, quartile reference groups were established and we used the highest SWS quartile as reference group. We used the polynomial linear trend test to calculate p-values for linear trends across groups. Logistic regression was used to analyze the associations between SWS and IR. Sex, age, BMI, alcohol consumption, smoking, hypertension, hyperlipidemia, TST, sleep efficiency (SE), ESS, and AHI (or SWS%) were considered covariates. A p-value < 0.05 indicated statistical significance. All statistical analyses were performed using SPSS software version 22.0 (IBM SPSS Statistics, IBM Corp., Armonk, NY, USA).
Results
The sample included 6966 subjects, of which 5709 were OSA patients (Table 1). An overwhelming majority of OSA patients were male, heavier, and older, with poorer metabolic profiles compared to simple snorers. Table 2 and Table S1 summarized the demographics and clinical characteristics of OSA and PS subjects stratified according to the percentage of SWS, respectively. In the OSA group, patients with a lower percentage of SWS were older, and had a higher BMI, higher prevalence of IR, higher AHI, and lower nocturnal oxygen saturation. On the contrary, no instructive significant difference in PS subjects was found (Table S1). In the whole cohort, OSA was independently correlated with IR after adjustment for potential confounding factors (OR, 1.876 [95% CI, 1. 592–2.211]) (Table 3). As shown in Table 3, subjects with SWS < 6.9% were 37.1% (odds ratio [OR], 1.371 [95% CI, 1.175–1.600]) more likely to have IR compared to those with SWS > 22.1% after adjusting for age, BMI, sex, alcohol consumption, smoking, hypertension, diabetes mellitus, and hyperlipidemia. However, significance disappeared after further adjusting for TST, SE, ESS, and AHI. Hence, SWS was not independently associated with IR in the whole cohort. The joint effect of OSA and SWS on IR were also presented in Table 3. Significantly increased odds of IR were found among OSA patients with a lower percentage of SWS. After adjusting for age, BMI, sex, alcohol consumption, smoking, hypertension, diabetes mellitus, hyperlipidemia, TST, SE and ESS, OSA patients with SWS < 6.5% had an odds ratio for IR of 2.461 (95% CI, 2.018–3.002) compared to the PS group (Table 3).
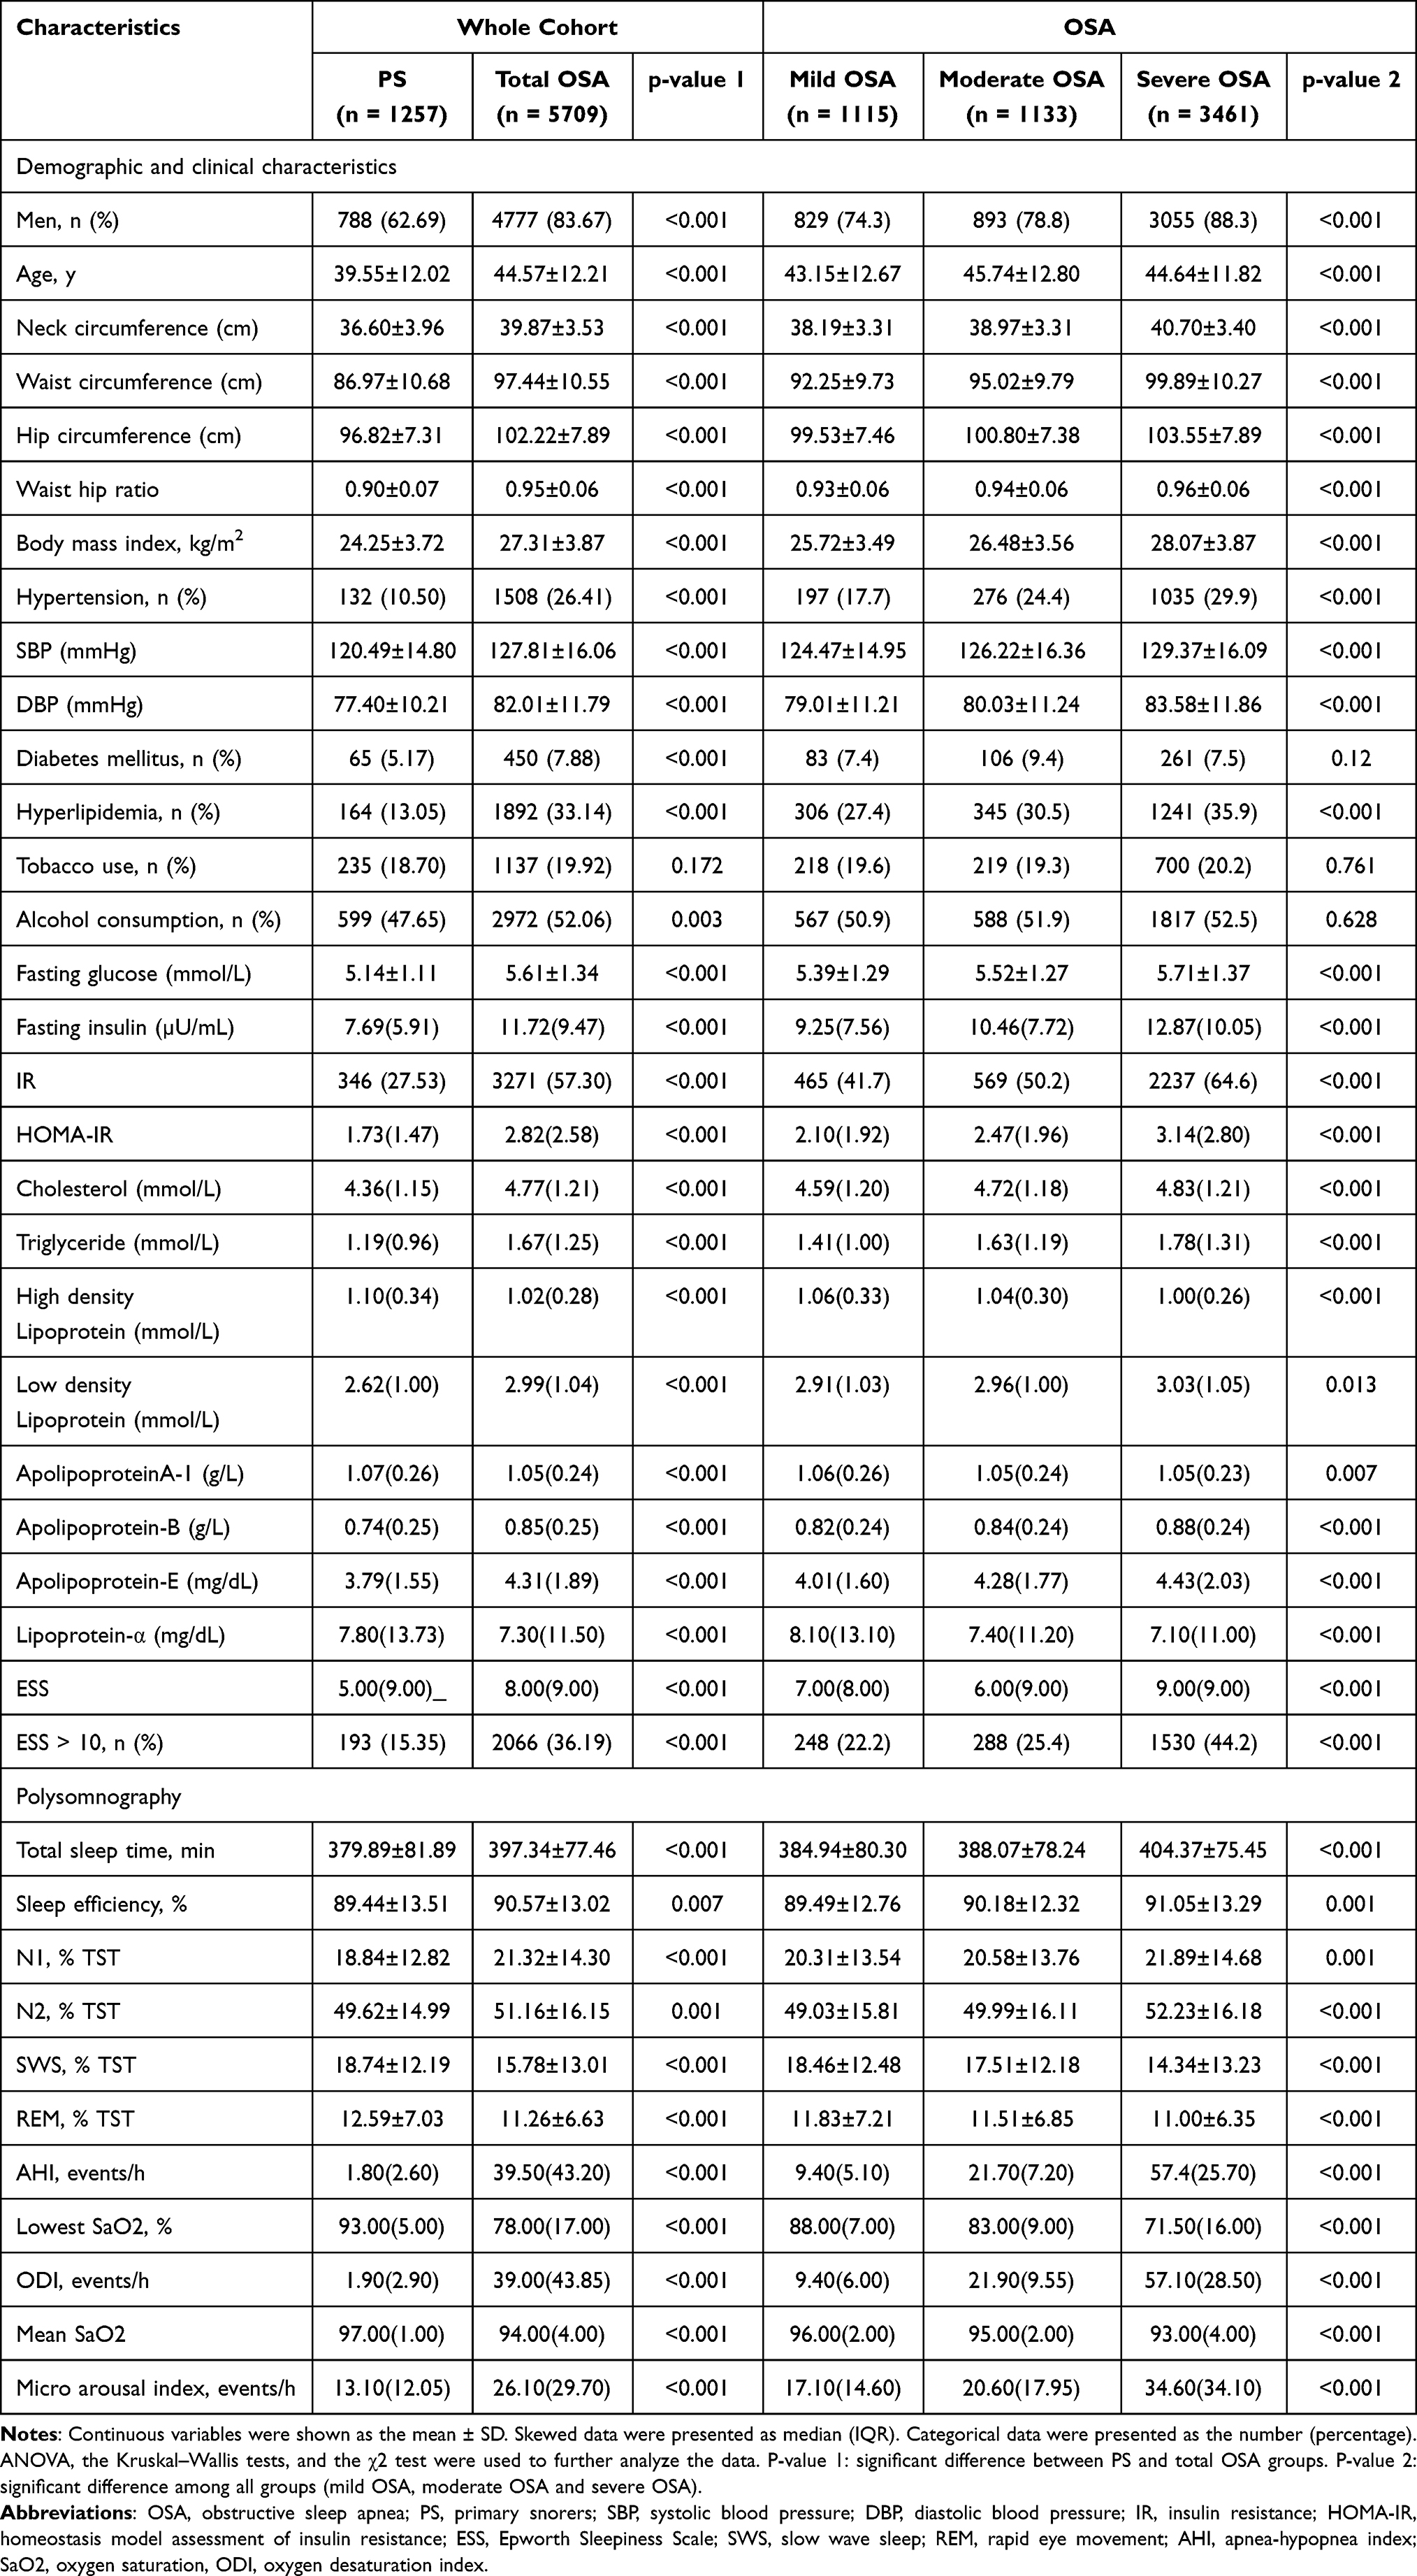 |
Table 1 Clinical and Sleep Characteristics of Subjects Stratified by OSA Severity Categories |
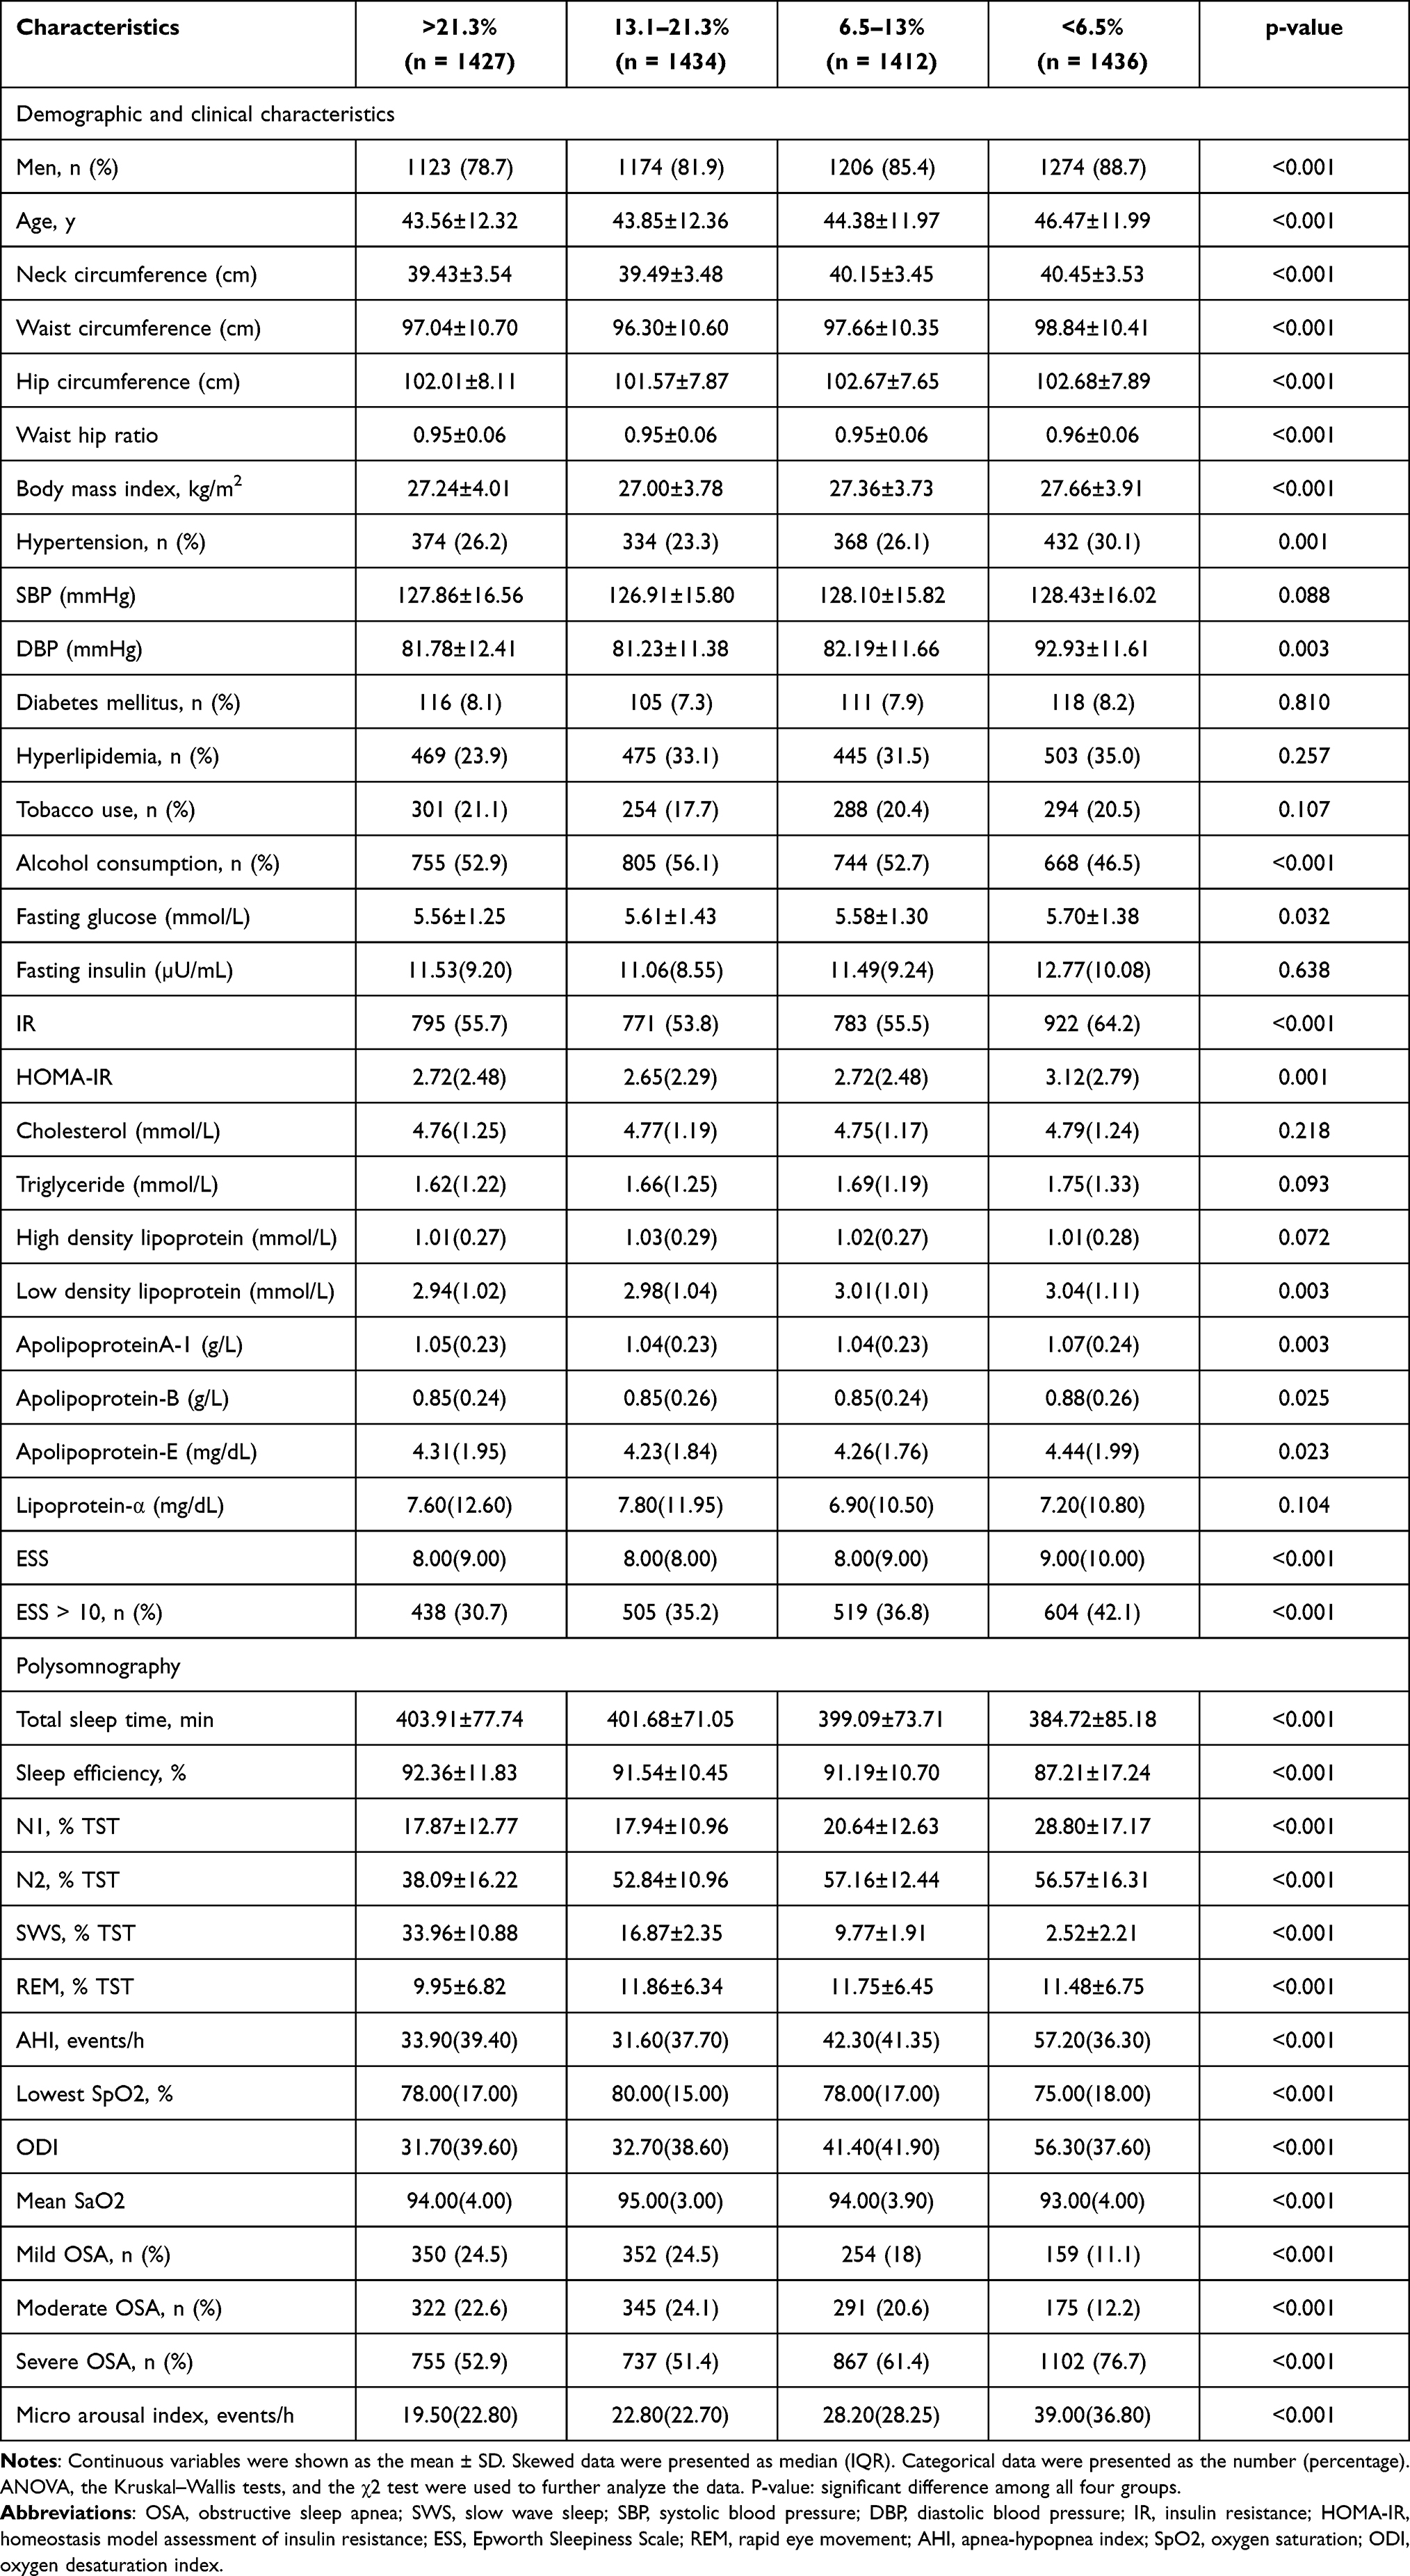 |
Table 2 Clinical and Sleep Characteristics of OSA Patients (n=5709) Stratified by SWS Categories |
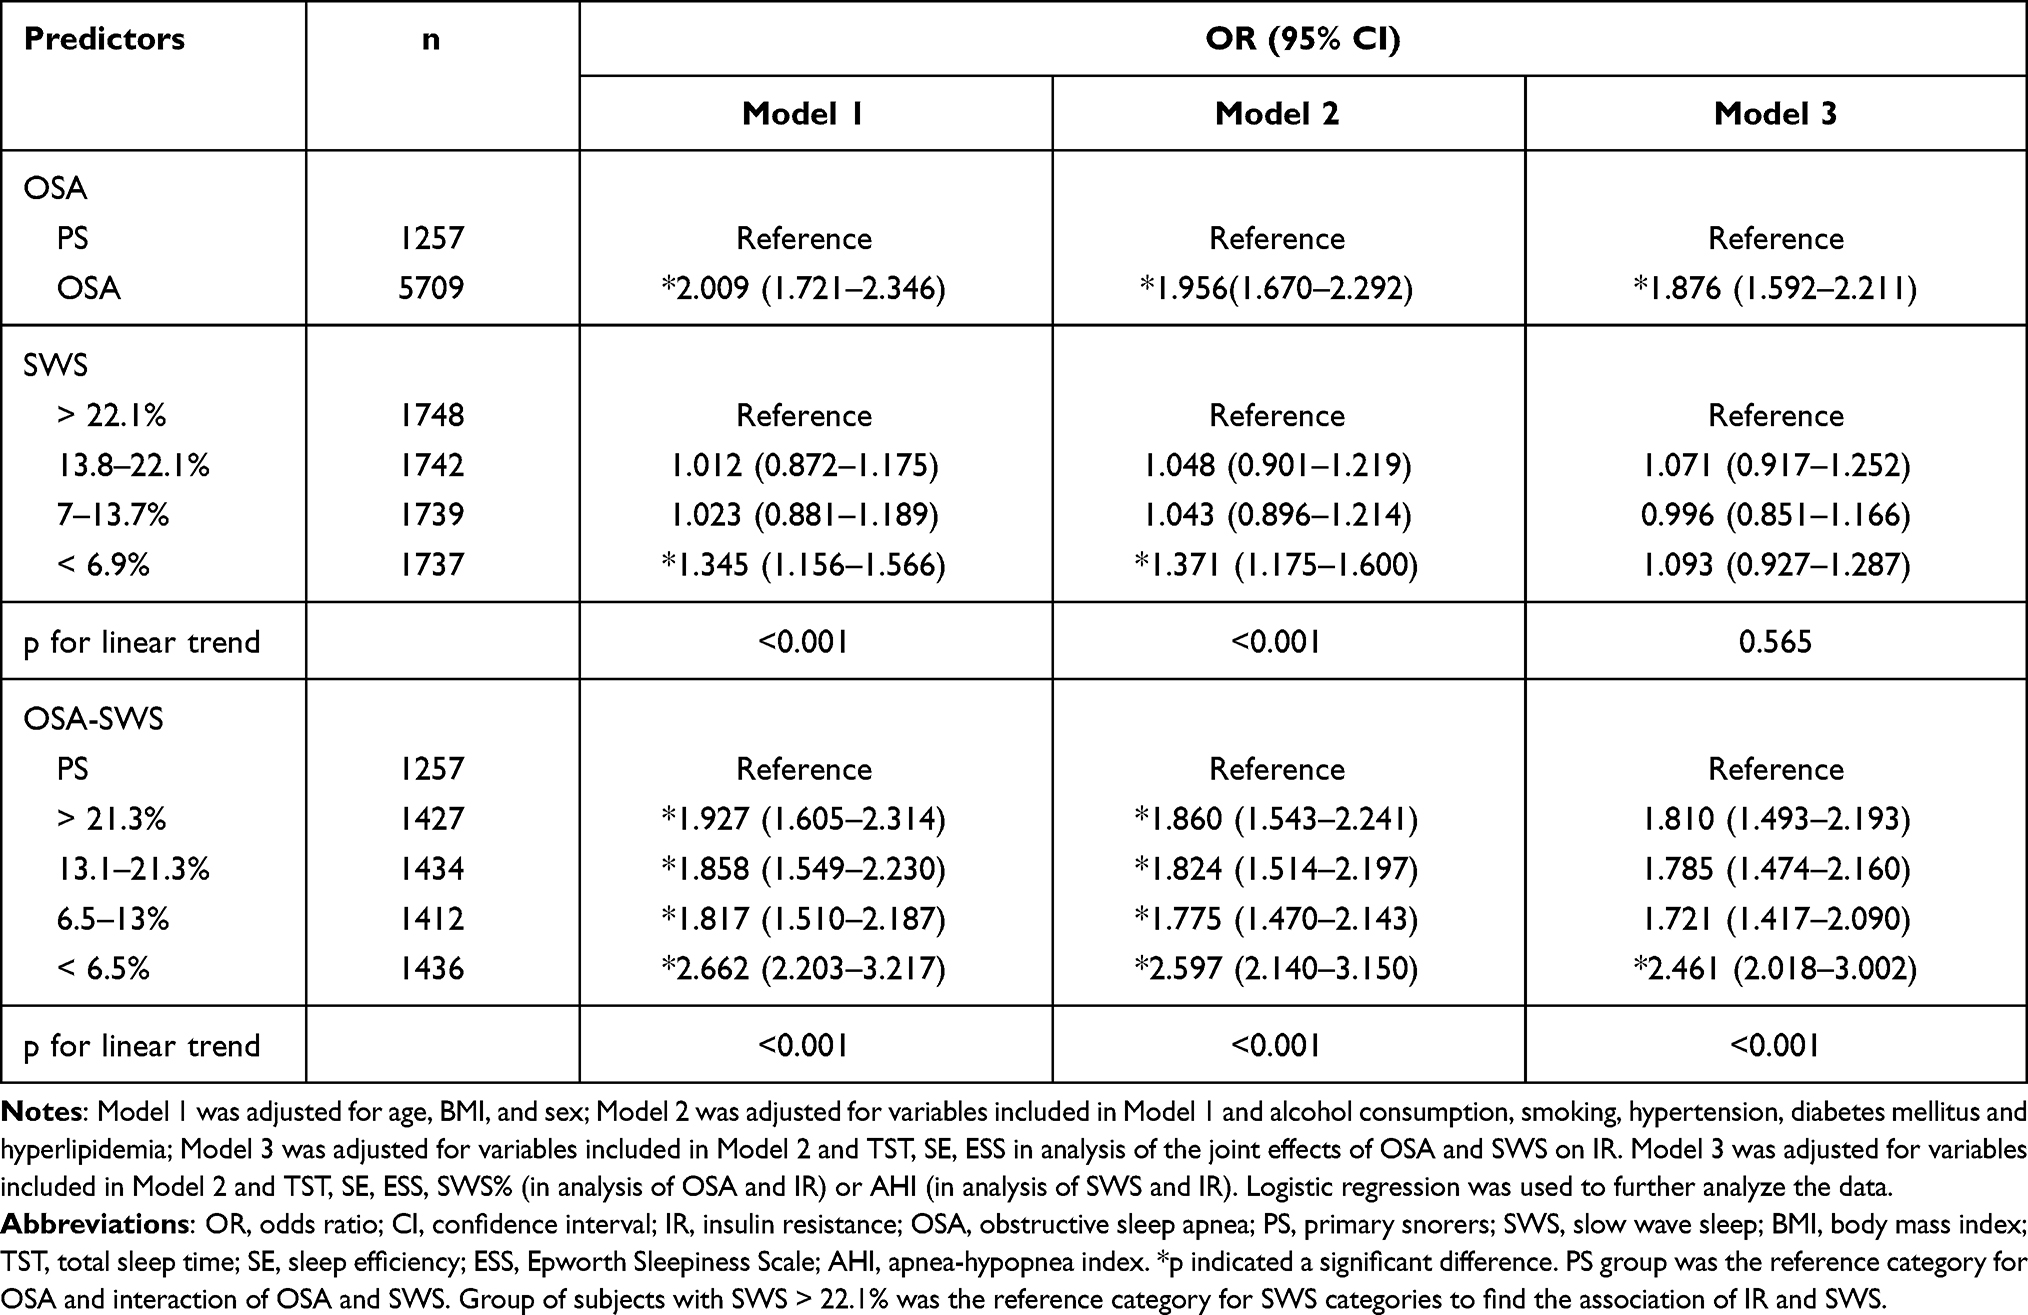 |
Table 3 Adjusted ORs and 95% CIs for the Associations of IR with OSA (PS as the Reference), SWS (SWS > 22.1% as the Reference) and Their Joint Effects (PS as Reference) |
SWS was significantly associated with IR in OSA patients (Table 4). A low percentage of SWS was associated with an increased risk of IR when OSA was present. After adjusting for potential confounders, OSA patients with SWS < 6.5% were 34.8% (odds ratio [OR], 1.348 [95% CI, 1.133–1.603]) more likely to have IR than those with SWS > 21.3% (Table 4). No significant relationship between SWS and IR was found in the PS group. Furthermore, SWS was significantly associated with IR in OSA patients varying in severity (Table 5). Using PS subjects as the reference, subjects with the lowest percentage of SWS showed the highest likelihood of IR, especially in moderate to severe OSA patients (Table 5).
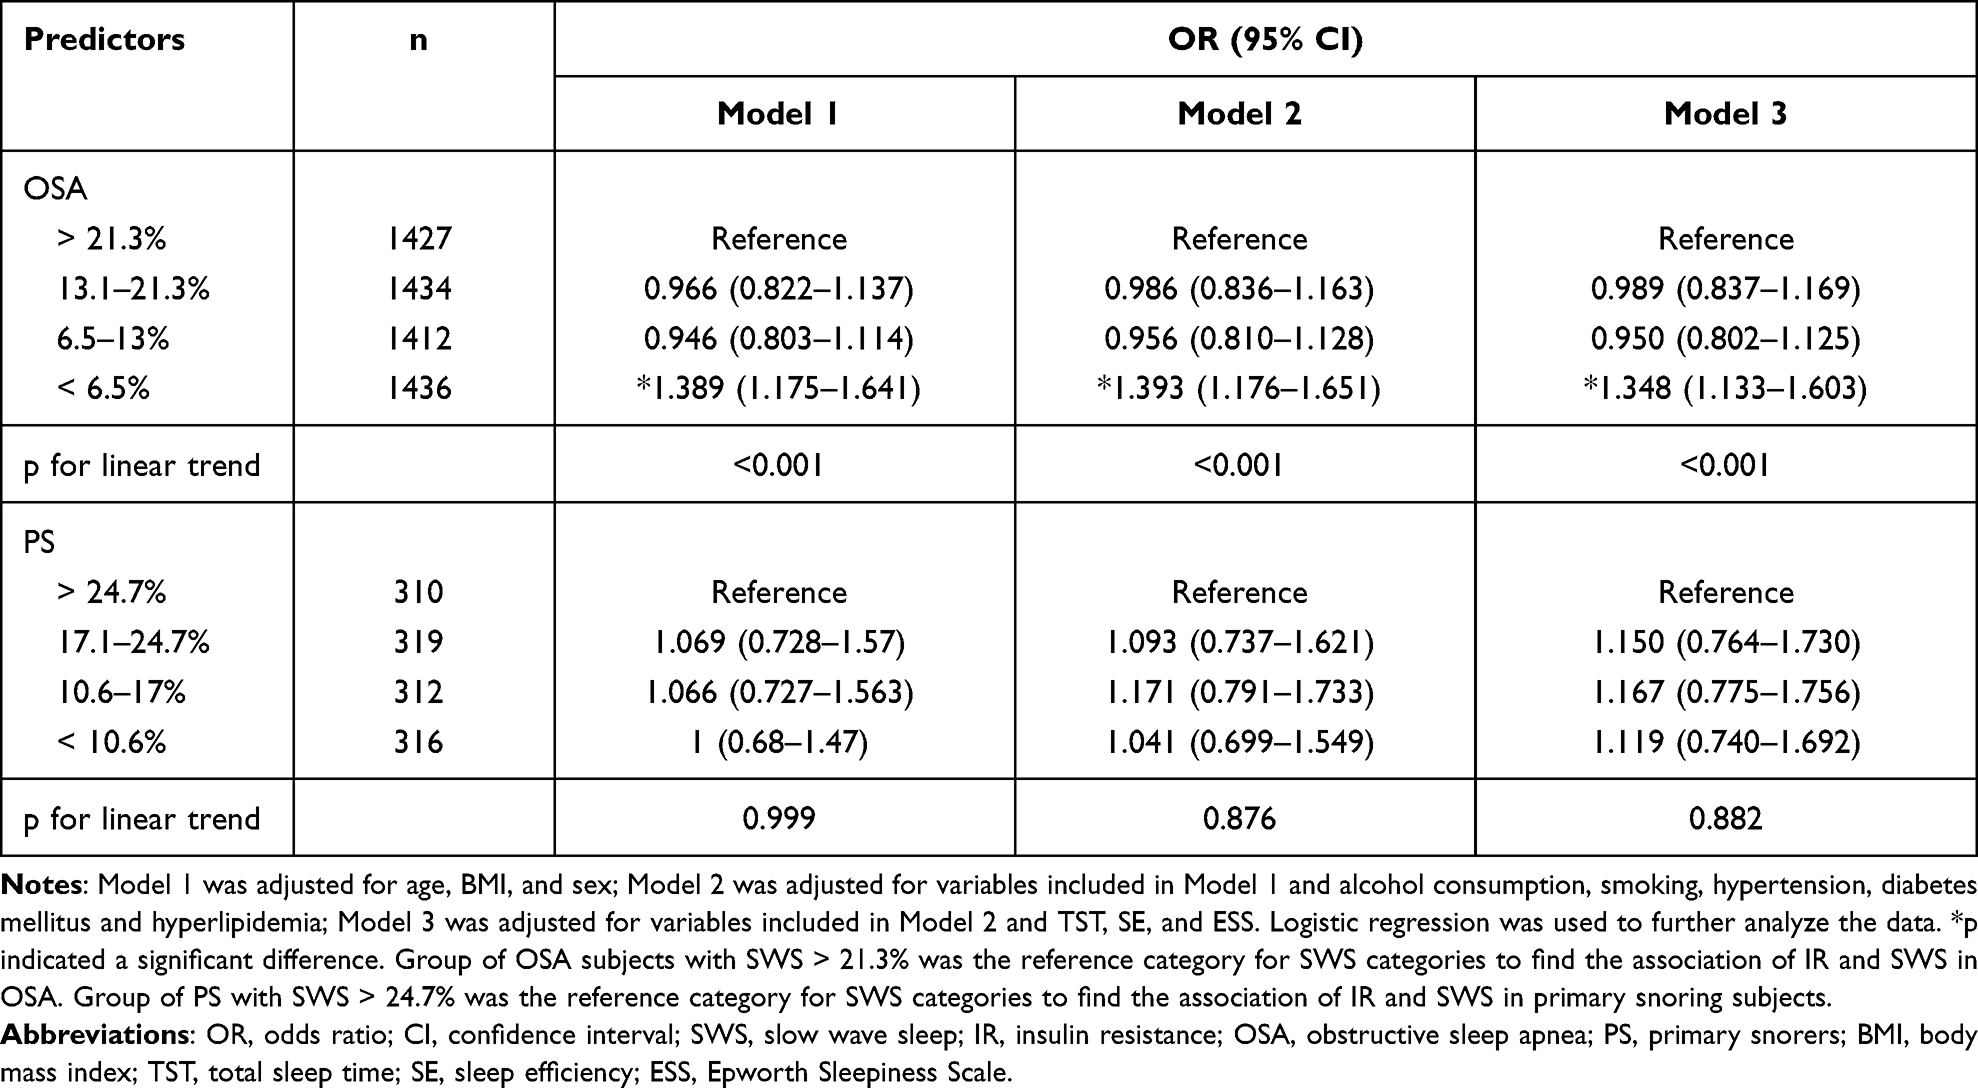 |
Table 4 Adjusted ORs and 95% CIs for the Association Between SWS and IR in OSA (SWS > 21.3% as the Reference) and PS Groups (SWS > 24.7% as the Reference) |
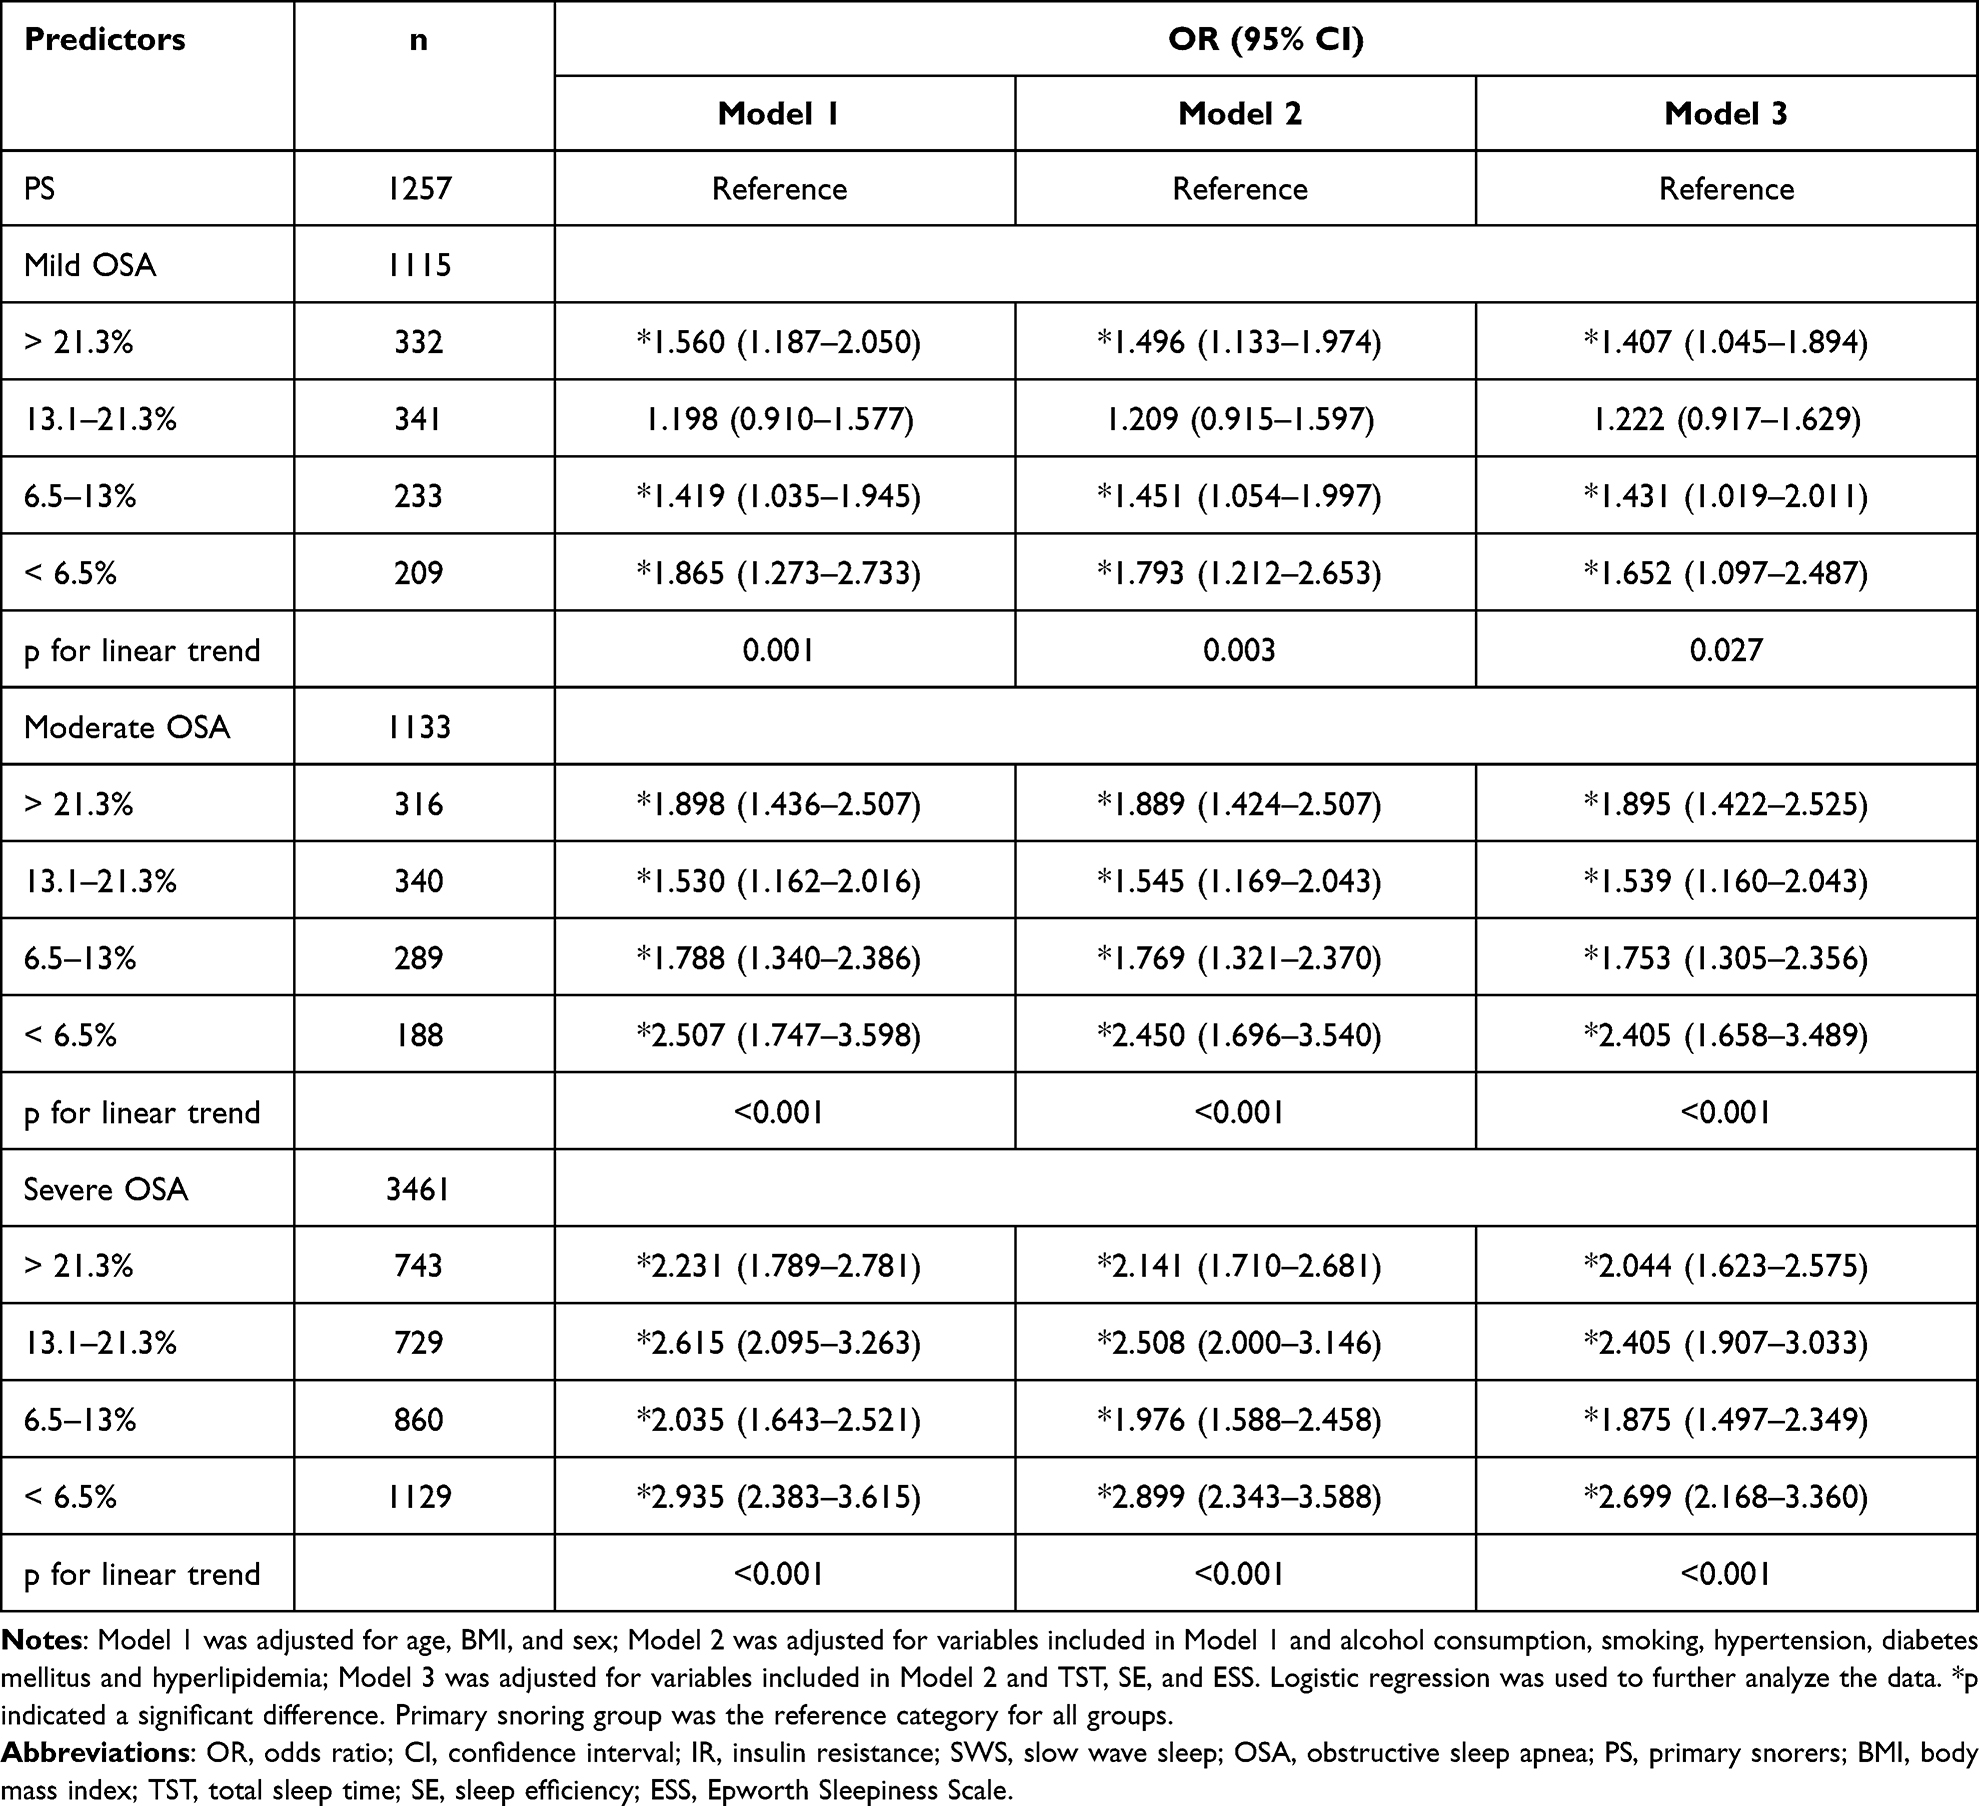 |
Table 5 Adjusted ORs and 95% CIs of IR Associated with SWS in Analyses Stratified by OSA Severity |
Besides, we performed a subgroup analysis by sex (male, female), age (< 60 years, ≥ 60 years) and BMI (< 28 kg/m2, ≥ 28 kg/m2), SWS was correlated with IR in thinner subjects especially with SWS < 6.5% (OR, 1.583; 95% CI, 1.223–2.050) (Table S2). We also performed multivariable linear regression to explore the interaction of AHI and SWS. AHI, SWS and AHI*SWS were significantly associated with HOMA-IR in the model (Table S3).
Discussion
We explored the association between SWS and the development of IR with a large sample of OSA and PS subjects. We found a significant interaction between SWS and OSA in patients with IR. OSA patients with SWS < 6.5% had higher odds of IR than primary snorers. AHI has been reported to increase the risk of IR after adjusting for confounding factors,34 and intermittent hypoxia might lead to hyperglycemia, hyperinsulinemia, and IR.35 Our study reaffirmed that patients with OSA are more likely to have IR than primary snorers. Greater odds of developing IR were evident only in OSA patients with a low percentage of SWS, indicating that OSA and SWS interacted and had a joint effect on IR. Further studies are needed on oxidative stress, excitability of the sympathetic nervous system, inflammation, and the dysfunction of hypothalamic-pituitary-adrenal (HPA) axis36 to reveal the potential mechanisms between OSA and IR.
Less SWS is becoming recognized as a marker for an increased risk for IR. In a previous study, as SWS increased, the HOMA-IR index significantly decreased, suggesting that it has a significant effect on improving IR.37 Benedict38 and Hermida39 theorized that the reduced risk for new-onset type 2 diabetes mellitus in patients with hypertension observed with bedtime ingestion of angiotensin-converting enzyme inhibitors was partially mediated by improvement in SWS.
Endocrine metabolism is regulated by sleep and the circadian rhythm. Insufficient sleep, and circadian rhythm or sleep structure disorders, lead to the imbalance of metabolic homeostasis, and further, cause hypertension, diabetes mellitus, and multiple organ injury. The mechanism is related to systemic inflammation and IR,40 accompanied by low expression of circadian clock genes.41,42 The circadian clock input signal related to chronic sleep deprivation directly reduces the expression of CRY proteins, which in turn activates the cAMP/PKA inflammation signaling pathway and leads to the synthesis of a series of inflammatory factors, resulting in a chronic low inflammatory state of the body. Inflammatory factors directly inhibit the PI3K/AKT signaling pathway, leading to IR and higher blood levels of glucose.37 Zhu43 analyzed the bivariate correlation between sleep structure and glucose and insulin levels. Subjects with higher TS and SE and SWS phases (%TST) had lower 2 h blood glucose, better islet β-cell function, and higher insulin sensitivity. For the thinner people, the metabolic status is less affected by obesity than the obese people, so the risk of IR caused by the reduction of SWS is greater. Meanwhile, higher N1 and N2 were related to poorer glucose tolerance and insulin sensitivity. The SWS stage still had the same effect on glucose and insulin metabolism indicators after adjusting for age, sex, BMI, puberty status and AHI. Therefore, overactivity of the sympathetic nervous system and SWS reduction might eventually lead to IR.44,45 Our study corroborates these previous findings, showing a graded relationship between less SWS and increased odds of IR. SWS may provide a reliable indicator of the biological and medical significance of OSA, although the percentage of SWS is not generally recommended as a criterion of severity in OSA. Meanwhile, OSA severity may modulate the effects of SWS on the odds of IR as the results above showed. Our main finding is that less SWS is associated with higher odds for IR in OSA but not in PS. It was more likely to be a threshold effect such that the odds of IR were significantly higher in the OSA patients with the lowest SWS quartile. OSA was independently associated with IR. OSA and SWS also have an interaction effect on IR.
An advantage of our study was the large sample size, which increases representativity. In addition, this is the first study to report that SWS moderates the association between OSA and IR. However, there were several limitations. First, hospital-based, full-night PSG did not truly reflect routine sleep. PSG in the sleep center is the gold standard for examining sleep stages and detecting respiratory-related events; therefore, first-night effects and variation among nights could not be ruled out. Second, this study was cross-sectional and observational. Prospective longitudinal research to confirm the relationship between sleep structure and glucose tolerance. Third, because menopause was related to changes in sleep quality and glucose metabolism,46,47 our findings may differ based on menopausal status.
Conclusions
SWS and OSA interact to increase the odds of developing IR. Compared to PS subjects, OSA is independently associated with IR after adjusting for potential confounding factors. The odds of IR in OSA patients are significantly higher for those in the lowest SWS quartile. Further studies are needed to elucidate the pathophysiological mechanisms underlying this relationship and to test the hypothesis that SWS enhancement may ameliorate the risk for IR.
Abbreviations
SWS, slow-wave sleep; OSA, obstructive sleep apnea; IR, insulin resistance; PS, primary snoring; REM, rapid eye movement; NREM, non-rapid eye movement; AHI, apnea hypopnea index; HOMA-IR, homeostasis model assessment for insulin resistance; PSG, polysomnography; ESS, Epworth Sleepiness Scale, EDS, excessive daytime sleepiness; BMI, body mass index; CI, confidence interval; SE, sleep efficiency; OR, odds ratio; SBP, systolic blood pressure; DBP, diastolic blood pressure; LSpO2, lowest oxygen saturation; ODI, oxygen desaturation index; SaO2, oxygen saturation.
Data Sharing Statement
The datasets used and analyzed in this study are available from Huajun Xu, the corresponding author, on reasonable request.
Ethics Approval and Consent to Participate
This study was performed in accordance with the Declaration of Helsinki. The study protocol was approved by the Ethics Committee of Shanghai Jiao Tong University Affiliated Sixth People’s Hospital (Approval No: 2019-KY-050[K]) and was registered at the Chinese Clinical Trial Registry (No. ChiCTR1900025714). We obtained informed consent from all subjects.
Acknowledgments
All of the authors are grateful to the staff in our sleep center and all of the subjects.
Author Contributions
The corresponding authors are responsible for the authenticity of the data. All authors made a significant contribution to the work reported, whether that is in the conception, study design, execution, acquisition of data, analysis and interpretation, or in all these areas; took part in drafting, revising or critically reviewing the article; gave final approval of the version to be published; have agreed on the journal to which the article has been submitted; and agree to be accountable for all aspects of the work.
Funding
The study was granted by grants from Shanghai Municipal Commission of Science and Technology (Grant No.18DZ2260200), Shanghai Science and Technology Innovation Program of Science and Technology Commission (Grant No. 20Y11902100), National Natural Science Foundation of China (Grant No. 81770988, 81970869) and Shanghai Shen-Kang Hospital Management Center Project (Grant No. SHDC2020CR2044B, SHDC2020CR3056B).
Disclosure
The authors declare that there is no conflict of interest in the study.
References
1. Senaratna CV, Perret JL, Lodge CJ, et al. Prevalence of obstructive sleep apnea in the general population: a systematic review. Sleep Med Rev. 2017;34:70–81. doi:10.1016/j.smrv.2016.07.002
2. Marcus CL, Brooks LJ, Ward SD, et al. Diagnosis and management of childhood obstructive sleep apnea syndrome. Pediatrics. 2012;130(3):e714–755. doi:10.1542/peds.2012-1672
3. Huang W, Liu Y, Xu H, et al. Association of the serum irisin level with obstructive sleep apnea: a body mass index- and physical activity-matched study. Endocr J. 2020;67(6):607–612. doi:10.1507/endocrj.EJ19-0590
4. Bagai K. Obstructive sleep apnea, stroke, and cardiovascular diseases. Neurologist. 2010;16(6):329–339.
5. Parrino L, Vaudano AE. The resilient brain and the guardians of sleep: new perspectives on old assumptions. Sleep Med Rev. 2018;39:98–107.
6. Bathory E, Tomopoulos S. Sleep regulation, physiology and development, sleep duration and patterns, and sleep hygiene in infants, toddlers, and preschool-age children. Curr Probl Pediatr Adolesc Health Care. 2017;47(2):29–42.
7. Berry RB, Budhiraja R, Gottlieb DJ, et al. Rules for scoring respiratory events in sleep: update of the 2007 AASM manual for the scoring of sleep and associated events – deliberations of the sleep apnea definitions task force of the American Academy of Sleep Medicine. J Clin Sleep Med. 2012;8(5):597–619.
8. Blunden S, Galland B. The complexities of defining optimal sleep: empirical and theoretical considerations with a special emphasis on children. Sleep Med Rev. 2014;18(5):371–378.
9. Wigren HK, Porkka-Heiskanen T. Novel concepts in sleep regulation. Acta Physiol (Oxf). 2018;222(4):e13017.
10. Léger D, Debellemaniere E, Rabat A, Bayon V, Benchenane K, Chennaoui M. Slow-wave sleep: from the cell to the clinic. Sleep Med Rev. 2018;41:113–132.
11. Wang F, Xiong X, Xu H, et al. The association between obstructive sleep apnea syndrome and metabolic syndrome: a confirmatory factor analysis. Sleep Breath. 2019;23(3):1011–1019.
12. Whitaker KM, Lutsey PL, Ogilvie RP, et al. Associations between polysomnography and actigraphy-based sleep indices and glycemic control among those with and without type 2 diabetes: the multi-ethnic study of atherosclerosis. Sleep. 2018;41:11.
13. Leng Y, McEvoy CT, Allen IE, Yaffe K. Association of sleep-disordered breathing with cognitive function and risk of cognitive impairment: a systematic review and meta-analysis. JAMA Neurol. 2017;74(10):1237–1245.
14. Wu L, Sun D, Tan Y. A systematic review and dose-response meta-analysis of sleep duration and the occurrence of cognitive disorders. Sleep Breath. 2018;22(3):805–814.
15. Barger LK, Rajaratnam SMW, Cannon CP, et al. Short sleep duration, obstructive sleep apnea, shiftwork, and the risk of adverse cardiovascular events in patients after an acute coronary syndrome. J Am Heart Assoc. 2017;6:10.
16. Diekelmann S, Born J. The memory function of sleep. Nat Rev Neurosci. 2010;11(2):114–126.
17. Ju YS, Ooms SJ, Sutphen C, et al. Slow wave sleep disruption increases cerebrospinal fluid amyloid-β levels. Brain. 2017;140(8):2104–2111.
18. Raison CL, Rye DB, Woolwine BJ, et al. Chronic interferon-alpha administration disrupts sleep continuity and depth in patients with hepatitis C: association with fatigue, motor slowing, and increased evening cortisol. Biol Psychiatry. 2010;68(10):942–949.
19. Tasali E, Leproult R, Ehrmann DA, Van Cauter E. Slow-wave sleep and the risk of type 2 diabetes in humans. Proc Natl Acad Sci USA. 2008;105(3):1044–1049.
20. Somers VK, Dyken ME, Mark AL, Abboud FM. Sympathetic-nerve activity during sleep in normal subjects. N Engl J Med. 1993;328(5):303–307.
21. Subramanian S, Hesselbacher S, Mattewal A, Surani S. Gender and age influence the effects of slow-wave sleep on respiration in patients with obstructive sleep apnea. Sleep Breath. 2013;17(1):51–56.
22. Artunc F, Schleicher E, Weigert C, Fritsche A, Stefan N, Häring HU. The impact of insulin resistance on the kidney and vasculature. Nat Rev Nephrol. 2016;12(12):721–737.
23. Punjabi NM, Shahar E, Redline S, Gottlieb DJ, Givelber R, Resnick HE. Sleep-disordered breathing, glucose intolerance, and insulin resistance: the Sleep Heart Health Study. Am J Epidemiol. 2004;160(6):521–530.
24. Shaw ND, McHill AW, Schiavon M, et al. Effect of slow wave sleep disruption on metabolic parameters in adolescents. Sleep. 2016;39(8):1591–1599.
25. Gonnissen HK, Mazuy C, Rutters F, Martens EA, Adam TC, Westerterp-Plantenga MS. Sleep architecture when sleeping at an unusual circadian time and associations with insulin sensitivity. PLoS One. 2013;8(8):e72877.
26. Buxton OM, Pavlova M, Reid EW, Wang W, Simonson DC, Adler GK. Sleep restriction for 1 week reduces insulin sensitivity in healthy men. Diabetes. 2010;59(9):2126–2133.
27. Chung KF. Use of the Epworth Sleepiness Scale in Chinese patients with obstructive sleep apnea and normal hospital employees. J Psychosom Res. 2000;49(5):367–372.
28. Johns M, Hocking B. Daytime sleepiness and sleep habits of Australian workers. Sleep. 1997;20(10):844–849.
29. Xu H, Zhao X, Shi Y, et al. Development and validation of a simple-to-use clinical nomogram for predicting obstructive sleep apnea. BMC Pulm Med. 2019;19(1):18.
30. Bonora E, Targher G, Alberiche M, et al. Homeostasis model assessment closely mirrors the glucose clamp technique in the assessment of insulin sensitivity: studies in subjects with various degrees of glucose tolerance and insulin sensitivity. Diabetes Care. 2000;23(1):57–63.
31. McAuley KA, Williams SM, Mann JI, et al. Diagnosing insulin resistance in the general population. Diabetes Care. 2001;24(3):460–464.
32. Catapano AL, Graham I, De Backer G, et al. 2016 ESC/EAS Guidelines for the management of dyslipidaemias. Eur Heart J. 2016;37(39):2999–3058.
33. Ho V, Crainiceanu CM, Punjabi NM, Redline S, Gottlieb DJ. Calibration model for apnea-hypopnea indices: impact of alternative criteria for hypopneas. Sleep. 2015;38(12):1887–1892.
34. Ip MS, Lam B, Ng MM, Lam WK, Tsang KW, Lam KS. Obstructive sleep apnea is independently associated with insulin resistance. Am J Respir Crit Care Med. 2002;165(5):670–676.
35. Zou J, Xia Y, Xu H, et al. Independent relationships between cardinal features of obstructive sleep apnea and glycometabolism: a cross-sectional study. Metabolism. 2018;85:340–347.
36. Gaines J, Vgontzas AN, Fernandez-Mendoza J, Bixler EO. Obstructive sleep apnea and the metabolic syndrome: the road to clinically-meaningful phenotyping, improved prognosis, and personalized treatment. Sleep Med Rev. 2018;42:211–219.
37. Huang WY, Zou X, Lu FE, et al. Jiao-tai-wan up-regulates hypothalamic and peripheral circadian clock gene cryptochrome and activates PI3K/AKT signaling in partially sleep-deprived rats. Curr Med Sci. 2018;38(4):704–713.
38. Benedict C. Antihypertensive medication prior to nocturnal sleep reduces the risk of new-onset type 2 diabetes in hypertensive patients: a role for slow-wave sleep? Diabetologia. 2016;59(2):390–391.
39. Hermida RC, Ayala DE, Mojón A, Fernández JR. Bedtime ingestion of hypertension medications reduces the risk of new-onset type 2 diabetes: a randomised controlled trial. Diabetologia. 2016;59(2):255–265.
40. Leproult R, Holmbäck U, Van Cauter E. Circadian misalignment augments markers of insulin resistance and inflammation, independently of sleep loss. Diabetes. 2014;63(6):1860–1869.
41. Brager AJ, Ehlen JC, Castanon-Cervantes O, et al. Sleep loss and the inflammatory response in mice under chronic environmental circadian disruption. PLoS One. 2013;8(5):e63752.
42. Qian J, Scheer F. Circadian system and glucose metabolism: implications for physiology and disease. Trends Endocrinol Metab. 2016;27(5):282–293.
43. Zhu Y, Li AM, Au CT, et al. Association between sleep architecture and glucose tolerance in children and adolescents. J Diabetes. 2015;7(1):10–15.
44. Esler M, Rumantir M, Wiesner G, Kaye D, Hastings J, Lambert G. Sympathetic nervous system and insulin resistance: from obesity to diabetes. Am J Hypertens. 2001;14(11 Pt 2):304s–309s.
45. Matthews KA, Dahl RE, Owens JF, Lee L, Hall M. Sleep duration and insulin resistance in healthy black and white adolescents. Sleep. 2012;35(10):1353–1358.
46. Shaver JL, Woods NF. Sleep and menopause: a narrative review. Menopause. 2015;22(8):899–915.
47. Ley SH, Li Y, Tobias DK, et al. Duration of reproductive life span, age at menarche, and age at menopause are associated with risk of cardiovascular disease in women. J Am Heart Assoc. 2017;6:11.
 © 2021 The Author(s). This work is published and licensed by Dove Medical Press Limited. The
full terms of this license are available at https://www.dovepress.com/terms
and incorporate the Creative Commons Attribution
- Non Commercial (unported, 3.0) License.
By accessing the work you hereby accept the Terms. Non-commercial uses of the work are permitted
without any further permission from Dove Medical Press Limited, provided the work is properly
attributed. For permission for commercial use of this work, please see paragraphs 4.2 and 5 of our Terms.
© 2021 The Author(s). This work is published and licensed by Dove Medical Press Limited. The
full terms of this license are available at https://www.dovepress.com/terms
and incorporate the Creative Commons Attribution
- Non Commercial (unported, 3.0) License.
By accessing the work you hereby accept the Terms. Non-commercial uses of the work are permitted
without any further permission from Dove Medical Press Limited, provided the work is properly
attributed. For permission for commercial use of this work, please see paragraphs 4.2 and 5 of our Terms.