Back to Journals » Diabetes, Metabolic Syndrome and Obesity » Volume 16
Effect of Hypoglycemic Drugs on Kisspeptin Expression in the Hypothalamic Arcuate Nucleus of PCOS Rats
Authors Zheng P, Lu Y, Tang Y, Xu F, Wang L, Qian R, Hui C, Xu Q, He J, Deng D
Received 17 June 2023
Accepted for publication 23 August 2023
Published 7 September 2023 Volume 2023:16 Pages 2717—2732
DOI https://doi.org/10.2147/DMSO.S421911
Checked for plagiarism Yes
Review by Single anonymous peer review
Peer reviewer comments 3
Editor who approved publication: Prof. Dr. Juei-Tang Cheng
Pingping Zheng,1,* Yating Lu,2,* You Tang,1,* Fudong Xu,3 Lin Wang,2 Rui Qian,4 Cancan Hui,5 Qian Xu,2 Jianle He,1 Datong Deng2
1The General Practice Department, the First Affiliated Hospital of Anhui Medical University, Anhui Medical University, Hefei, People’s Republic of China; 2The Endocrinology Department, the First Affiliated Hospital of Anhui Medical University, Anhui Medical University, Hefei, People’s Republic of China; 3The Pathology Department, Beijing Chest Hospital, Capital Medical University, Beijing Tuberculosis & Thoracic Tumor Research Institute, Shoudu Medical University, Beijing, People’s Republic of China; 4The Neurology Department, the First Affiliated Hospital of Anhui Medical University, Anhui Medical University, Hefei, People’s Republic of China; 5The Geriatric endocrinology Department, the First Affiliated Hospital of Anhui Medical University, Anhui Medical University, Hefei, People’s Republic of China
*These authors contributed equally to this work
Correspondence: Datong Deng, Tel +86 13855134251, Fax +86 055163633742, Email [email protected]
Background: To investigate the change in hypothalamic kisspeptin-1 (Kiss1) expression during the development of polycystic ovary syndrome (PCOS) and hypoglycemic drug intervention.
Methods: Letrozole lavage was used to construct a polycystic ovary rat model. After successful modeling, we treated PCOS rats with metformin, pioglitazone, and acarbose, and we then observed changes in weight, estrus, glucose tolerance, insulin resistance, sex hormones, and hypothalamic kiss1 expression.
Results: PCOS rats exhibited increased body weight, abnormal estrous cycle, impaired glucose tolerance, insulin resistance, increased testosterone level, increased luteinizing hormone level, and increased Kiss1 expression in the hypothalamus. However, intervention with metformin, pioglitazone, and acarbose improved the reproductive and metabolic disorders as well as reduced hypothalamic Kiss1 expression.
Conclusion: The expression of hypothalamic Kiss1 may play an important role in the pathogenesis of PCOS. Metformin, pioglitazone, and acarbose may reduce the expression of hypothalamic Kiss1 by improving insulin resistance, thereby improving reproductive and metabolic disorders in PCOS rats.
Keywords: polycystic ovary syndrome, PCOS, kisspeptin, metformin, pioglitazone, acarbose
Introduction
Polycystic ovary syndrome (PCOS), first discovered by Stein et al in 1935, is a relatively common reproductive endocrine disease among women of reproductive age, and it has become the main cause of female infertility. Currently, approximately 6%-20% of women worldwide suffer from PCOS.1 Patients mainly present with hyperandrogenemia (HA), ovulation failure, ovarian polycystic changes, and insulin resistance (IR). Among them, hyperandrogenemia and insulin resistance are important mechanisms for the occurrence and development of PCOS.2 Because studies have shown that approximately 60%-70% of PCOS patients have abnormal glucose metabolism,3 improving insulin resistance has become a significant goal of PCOS treatment.
Currently, clinical drugs for improving insulin resistance mainly include metformin, pioglitazone, inositol, and acarbose, among which metformin is the hypoglycemic drug recognized by most guidelines for treatment. Metformin inhibits hepatic glucose output, improves peripheral tissue sensitivity to insulin, increases the ovulation rate, and reduces androgen levels in PCOS patients, but the specific mechanism of action is unclear.4 At the same time, some scholars have also found that pioglitazone significantly improves ovulation dysfunction in PCOS patients compared to metformin, which may be related to the changes in the peroxisome proliferation-activated receptor-γ (PPAR-γ) gene in PCOS patients. Pioglitazone relieves insulin resistance by activating PPAR-γ to affect gene transcription related to glucose and lipid metabolism.5,6 In addition, the Chinese guidelines for the diagnosis and treatment of PCOS in 2018 proposed that acarbose, as an alpha glycosidase inhibitor, not only reduces and slows the intestinal absorption of glucose but also increases insulin sensitivity, rectifies lipid metabolic disorders, and advances gastrointestinal function. Previous studies have also shown that acarbose adjusts the menstrual cycle of obese PCOS patients and that it can be used for the treatment of metabolic disorders in PCOS patients.7,8
Due to the clinical heterogeneity of PCOS, its etiology and mechanism need further exploration, among which the role of the hypothalamic-pituitary-ovarian axis (HPG) cannot be ignored. Hypothalamic gonadotropin-releasing hormone (GnRH) neurons secrete GnRH, which promotes the adenohypophysis to secrete luteinizing hormone (LH) and follicle-stimulating hormone (FSH) as well as acts on gonads.9 Increased GnRH and LH pulse frequency as well as decreased FSH in PCOS patients may affect the ovaries, resulting in increased androgens and impaired follicular development. These changes lead to the clinical characteristics of PCOS patients, such as crinosity, acne, menstrual disorders, and infertility.10 It is currently believed that kisspeptin encoded by the Kiss-1 gene is an important factor for the increased GnRH/LH pulse frequency.11,12 Kiss1 neurons are mainly distributed in the hypothalamus arcuate nucleus (ARC) and the anterior paraventricular nucleus (AVPV). Secreted kisspeptin binds to G-protein-coupled receptor 54 (GPR54, also known as Kiss-1r) in GnRH neurons, thus activating GnRH neurons to secrete GnRH. Several studies have shown that the expression of kisspeptin in PCOS patients is significantly higher than that in normal individuals.13 Recent studies have also found that Kiss-1r gene knockout (KO) mice show increased obesity and decreased energy expenditure, indicating that kiss1 plays a direct role in regulating energy balance and metabolism. Therefore, kiss1 is considered a new link between energy metabolic balance and reproductive function.14,15
In the present study, we used a letrozole-induced PCOS rat model and administered metformin, pioglitazone, and acarbose. The aim of the present study was to determine whether the metabolic and reproductive disorders of PCOS rats are improved and whether the expression of kiss1 in the hypothalamus is changed to further verify the role of kiss1 in energy metabolism and reproductive function as well as to provide a more reliable theoretical basis for the clinical treatment of PCOS patients.
Materials and Methods
Animals
A total of 62 healthy with normal motility cycles female Sprague‒Dawley rats (5–6 weeks old and approximately 170 g) were purchased from the Animal Center Institution of Anhui Medical University. The rats were housed and maintained in a room at 18–22 °C with a humidity of 60–80% with 12 hours of light per day. All rats were given access to feed and water ad libitum.
Main Reagents
Letrozole (100 mg/bottle; Shanghai Macklin Biochemical Co., Ltd.), metformin (0.5 g/tablet; Sino-American Shanghai Squibb Pharmaceuticals Co., Ltd.), pioglitazone (15 mg/tablet; Tianjin Takeda Pharmaceutical Co., Ltd.), acarbose (50 mg/tablet; Bayer Healthcare Co., Ltd.), Kiss-1 antibody (Abbiotec, USA), Kiss-1 Fluorescence In Situ Hybridization Kit (Boster Biological Technology Co., Ltd.), and ELISA kits (R&D Systems, USA) were used in the present study.
Main Instruments
Blood glucose meter (Roche Diagnostics GmbH, Germany), paraffin slicer (Leica, Germany), tissue-embedding machine (Anhui Electronics Research Institute), fluorescence microscope (Nikon, Japan), and binocular microscope (Olympus Corporation, Japan) were used in the present study.
Model Establishment of PCOS Rats and Intervention
After 3 days of adaptive rearing, rats were numbered from light to heavy according to their body weight and grouped by complete randomization (All potential confounders are controlled). Rats were randomly divided into two groups as follows: blank group (n=15) and model group (n=47). The PCOS rat model was generated by intragastric administration of letrozole16 (1 mg/kg of body weight dissolved in 1% CMC solution for 28 consecutive days, given daily). The rats in the blank group were given equal amounts of 1% CMC solution by intragastric administration for 28 consecutive days. After 28 days, 12 rats in the model group and 6 rats in the blank group were randomly selected and euthanized to observe their ovarian morphology and structure to evaluate the success rate of the model. Due to gavage injury, one rat in the blank group and three in the model group died unexpectedly. The remaining rats in the model group were divided randomly into the following four groups for drug intervention: metformin group (n=8), pioglitazone group (n=8), acarbose group (n=8), and letrozole group (n=8). The metformin, pioglitazone, and acarbose groups were given metformin (300 mg/kg of body weight dissolved in NS17), pioglitazone (5 mg/kg of body weight dissolved in NS18), and acarbose (60 mg/kg of body weight dissolved in NS19), respectively, by gavage daily for 21 consecutive days. During the same period, the letrozole group and blank group (n=8) were given an equal amount of NS daily for 21 consecutive days.
Rat Body Weight
During the modeling period and intervention period, the rats were weighed once every 7 days, and the weight change was calculated using the following formula: weight change = (final weight − beginning weight) / beginning weight) * 100%.
Rat Estrus Cycle
We monitored the estrus cycle from Day 19 to Day 28 after modeling and from Day 12 to Day 21 after the intervention. We observed the vaginal smear cells from each animal under a light microscope and determined the cycle as diestrus (predominantly leukocytes), proestrus (predominantly epithelial cells), estrus (predominantly keratinocytes), or metestrus (epithelial cells, keratinocytes, and leukocytes all visible) based on the shape and density of the cells.
Glucose Tolerance and Area Under the Curve
After the last medication intervention, the rats were fasted for 12 hours, and their body weight and fasting blood glucose were measured. After intraperitoneal injection of 50% glucose solution (4 mL/kg of body weight), blood glucose was measured at 15, 30, 60, and 120 min. The area under the curve (AUC) values for glucose tolerance were then calculated.
Collection of Blood and Soft Tissue Samples
The abdominal skin and muscles were cut out layer by layer to expose the bilateral ovaries after anesthetizing with 3% sodium pentobarbital (i.p.). The left ovary was conventionally embedded with paraffin and stained with hematoxylin and eosin to observe the ovarian histological morphology. The right ovary was weighed, and the ovarian index was calculated using the following formula: ovarian index (mg) = [ovarian weight (mg) / body weight (g)] x 100%). The right ovary was stored at −80 °C for later use. Blood samples were immediately collected from the heart through needle aspiration, and serum samples were isolated by centrifugation at 3000 × g for 15 minutes and stored at −80 °C until measurement. After cardiac perfusion with 150 mL of NS and 150 mL of 4% paraformaldehyde, the brains were removed. Brains were incubated in 4% paraformaldehyde + diethylpyrocarbonate (DEPC, 1:1000) overnight followed by sequential incubations with 10% sucrose solution + DEPC (1:1000), 20% sucrose solution + DEPC (1:1000), and 30% sucrose solution + DEPC (1:1000). After completing the above steps, the hypothalamus was embedded in paraffin, and serial coronal sections at 5-μm thickness were cut using a cryostat. The sections were collected in cryoprotectant solution and stored at −20 °C until immunohistochemistry (IHC) and fluorescence in situ hybridization (FISH) were performed.
Measurements of Hormones and Insulin
The serum levels of testosterone, LH, FSH, progesterone, estradiol, and insulin were measured using enzyme-linked immunosorbent assay kits according to the manufacturer’s instructions. The Homeostatic Model Assessment for Insulin Resistance (HOMA-IR) was then calculated using the following formula: HOMA-IR = fasting blood glucose level (FBG) * fasting insulin level (FINS)/22.5.
Immunohistochemistry
3–4 sections of the ARC (approx. AP −1.70 to −4.00 mm from Bregma) were used20 For routine dehydration of paraffin sections, the sections were immersed in the following solutions: two times (15 minutes each) in xylene, two times (5 minutes each) in 100% alcohol, one time in 90% alcohol (5 minutes), one time in 80% alcohol (5 minutes), one time in 70% alcohol (5 minutes), and one time in distilled water. The sections were removed and immersed in 500 mL of citrate repair solution, heated for 10 minutes, cooled for 5 minutes, reheated for 5 minutes, and cooled to room temperature. The sections were then rinsed three times (3 minutes each) in 0.01 M PBS, incubated in 3% H2O2 for 25 minutes at 37 °C, and rinsed three times (3 minutes each) in 0.01 M PBS. After washing, the sections were incubated at 4 °C overnight with anti-Kiss 1 rabbit polyclonal primary antibody (1:100, 50 μL/section) and then rewarmed at 37 °C for 20 minutes followed by three washes in 0.01 M PBS (5 minutes each). Next, the sections were incubated with HRP polysome-labeled goat anti-rabbit IgG secondary antibody at 37 °C for 20 minutes (50 μL/section) and then rinsed three times (5 minutes each) in 0.01 M PBS (negative control was set up during the experiment). The sections were sequentially stained with 3.3′-diaminobenzidine (DAB) for 15 seconds (the degree of staining was observed under a microscope), rinsed with running water, stained with hematoxylin for 2 minutes, and rinsed with running water for 15 minutes. Finally, the sections were dehydrated, placed on polylysine-treated glass slides, sealed with neutral gum, and imaged under a microscope. Kiss1-positive neurons in each section were counted using ImageJ.
Fluorescence in situ Hybridization
3–4 sections of the ARC (approx. AP K1.70 to K4.00 mm from Bregma) were used. Paraffin sections were dewaxed in water as previously described, treated with 3% citrate pepsin, reacted at room temperature for 20 min, washed three times (5 minutes each) with PBS, washed once with distilled water (2 minutes), fixed with 4% paraformaldehyde/0.1 M PBS+ DEPC (1:1000) for 5 min, and then rinsed three times with distilled water. This process exposed the kiss-1 mRNA nucleic acid fragments, and multiple oligonucleotide probes against the rat Kiss1 gene (5′-ATG CCT GGC AAA AGG GCC CGC GGT ATG CAG AGA GC-3′; 5′-ACC AGC GGC CCC CGT GTG CCA CCC GCA GTC GCC TG-3′; and 5′-GCT ACG GCA GGA GGC AGG TGG CGC GGG CGG CAC GG-3′) were used for the detection of Kiss1 mRNA. The sections were placed in a humidified hybrid box and incubated with prehybridization solution (20 μL/section) for 4 hours at 38 °C followed by incubation in hybridization solution (20 μL/section) overnight at 38 °C. The sections were then washed two times (5 minutes each) with 2× saline-sodium citrate (SSC), washed one time with 0.5× SSC for 15 minutes, and washed two times with 0.2× SSC for (15 minutes each), and then immersed in a blocking solution for 20 minutes at 37 °C. The sections were then incubated with a biotinylated mouse anti-digoxigenin antibody for 120 minutes at 37 °C. The sections were then sequentially washed four times (5 minutes each) with PBS. Following these steps, the sections were incubated in SABC-FITC+ PBS (1:100) for 30 minutes at 37 °C and then washed three times (5 minutes each) with PBS. Finally, the sections were sealed with glycerol and observed by a fluorescence microscope. The average optical density analysis of Kiss1 mRNA expressed in each section was analyzed using ImageJ.
Statistics
SPSS 26.0 was used for data analysis. All data were subjected to normal analysis, and all normal data are expressed as the mean±SEM. One-way or two-way ANOVA was used for data comparisons among multiple groups, and Tukey post hoc comparisons, Dunnett post hoc or Bonferroni post hoc comparisons were used for pairwise comparisons between groups. The rank-sum test was used for nonnormally distributed data. GraphPad Prism was used to generate graphs, and P < 0.05 was considered statistically significant for these analyses.
Results
Letrozole Induces Weight Gain in PCOS Rats
During the modeling period, the weight of the model group increased from Day 15 compared to the blank group. There was a significant difference in weight from Day 22 (P<0.05, as shown in Figure 1A), this difference increased with time (P<0.01, as shown in Figure 1A). During the intervention of metformin, pioglitazone, and acarbose compared to the letrozole group. Although the weights of the treated groups were lower than those of the letrozole group, the difference was not statistically significant (P>0.05, as shown in Figure 1B), and there was no significant difference in body weight after intervention (P>0.05, as shown in Figure 1C).
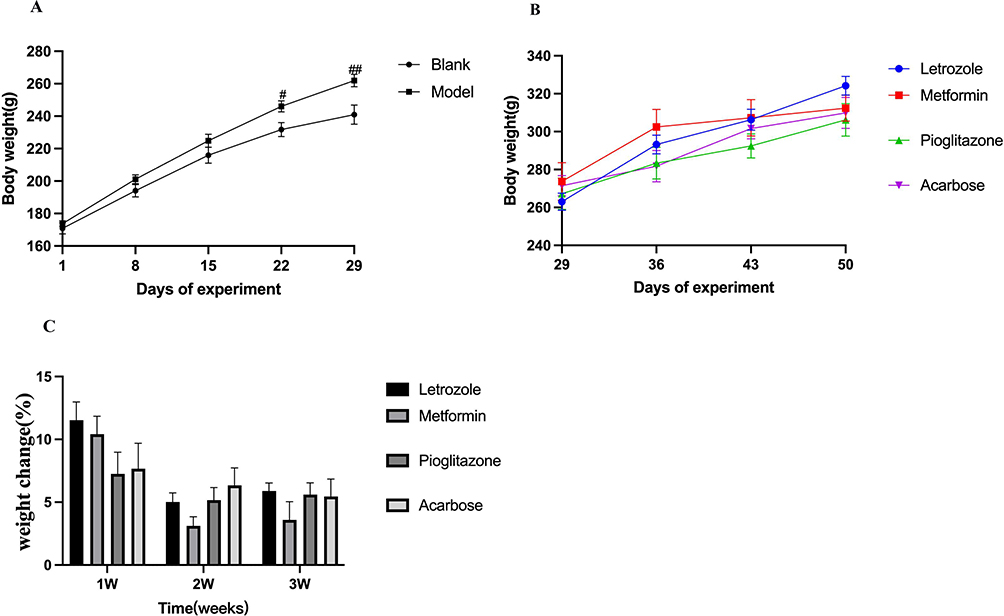 |
Figure 1 Changes and comparison of body weight of rats in different experimental groups. (A) Weight change between blank and model groups (n=14, n=44). Compared to the blank group, #P < 0.05, ##P <0.01, (B) the weight changes in the Letrozole group, metformin group, pioglitazone group and acarbose group, (C) the delta of weight change in each group, n=8 for each group. Values were presented as the mean±SEM (Data were analyzed for statistically significant differences using two-way ANOVA followed by Bonferroni post hoc test.). |
Metformin, Pioglitazone, and Acarbose Ameliorate Letrozole-Induced IR in PCOS Rats
Compared to the blank group, the fasting blood glucose of the PCOS rats induced by letrozole was significantly higher (P <0.001, as shown in Figure 2A). An intraperitoneal glucose tolerance test was performed in rats, which demonstrated that the glucose tolerance in the letrozole group was impaired as manifested by a significant increase in blood glucose at 60 min after glucose injection compared to that in the blank group (P <0.001, Figure 2A). After drug intervention, the glucose of rats in the pioglitazone group was significantly lower than that in the letrozole group at 15 min (P <0.001, Figure 2A), and the FINS and HOMA-IR were also significantly decreased (P <0.05, P <0.001, as shown in Figure 2C and D). Fasting blood glucose, FINS, HOMA-IR were significantly lower in the acarbose group compared to the letrozole group (P <0.05, as shown in Figure 2A, C and D). Compared with the letrozole group, the metformin group showed no significant difference in blood glucose at each point, but FINS and HOMA-IR were significantly decreased (P<0.05, P <0.001, as shown in Figure 2C and D). The AUC values indicated that there was no significant change in the blank group, letrozole group, metformin group, pioglitazone group, or acarbose group (P>0.05, as shown in Figure 2B). These results showed that letrozole-induced IR in PCOS rats is improved by metformin, pioglitazone, and acarbose.
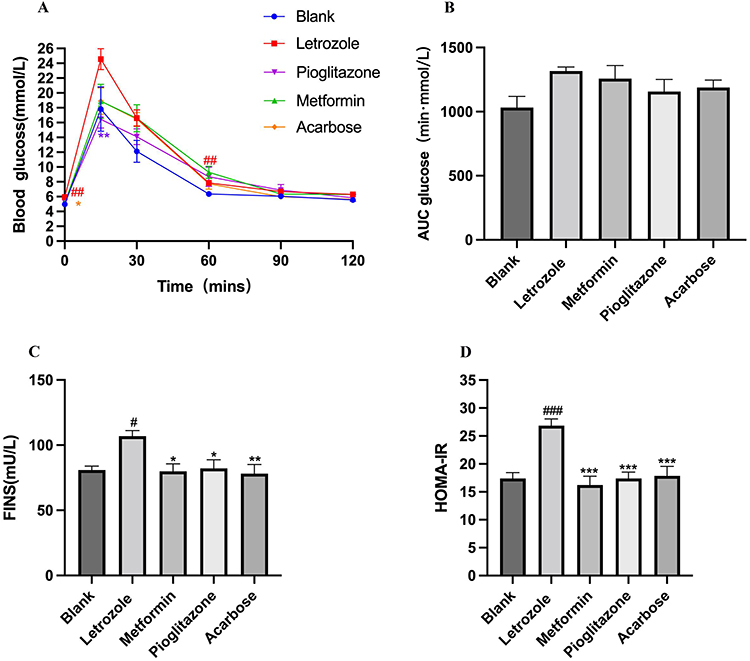 |
Figure 2 Comparison of glucose homeostasis in rats of different experimental groups. (A) Results of Intraperitoneal glucose tolerance test in each group, n=8, compared with the blank group, ##P <0.01, compared with the letrozole group, *P<0.05, **P<0.01, Values were presented as the mean±SEM (The data are non-normally distributed repeated measurements, Generalized linear estimating equation was used). (B) AUCs of rats in each group, n=8 for each group. Values were presented as the mean±SEM (Data were analyzed for statistically significant differences using one-way ANOVA). (C) FINS of rats in each group, n=8 compared with the blank group, #P <0.05, compared with the letrozole group, *P<0.05, **P<0.01, Values were presented as the mean±SEM (Data were analyzed for statistically significant differences using one-way ANOVA followed by Dunnett post hoc test). (D) HOMA-IR of rats in each group, n=8. Values were presented as the mean±SEM (Data were analyzed for statistically significant differences using one-way ANOVA followed by Tukey post hoc test) compared with the blank group, ###P<0.001, compared with letrozole group,***P<0.001. |
Metformin, Pioglitazone, and Acarbose Improve the Estrus Cycle in PCOS Rats
On Days 19–28 of the modeling period, the blank group and model group underwent vaginal exfoliation cell smears. The blank group rats changed regularly in the order of proestrus → estrus → metestrus → diestrus, and each cycle lasted 4 or 5 days (Figure 3). The model group lost the regular estrus cycle, which was manifested as a continuous diestrus (Figure 3). These results indicated that letrozole disturbs the estrus cycle in rats, suggesting an ovulation disorder.
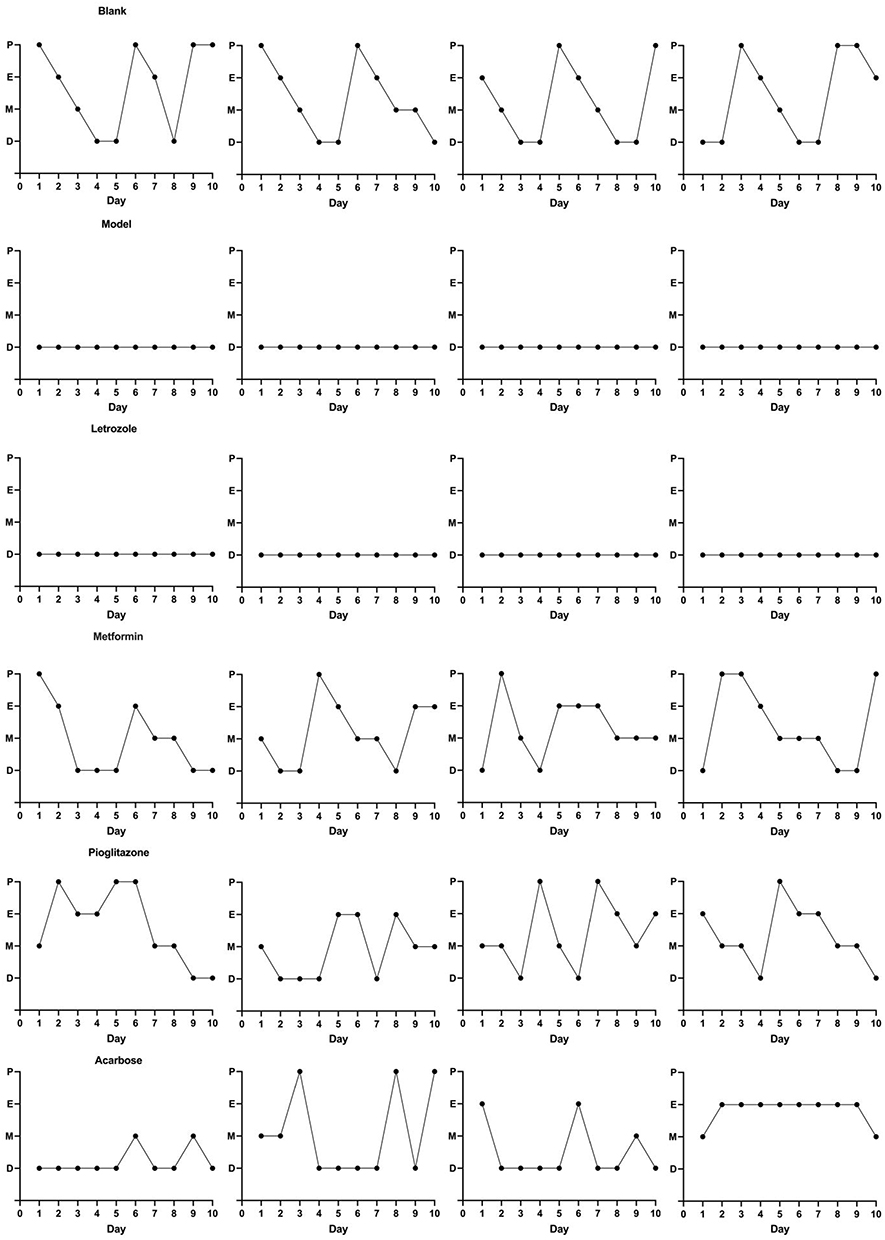 |
Figure 3 Changes of estrus cycle of rats in each group. The change of estrus cycle in the blank group showed regular changes in proestrus, estrus, metestrus and diestrus. Estrus cycle changes in model group, presenting continuous diestrus. After the drug intervention, changes of estrus cycle of rats in each group (4 rats were selected for demonstration.). |
On Day 12 of the drug intervention, vaginal smears were collected from the letrozole group, metformin group, pioglitazone group, and acarbose group. The following phenotypes were observed: the letrozole group had a continuous diestrus; the metformin group had an estrus cycle of 5–6 days; the pioglitazone group showed an improved estrus cycle in the PCOS rats with gradual appearance of proestrus, estrus and metestrus; and the acarbose group had an improved estrus cycle, but the cycle was irregular (Figure 3 and Table 1). These observations showed that metformin and pioglitazone improve the estrus cycle disorder in PCOS rats and that acarbose shows weak improvement of the estrus cycle.
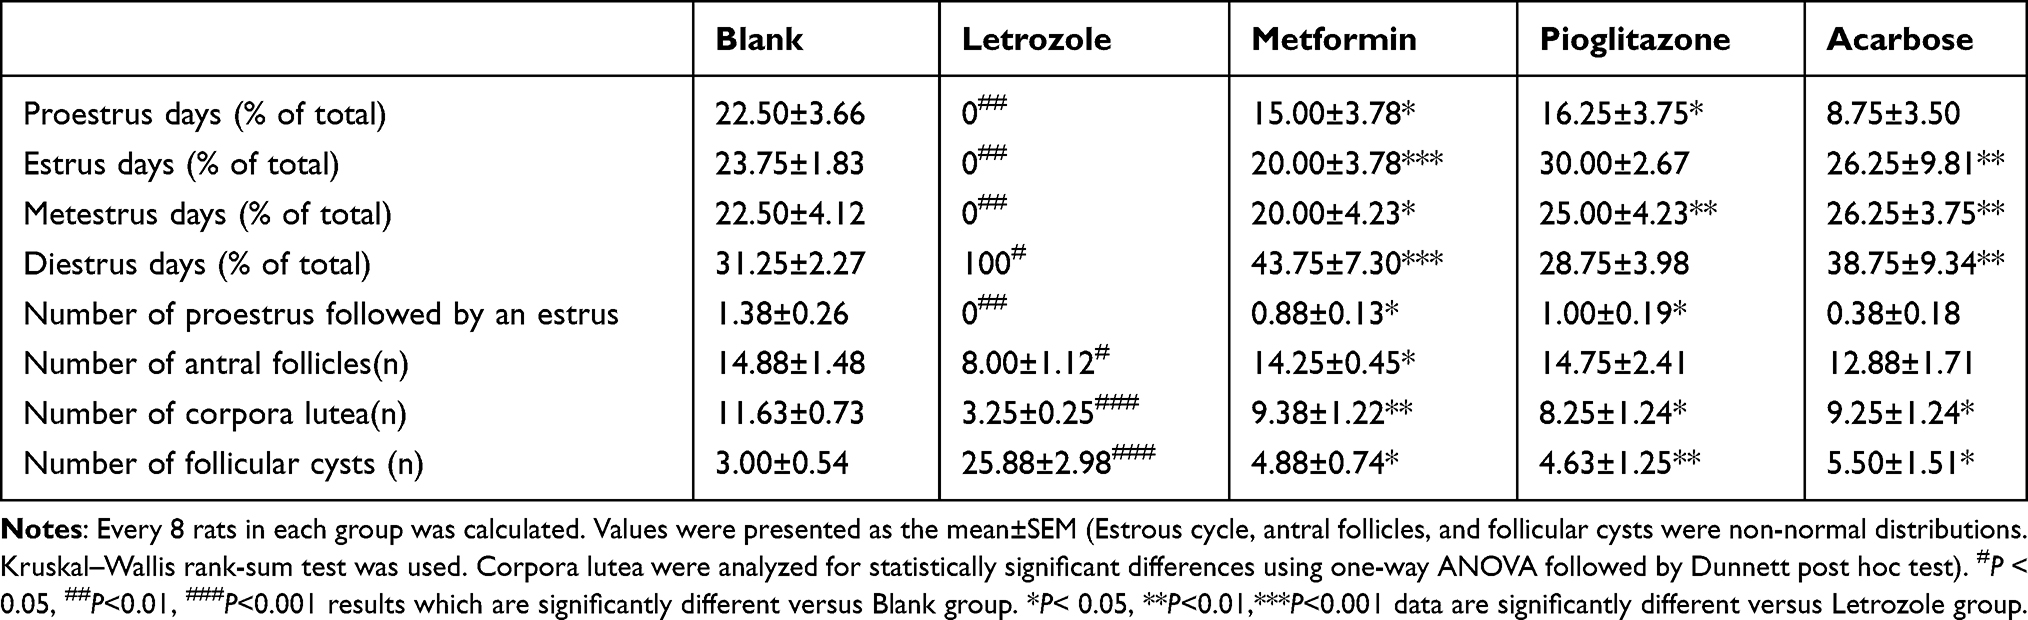 |
Table 1 Comparison of Estrous Cycle and Ovary Morphology in Each Group |
Metformin, Pioglitazone, and Acarbose Improve Ovarian Tissue Morphology and Decrease the Ovarian Index in PCOS Rats
Although the ovaries of PCOS rats showed polycystic changes, we further verified the effect of modeling by observing the morphology of ovarian tissue in 6 rats in the blank group and 12 rats in the model group. The ovarian surface of the blank group rats was smooth with a soft texture. In the blank group, all levels of the follicles were visible under the microscope, and the follicular walls were thinner (Figure 4). The ovarian surface of the model group rats was uneven with a tougher texture, and follicles of different sizes were observed. In the model group, microscopic analysis showed cystic dilated follicles with different diameters, and thecal thickening was also observed (Figure 4). In addition, combined with the estrus cycle changes, the estrus cycle of rats was a continuous diestrus in the model group, indicating establishment of a successful PCOS model.
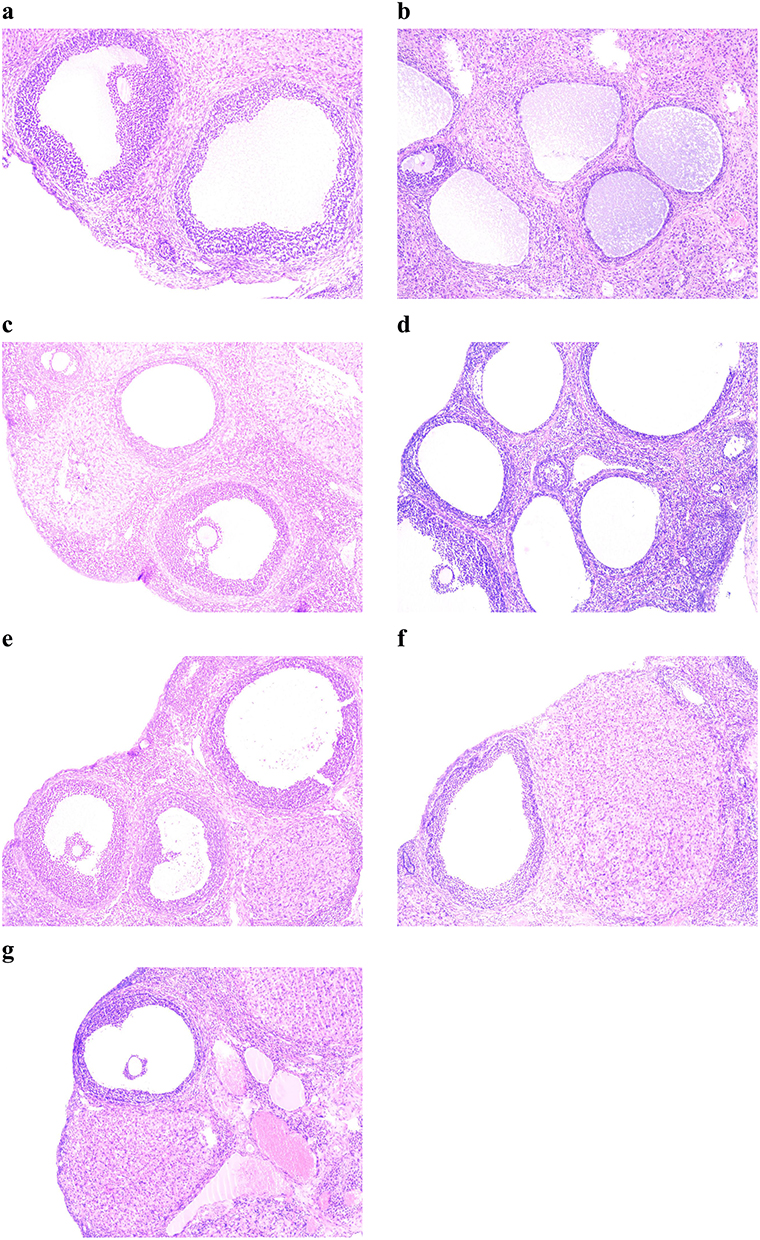 |
Figure 4 Ovary morphology of rats in each group. (a) Ovary morphology of rats in the blank group (n=6), (b) Ovary morphology of rats in the model group (n=12). After the drug intervention, morphological changes of ovarian tissue of rats in each group (100x, (c) Ovary morphology of rats in the blank group (n=8); (d) Ovary morphology of rats in the Letrozole group (n=8); (e) Ovary morphology of rats in the pioglitazone group (n=8); (f) Ovary morphology of rats in the acarbose group (n=8); (g) Ovary morphology of rats in the metformin group (n=8).). |
After the drug intervention, the ovaries of rats in each group were collected. One ovary was weighed to calculate the ovarian index, and the other ovary was stained with HE. Under a microscope, the ovaries in the letrozole group had cystic expanded follicles of different sizes. Compared to the blank group, the corpora lutea number o in the letrozole group was reduced, and the number of antral follicles was decreased (P<0.05, Table 1). After intervention, the number of antral follicles and corpora lutea of PCOS rats in the metformin group was significantly increased, and the number of cystic follicles was significantly reduced in the PCOS rats (P<0.05, Table 1). Although the pioglitazone group and acarbose group showed an increased number of corpora lutea and a reduced number of cystic follicles, there was no significant difference in the number of recovered antral follicles compared to the PCOS rats in the letrozole group (P>0.05, Table 1).
The ovarian index of rats in each group was calculated, which indicated that the ovarian index of rats in the letrozole group was significantly increased compared to the blank group (P<0.01, Figure 5). After the intervention with metformin, pioglitazone, and acarbose, there was no significant difference in the weight of rats compared to the letrozole group. The ovarian index of rats in the metformin, pioglitazone, and acarbose groups was significantly decreased compared to the letrozole group (P<0.05, Figure 5).
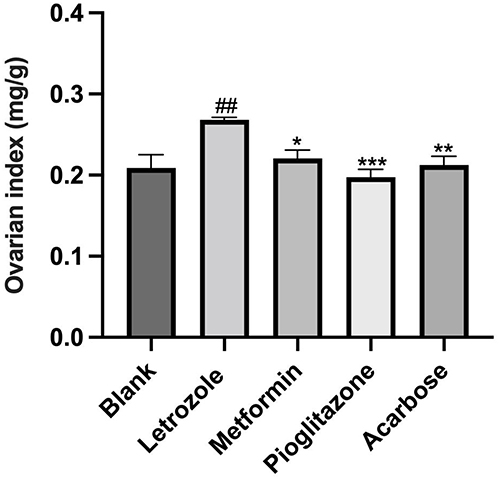 |
Figure 5 Comparison of ovarian index in each group, n=8 values were presented as the mean±SEM (Data were analyzed for statistically significant differences using one-way ANOVA followed by Dunnett post hoc test). Compared with the blank group, ##p< 0.01, compared with the Letrozole model group, *P< 0.05, **P< 0.01 ***P< 0.001. |
Effects of Serum Sex Hormones in Rats
The level of T was significantly higher in the letrozole group compared to the blank group (P <0.01, Figure 6A), which was consistent with the HA of PCOS patients. After intervention with metformin, pioglitazone, and acarbose, the T level was significantly decreased (P <0.01, Figure 6A). Compared to the blank group, the LH level in the letrozole group was significantly increased (P <0.01, Figure 6B), similar to that in PCOS patients with a high LH pulse. Intervention with metformin, pioglitazone, and acarbose reduced the level of LH (P <0.01, Figure 6B). In addition, the E2 level was higher in the letrozole group compared to the blank group, but there was no significant difference (Figure 6C). The levels of FSH and P were not significantly different among these groups (Figure 6D and E).
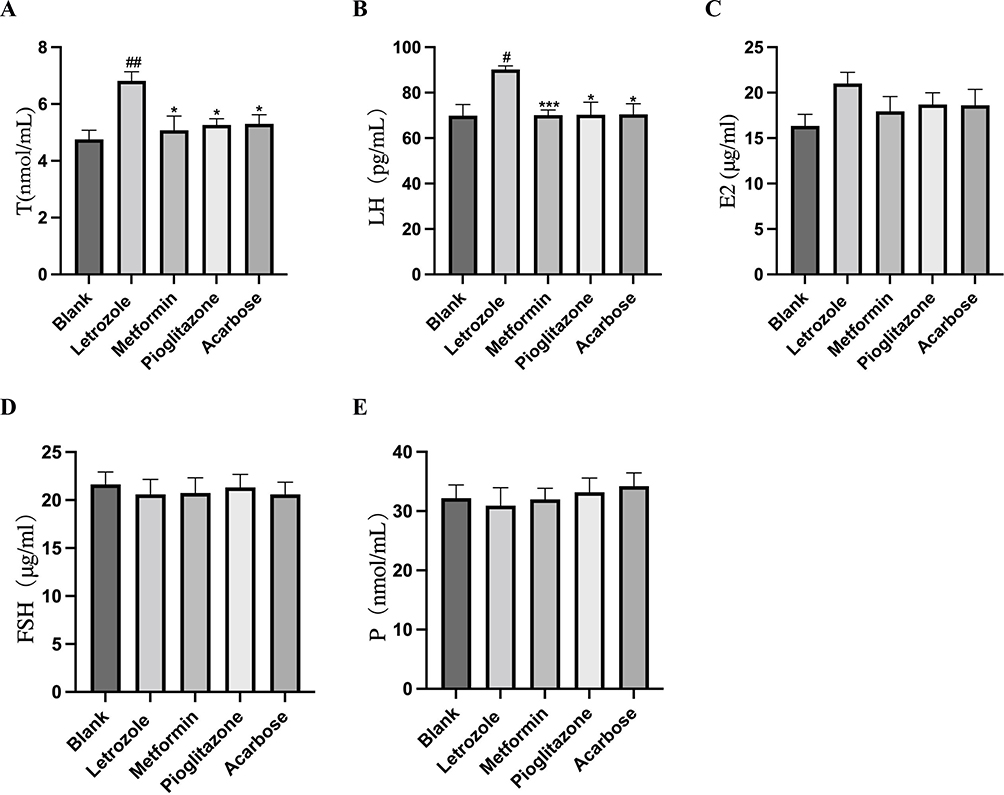 |
Figure 6 Comparison of sex hormone levels in each group, n=8 values were presented as the mean±SEM. (A) Testosterone level of rats in each group (Data were analyzed for statistically significant differences using one-way ANOVA followed by Tukey post hoc test); (B) Luteinizing hormone level of rats in each group (Data were analyzed for statistically significant differences using one-way ANOVA followed by Dunnett post hoc test); (C) estradiol level of rats in each group (Data were analyzed for statistically significant differences using one-way ANOVA); (D) follicle stimulating hormone level of rats in each group (Data were analyzed for statistically significant differences using one-way ANOVA); (E) progesterone level of rats in each group (Date were non-normal distribution, Kruskal–Wallis rank-sum test was used). Compared to the blank group, #P < 0.05, ##P <0.01, compared with letrozole group,* P <0.05,*** P <0.001. |
Metformin, Pioglitazone, and Acarbose Improve kiss1 Gene Expression in the Hypothalamus of PCOS Rat Models
Kiss-1 is mainly expressed in the hypothalamic ARC nucleus of rats. To explore the change of hypothalamic Kiss1 expression and the number of Kiss1-positive neurons, we detected the hypothalamus using fluorescence in situ hybridization and IHC methods respectively. We observed that the Kiss1 mRNA levels and the number of Kiss1-positive neurons in the ARC of the PCOS rats in the letrozole group was significantly increased compared to the blank group (Figures 7 and 8). In the metformin group, pioglitazone group, and acarbose group, the Kiss1 mRNA levels and the number of Kiss1-positive neurons were decreased compared to the letrozole group (Figures 7 and 8).
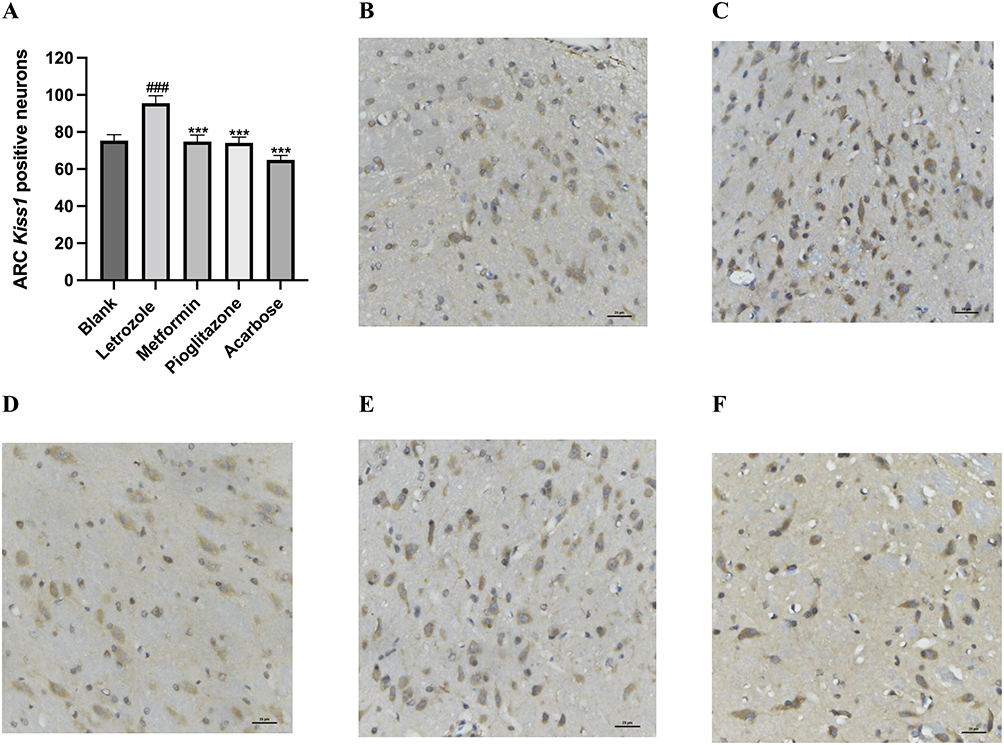 |
Figure 7 Comparison of kiss-1 positive neurons in hypothalamic arcuate nucleus of rats in each group. (A) Number of Kiss1-positive neurons in the ARC. n=8 values were presented as the mean±SEM (Data were analyzed for statistically significant differences using one-way ANOVA followed by Tukey post hoc test). Compared to the blank group, ###P< 0.001, compared with letrozole model group,***P<0.001. (B-E) Representative photographs of Kiss1-positive neurons in ARC (The brownish-yellow granules were positive for Kiss1, expressed in the cell membrane and cytoplasm); (B) Blank group (400x), (C) Letrozole group (400x), (D) Metformin group (400x), (E) Pioglitazone group (400x), (F) Acarbose group (400x). |
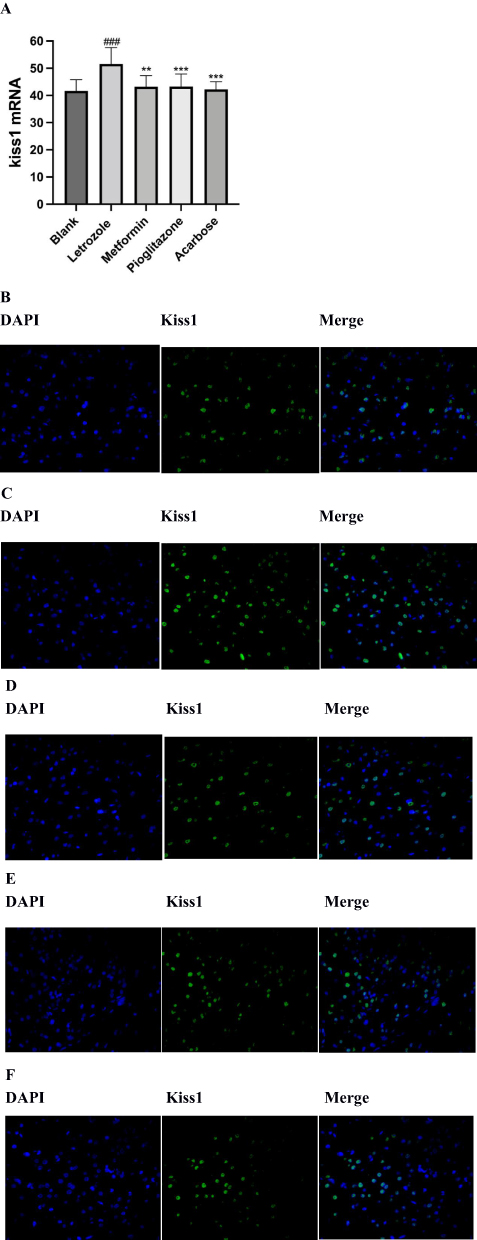 |
Figure 8 Comparison of kiss-1 mRNA-expressing in hypothalamic arcuate nucleus of rats in each group. (A) Comparison of Kiss1 mRNA-expressing in ARC, n=8 values were presented as the mean±SEM (Mean optical density analysis of sections was performed using ImageJ, and statistical analysis was performed using the Kruskal–Wallis rank sum test because the data were non-normally distributed). Compared with the blank group, ###P< 0.001, compared with letrozole model group,**P<0.01,***P<0.001. (B-E) Expression of cytosolic markers DAPI (blue fluorescence) and KiSS1 mRNA (green fluorescence) in the ARC; (B) Blank group (400x), (C) Letrozole group (400x), (D) Metformin group (400x), (E) Pioglitazone group (400x), (F) Acarbose group (400x). |
Discussion
Patients with PCOS often have reproductive dysfunction or endocrine and metabolic disorders as the first manifestation, and patients with PCOS have a greatly increased risk of endometrial cancer, cardiovascular diseases, and psychological diseases.21 Due to the complex pathogenesis and different clinical phenotypes of PCOS, PCOS treatment mainly focuses on improving clinical symptoms. However, PCOS treatment should be adjusted according to the individual needs of patients. Currently, the main treatment principles include lifestyle intervention, reducing androgen levels, promoting ovulation, and improving insulin resistance. The benefits of improving insulin resistance are substantial. Metformin, as a commonly used hypoglycemic drug, reduces androgen in PCOS patients, improves insulin resistance, and promotes ovulation. However, the mechanisms of these actions are still unclear.22 Although pioglitazone and acarbose are first-line hypoglycemic drugs, they are rarely used in the treatment of PCOS.
In this experiment, we successfully constructed PCOS rats with phenotypes of polycystic ovarian changes, disturbed motility cycle, weight gain, insulin resistance, and hyperandrogenemia using letrozole by continuous gavage. PCOS rats had increased ovarian index, significantly reduced antral follicles and corpus luteum, and replaced by cystic follicles of various sizes. The estrus cycle of PCOS rats was also the persistent diestrus cycle in PCOS rats indicates persistent anovulation, and metformin, pioglitazone, and acarbose may improve this reproductive disorder to varying degrees. Previous studies have shown that insulin resistance and hyperandrogenemia interact in PCOS, and that insulin promotes androgen secretion from the adrenal glands and regulates LH secretion.23–25 The normal ovarian function requires a certain level of androgens to be maintained, and excessive androgen levels can instead disrupt the balance required for normal follicular development, thus altering early follicular growth and function.26 Similarly, hyperinsulinemia reduces the ovulation rate of large follicles and thus reduces the fertilization of oocytes.27 We suggest that hypoglycemic drugs can reduce insulin and androgen levels by improving insulin resistance in PCOS rats, resulting in a significant reduction in cystic follicles and a return to some regularity in the estrous cycle in PCOS rats.
Clinically, LH and LH/FSH are elevated in patients with PCOS, and kiss-1 plays an important role in this process. Kiss-1 has been demonstrated to stimulate the HPG axis by activating GnRH neurons in the hypothalamus,28 which interferes with ovarian function by increasing LH secretion and contributing to excessive androgen secretion in ovarian follicular endothelial cells, ultimately impeding follicular growth and reducing the chance of ovulation.29 Several clinical studies have shown elevated blood kisspeptin concentrations in PCOS patients compared to normal subjects.30,31 Moreover, the levels of kiss-1 in the hypothalamic ARC vary in previously developed animal models of PCOS. Brown et al32 reported reduced Kiss1 mRNA in the hypothalamus of PCOS rats constructed with a subcutaneous implant of dihydrotestosterone. Matsuzaki et al33 used letrozole subcutaneous implants to construct PCOS rats with increased Kiss-1 expression in the posterior hypothalamus. Both the previous studies and the present study successfully constructed PCOS rats with reproductive metabolism disorders similar to PCOS patients using letrozole induced by continuous gavage, resulting in kiss-1 neurons in the arcuate nucleus of the hypothalamus of PCOS rats. We hypothesized that the Kiss-1-GnRH-gonadotropin system may be involved in the pathogenesis of PCOS. Previous studies have reported no difference in GnRH mRNA levels between letrozole-treated women and controls.34 Further suggesting that the possible effect occurs upstream of GnRH neurons. In addition, upstream of the arcuate nucleus, kiss-1 neurons are important in the GnRH pulse generation mechanism, and higher levels of kiss-1 have a stimulatory effect on GnRH pulse output.
There is a clear link between metabolism and reproduction, and suppression of reproductive function is associated with altered energy homeostasis. Previous studies have found that hypothalamic kiss-1 mRNA expression is suppressed during energy deficiency,35,36 suggesting that hypothalamic kiss-1/Kiss1r may be involved in the regulation of energy metabolism. Kiss-1 neurons are key integrators of peripheral sex hormones and metabolic signals,37 such as leptin, insulin, or growth hormone-releasing peptide, which can act on or upstream of Kiss-1 neurons.38 Among them, insulin is one of the main peripheral signals that transmit information about the body’s energy status to the hypothalamus. Insulin cross the blood brain barrier, and stimulate the kiss-1 neurons in the hypothalamic ARC to secrete kisspeptin,39 In PCOS patients, of whom the vast majority has glucose metabolism disorders, the relationship between kiss-1 and glucose homeostasis has not been elucidated. In the present study, treatment of PCOS rats with glucose-lowering drugs significantly improved the reproductive disorders and IR in PCOS rats. Of interest, the kiss-1 neurons in the hypothalamic ARC of rats and the Kiss-1 mRNA levels in the metformin, pioglitazone, and acarbose groups were reduced compared to the letrozole group. Previous clinical studies have focused on the correlation between peripheral blood kisspeptin levels and insulin resistance in patients with PCOS. Nyagolova et al40 reported that kisspeptin levels are positively correlated with HOMA-IR and fasting insulin concentrations in obese women with PCOS. Combined with the results of our experiment, we found that hypoglycemic drugs can reduce the expression of kiss-1 in the hypothalamus ARC of PCOS rats, suggesting that there is a disorder of the insulin-kiss 1-GnRH pathway in the letrozole-induced PCOS rat model and that hypoglycemic drugs may be able to lessen such a disorder, which provides a new direction of research on the central mechanism of the hypoglycemic drugs treatment of PCOS patients, and that the neuroendocrine axis, which is involved in the constitution of Kiss-1, maybe a new locus of the treatment of PCOS.
Conclusion
The present study demonstrated that Kiss-1 expression in the hypothalamus may play an important role in the pathogenesis of PCOS. Metformin, pioglitazone, and acarbose reduce Kiss-1 expression by improving insulin resistance, thus improving reproductive and metabolic disorders in PCOS rats. Further studies on the interaction between the kiss 1/Kiss1r system and insulin resistance are needed to provide a solid foundation for the treatment of PCOS patients and a new direction for the treatment of PCOS.
Data Sharing Statement
The datasets used and/or analysed during the current study are available from the corresponding author on reasonable request.
Ethics Approval and Consent to Participate
All animal procedures were reviewed and approved by the Institutional Animal Care and Use Committee of Anhui Medical University in compliance with the National Institutes of Health Guide for the Care and Use of Laboratory Animals. The study was carried out in compliance with the ARRIVE guidelines.
Author Contributions
All authors made a significant contribution to the work reported, whether that is in the conception, study design, execution, acquisition of data, analysis and interpretation, or in all these areas; took part in drafting, revising or critically reviewing the article; gave final approval of the version to be published; have agreed on the journal to which the article has been submitted; and agree to be accountable for all aspects of the work.
Funding
No funding was received for conducting this study.
Disclosure
Pingping Zheng, Yating Lu and You Tang are co-first authors for this study. The authors declare that they have no competing interests for this work.
References
1. Escobar-Morreale HF. Polycystic ovary syndrome: definition, aetiology, diagnosis and treatment. Nat Rev Endocrinol. 2018;14(5):270–284. doi:10.1038/nrendo.2018.24
2. Zeng X, Xie Y, Liu Y, Long S, Mo Z. Polycystic ovarian syndrome: correlation between hyperandrogenism, insulin resistance and obesity. Clinica Chimica Acta. 2020;502:214–221. doi:10.1016/j.cca.2019.11.003
3. March WA, Moore VM, Willson KJ, Phillips DIW, Norman RJ, Davies MJ. The prevalence of polycystic ovary syndrome in a community sample assessed under contrasting diagnostic criteria. Human Reproduction. 2010;25(2):544–551. doi:10.1093/humrep/dep399
4. Morley LC, Tang T, Yasmin E, Norman RJ, Balen AH. Insulin‐sensitising drugs (metformin, rosiglitazone, pioglitazone, D‐chiro‐inositol) for women with polycystic ovary syndrome, oligo amenorrhoea and subfertility. Cochrane Database Syst Rev. 2017;2017:CD003053.
5. Xu Y, Wu Y, Huang Q. Comparison of the effect between pioglitazone and metformin in treating patients with PCOS:a meta-analysis. Arch Gynecol Obstet. 2017;296(4):661–677. doi:10.1007/s00404-017-4480-z
6. Abdalla MA, Shah N, Deshmukh H, et al. Impact of pharmacological interventions on insulin resistance in women with polycystic ovary syndrome: a systematic review and meta-analysis of randomized controlled trials. Clin Endocrinol. 2022;96:371
7. Tuğrul S, Kutlu T, Pekin O, Bağlam E, Kıyak H, Oral Ö. Clinical, endocrine, and metabolic effects of acarbose, a α-glucosidase inhibitor, in overweight and nonoverweight patients with polycystic ovarian syndrome. Fertil Steril. 2008;90(4):1144–1148. doi:10.1016/j.fertnstert.2007.07.1326
8. Penna IAA, Canella PRB, Reis RM, Silva de Sá MF, Ferriani RA. Acarbose in obese patients with polycystic ovarian syndrome: a double-blind, randomized, placebo-controlled study. Human Reproduction. 2005;20(9):2396–2401. doi:10.1093/humrep/dei104
9. Plant TM. The hypothalamo-pituitary-gonadal axis. J Endocrinol. 2015;226(2):T41–54. doi:10.1530/JOE-15-0113
10. Qian Z, Yao Q, Zhou G, Ren Q, Hu R. Advances in Neuroendocrine Mechanism of Polycystic Ovary Syndrome. J Int Reprod Health/Fam Plan. 2021;40:79–83.
11. Esparza LA, Schafer D, Ho BS, Thackray VG, Kauffman AS. Hyperactive LH Pulses and Elevated Kisspeptin and NKB Gene Expression in the Arcuate Nucleus of a PCOS Mouse Model. Endocrinology. 2020;161(4):bqaa018. doi:10.1210/endocr/bqaa018
12. Abbara A, Eng PC, Phylactou M, et al. Kisspeptin receptor agonist has therapeutic potential for female reproductive disorders. J Clin Invest. 2020;130(12):6739–6753. doi:10.1172/JCI139681
13. Araújo BS, Baracat MCP, Dos Santos Simões R, et al. Kisspeptin Influence on Polycystic Ovary Syndrome—a Mini Review. Reprod Sci. 2020;27:455–460. doi:10.1007/s43032-019-00085-6
14. Izzi-Engbeaya C, Hill TG, Bowe JE. Kisspeptin and Glucose Homeostasis. Semin Reprod Med. 2019;37(03):141–146. doi:10.1055/s-0039-3400242
15. Harter CJL, Kavanagh GS, Smith JT. The role of kisspeptin neurons in reproduction and metabolism. J Endocrinol Bioscientifica Ltd. 2018;238:R173–83.
16. Kafali H, Iriadam M, Ozardalı I, Demir N. Letrozole-induced polycystic ovaries in the rat: a new model for cystic ovarian disease. Arch Med Res. 2004;35(2):103–108. doi:10.1016/j.arcmed.2003.10.005
17. Tohma YA, Onalan G, Tepeoglu M, et al. Phosphodiesterase 4 inhibitor plus metformin is superior to metformin alone for the treatment of polycystic ovary syndrome: a rat model study. Exp Ther Med. 2019;17(5):4013–4022. doi:10.3892/etm.2019.7428
18. Shawky NM, Shehatou GSG, Suddek GM, Gameil NM. Comparison of the effects of sulforaphane and pioglitazone on insulin resistance and associated dyslipidemia, hepatosteatosis, and endothelial dysfunction in fructose-fed rats. Environ Toxicol Pharmacol. 2019;66:43–54. doi:10.1016/j.etap.2018.12.008
19. Zhang Q, Xiao X, Li M, et al. Acarbose Reduces Blood Glucose by Activating miR-10a-5p and miR-664 in Diabetic Rats. PLoS One. 2013;8(11):e79697. doi:10.1371/journal.pone.0079697
20. Higo S, Aikawa S, Iijima N, Ozawa H. Rapid modulation of hypothalamic Kiss1 levels by the suckling stimulus in the lactating rat. J Endocrinol. 2015;227(2):105 15. doi:10.1530/JOE-15-0143
21. Patel S. Polycystic ovary syndrome (PCOS), an inflammatory, systemic, lifestyle endocrinopathy. J Steroid Biochem Mol Biol. 2018;182:27–36. doi:10.1016/j.jsbmb.2018.04.008
22. Patel R, Shah G. Insulin Sensitizers Modulate GnRH Receptor Expression in PCOS Rats. Arch Med Res. 2018;49(3):154–163. doi:10.1016/j.arcmed.2018.08.001
23. Unluhizarci K, Karaca Z, Kelestimur F. Role of insulin and insulin resistance in androgen excess disorders. World J Diabetes. 2021;12(5):616–629. doi:10.4239/wjd.v12.i5.616
24. Tosi F, Negri C, Brun E, et al. Insulin enhances ACTH-stimulated androgen and glucocorticoid metabolism in hyperandrogenic women. Eur J Endocrinol. 2011;164(2):197–203. doi:10.1530/EJE-10-0782
25. Diamanti-Kandarakis E, Dunaif A. Insulin resistance and the polycystic ovary syndrome revisited: an update on mechanisms and implications. Endocr Rev. 2012;33(6):981–1030. doi:10.1210/er.2011-1034
26. Bertoldo MJ, Caldwell ASL, Riepsamen AH, et al. A Hyperandrogenic Environment Causes Intrinsic Defects That Are Detrimental to Follicular Dynamics in a PCOS Mouse Model. Endocrinology. 2019;160(3):699–715. doi:10.1210/en.2018-00966
27. Cadagan D, Khan R, Amer S. Thecal cell sensitivity to luteinizing hormone and insulin in polycystic ovarian syndrome. Reprod Biol. 2016;16(1):53–60. doi:10.1016/j.repbio.2015.12.006
28. Rønnekleiv OK, Qiu J, Kelly MJ. Hypothalamic Kisspeptin Neurons and the Control of Homeostasis. Endocrinology. 2022;163(2):bqab253. doi:10.1210/endocr/bqab253
29. Azziz R, Carmina E, Chen Z, et al. Polycystic ovary syndrome. Nat Rev Dis Primers Nature Publishing Group. 2016;2:1–18.
30. Zhang Y, Sun N. Research progress of kisspeptin in female reproductive endocrine and assisted reproductive techniques. Acta Physiologica Sinica. 2020;72:125–132.
31. Varikasuvu SR, Prasad VS, Vamshika V, Satyanarayana M, Panga JR. Circulatory metastin/kisspeptin-1 in polycystic ovary syndrome: a systematic review and meta-analysis with diagnostic test accuracy. Reprod Biomed Online. 2019;39(4):685–697. doi:10.1016/j.rbmo.2019.04.018
32. Brown RE, Wilkinson DA, Imran SA, Caraty A, Wilkinson M. Hypothalamic kiss1 mRNA and kisspeptin immunoreactivity are reduced in a rat model of polycystic ovary syndrome (PCOS). Brain Res. 2012;1467:1–9. doi:10.1016/j.brainres.2012.05.049
33. Matsuzaki T, Tungalagsuvd A, Iwasa T, et al. Kisspeptin mRNA expression is increased in the posterior hypothalamus in the rat model of polycystic ovary syndrome. Endocr J. 2017;64(1):7–14. doi:10.1507/endocrj.EJ16-0282
34. Kauffman AS, Thackray VG, Ryan GE, et al. A novel letrozole model recapitulates both the reproductive and metabolic phenotypes of polycystic ovary syndrome in female mice. Biol Reprod. 2015;93(3):69. doi:10.1095/biolreprod.115.131631
35. Iwasa T, Minato S, Imaizumi J, et al. Effects of low energy availability on female reproductive function. Reprod Med Biol. 2021;21(1):e12414. doi:10.1002/rmb2.12414
36. Ozawa H. Kisspeptin neurons as an integration center of reproductive regulation: observation of reproductive function based on a new concept of reproductive regulatory nervous system. Reprod Med Biol. 2021;21(1):e12419. doi:10.1002/rmb2.12419
37. Roa J, Barroso A, Ruiz-Pino F, et al. Metabolic regulation of female puberty via hypothalamic AMPK-kisspeptin signaling. Proc Natl Acad Sci U S A. 2018;115(45):E10758–E10767. doi:10.1073/pnas.1802053115
38. Navarro VM. Metabolic regulation of kisspeptin - The link between energy balance and reproduction. Nat Rev Endocrinol. 2020;16(8):407–420. doi:10.1038/s41574-020-0363-7
39. Li X, Liang C, Yan Y. Novel Insight into the Role of the Kiss1/GPR54 System in Energy Metabolism in Major Metabolic Organs. Cells. 2022;11(19):3148. doi:10.3390/cells11193148
40. Nyagolova P, Mitkov M, Orbetzova M, et al. Kisspeptin and galanin-like peptide (GALP) relationship in women with polycystic ovary syndrome (PCOS). Gynecol Endocrinol. 2016;32:136. doi:10.3109/09513590.2015.1092515
 © 2023 The Author(s). This work is published and licensed by Dove Medical Press Limited. The
full terms of this license are available at https://www.dovepress.com/terms
and incorporate the Creative Commons Attribution
- Non Commercial (unported, 3.0) License.
By accessing the work you hereby accept the Terms. Non-commercial uses of the work are permitted
without any further permission from Dove Medical Press Limited, provided the work is properly
attributed. For permission for commercial use of this work, please see paragraphs 4.2 and 5 of our Terms.
© 2023 The Author(s). This work is published and licensed by Dove Medical Press Limited. The
full terms of this license are available at https://www.dovepress.com/terms
and incorporate the Creative Commons Attribution
- Non Commercial (unported, 3.0) License.
By accessing the work you hereby accept the Terms. Non-commercial uses of the work are permitted
without any further permission from Dove Medical Press Limited, provided the work is properly
attributed. For permission for commercial use of this work, please see paragraphs 4.2 and 5 of our Terms.