")
Back to Journals » Diabetes, Metabolic Syndrome and Obesity » Volume 16
Effect of Benaglutide on Gut Microbiota and Fecal Metabolites in Patients with Type 2 Diabetes Mellitus
Authors Han CY, Ye XM, Lu JP, Jin HY, Wang P, Xu WW, Zhang M
Received 23 May 2023
Accepted for publication 22 July 2023
Published 7 August 2023 Volume 2023:16 Pages 2329—2344
DOI https://doi.org/10.2147/DMSO.S418757
Checked for plagiarism Yes
Review by Single anonymous peer review
Peer reviewer comments 2
Editor who approved publication: Prof. Dr. Juei-Tang Cheng
Chen-Yu Han, Xiao-Mei Ye, Jia-Ping Lu, Hai-Ying Jin, Ping Wang, Wei-Wei Xu, Min Zhang
Department of Endocrinology, Qingpu Branch of Zhongshan Hospital Affiliated to Fudan University, Shanghai, 201700, People’s Republic of China
Correspondence: Min Zhang, Department of Endocrinology, Qingpu Branch of Zhongshan Hospital Affiliated to Fudan University, No. 1158 of Gongyuan Road, Qingpu District, Shanghai, 201700, People’s Republic of China, Tel +86 18116016187, Fax +86 021-69719190, Email [email protected]
Objective: Benaglutide is a glucagon-like peptide-1 receptor agonist (GLP-1RA) that has been approved in the treatment of type 2 diabetes mellitus (T2DM). It is known to lead to significant weight loss, and it is hypothesized that changes in gut microbiota may play a significant role in such weight loss. However, it is unclear how gut microbiota and metabolites change as a result of benaglutide treatment.
Methods: Healthy participants and patients with T2DM were included in this study. They received differentiated treatments, and stool specimens were collected separately. These stool specimens were subjected to 16S ribosomal RNA amplicon and metagenomic sequencing to create fecal metabolomic profiles. The diversity of gut microbiota and metabolic products in the stools of each participant was analyzed.
Results: The data showed that Faecalibacterium prausnitzii was abundant in the gut microbiota of the control group, which was entirely made up of healthy individuals; however, it showed a statistically significant decrease in patients with T2DM treated with metformin alone, while no significant decrease was observed in patients treated with metformin combined with benaglutide. A metagenomic analysis revealed that benaglutide could improve the fecal microbiota diversity in patients with T2DM. Furthermore, there was a statistically significant correlation between the changes in the metabolites of patients with T2DM and the changes in their gut microbiota (including F. prausnitzii) after treatment with metformin and benaglutide.
Conclusion: These findings suggest that the weight-reducing effect of benaglutide is attributed to its ability to normalize the gut microbiota of patients with T2DM, particularly by increasing the abundance of F. prausnitzii.
Keywords: benaglutide, gut microbiota, metabolites, type 2 diabetes mellitus, T2DM
Introduction
Type 2 diabetes mellitus (T2DM) is the most common form of diabetes, affecting about 90% of diabetics around the world. Furthermore, diabetes is significantly correlated with obesity. Due to the sharp rise in their incidence, it is critical to understand the underlying mechanisms of obesity and diabetes. There is mounting evidence that microbiota in the gut play a crucial role in the development of diabetes and obesity.1–9
Benaglutide is a recombinant human glucagon-like peptide-1 (GLP-1). Randomized controlled trials (RCTs) have shown that benaglutide can effectively and safely reduce HbA1c (glycated hemoglobin or hemoglobin A1c), fasting plasma glucose (FPG), and postprandial glucose (PPG) in patients with T2DM. Furthermore, it can effectively reduce weight in obese patients with T2DM. Therefore, benaglutide was approved by the Chinese National Medical Products Administration for the treatment of T2DM in December 2016, and was recommended for the treatment of T2DM in the Chinese Guidelines for the Prevention and Treatment of Type 2 Diabetes Mellitus (2017 edition). So far, the pharmacological effects of benaglutide are believed to target the hypothalamus and gastrointestinal tract.10–13 However, the role of benaglutide in the gut microbiota and metabolites remains unclear.
In this study, we analyzed the diversity of gut microbiota and fecal metabolites in healthy participants, patients with T2DM treated with metformin, and patients with T2DM treated with metformin combined with benaglutide. According to the data, Faecalibacterium prausnitzii predominated among other gut microbiota in healthy participants, but exhibited a significant decrease in quantity in patients with T2DM treated with metformin alone, while no significant decrease in quantity was observed in patients treated with metformin and benaglutide. Benaglutide improves stool microbiota diversity in patients with T2DM. Additionally, changes in gut microbiota in patients are linked to changes in intestinal metabolites.
Methods
Ethics Statement
The study was approved by the Ethics Committee of the Qingpu Branch of Zhongshan Hospital Affiliated to Fudan University and was conducted in accordance with the Declaration of Helsinki. All participants signed an informed consent form before they were included in this study.
Participants and Grouping
We enrolled 1800 participants with T2DM and 500 healthy participants in this study. Their grouping was based on their differentiated interventions. Group A: The control group made up entirely of healthy participants; group B: Patients with T2DM who received metformin alone (2000 mg, qd [quaque die]); group C: Patients with T2DM who received metformin (2000 mg, qd) combined with benaglutide (0.2 mg, tid [three times a day]); group D: obese patients with T2DM who received metformin (2000 mg, qd) combined with benaglutide (0.2 mg, tid).
Fecal Sample Collection, Microbial DNA Extraction, and Metabolite Extraction
Fecal samples were harvested using a cotton swab and stored in a sterile conical tube. The fecal samples were immediately frozen at −80 °C until further analysis. The fecal microbial DNA was extracted using the DNA E.Z.N. A ® Stool DNA Kit (Omega Bio-Tek, Norcross, GA, United States) according to the manufacturer’s instructions. In addition, total DNA was quantified using a spectrophotometer (NanoDrop 2000 UV; Thermo Fisher Scientific, Waltham, MA, United States) with 1% agarose gel electrophoresis.
The extraction of fecal metabolites was carried out in accordance with the previous description. In summary, 50 mg fecal samples were mixed with 400 µL of an ice-cold methanol/water (4:1, v/v) solution and stored at −20 °C. Subsequently, the mixture was homogenized for 6 minutes using a mechanical disruptor (FastPrep-24 TM 5G, MP Biomedicals Co., Ltd. Shanghai, China) at 60 Hz. After the completion of 15-minute vortex and three rounds of 10-minute sonication, the homogenate was placed at −20 °C for 30 minutes to precipitate the proteins. To harvest the supernatant for liquid chromatography–mass spectrometry (LC-MS) analysis, the supernatant was centrifuged at 13,000g at 4 °C for 15 minutes and filtered through a 0.22-µm membrane.
16S Ribosomal RNA Gene Sequencing Analysis
Amplification of the V3 and V4 hypervariable regions of the microbial 16S rRNA gene was performed with primers 338F (5’- ACTCCTACGGGAGGCAGCAG-3’) and 806R (5’- GGACTACHVGGGTWTCTAAT-3’). The amplified products were purified using the AxyPrep DNA Gel Extraction Kit (Axygen Biosciences, Union City, CA, USA) and quantified using QuantiFluorTM-ST (Promega, USA) after being determined by 2% agarose gel electrophoresis. Purification and quantification were carried out in accordance with the manufacturer’s protocols. The paired-end sequencing libraries were constructed by Majorbio Bio-Pharm Technology Co. Ltd. (Shanghai, China). The purified amplicons were then sequenced in equimolar amounts on an Illumina MiSeq platform (Illumina, San Diego, CA, USA) for paired-end reads of 300 bp. Sequencing was also performed at Majorbio Bio-Pharm Technology Co. Ltd. (Shanghai, China) in accordance with standard protocols.
The quality filtration of raw FASTQ files using Trimmomatic and merging with FLASH were carried out following these criteria:1) The reads that received an average quality score < 20 over a 50-bp sliding window at any site were truncated; 2) Sequences containing overlaps (> 10 bp) were merged according to mismatched overlaps ≤ 2 bp; 3) the reads containing ambiguous bases were eliminated. Operational taxonomic unit (OTU) clustering with a 97% similarity cut-off was performed using UPARSE (version 7.1 http://drive5.com/uparse) with a novel “greedy” algorithm; this algorithm enables simultaneously chimera-filtering and OTU-clustering. Subsequently, representative OTU sequences were compared to the reference database to generate the taxonomical classification.
Metagenomic Sequencing
The TruSeqTM DNA Sample Prep Kit with Covaris M220 (Gene Company Limited, China) was used to fragment microbial DNA to an average size of approximately 300 bp as directed by the manufacturer to construct a paired-end library. Furthermore, metagenomic sequencing was performed using an Illumina HiSeq-4000 sequencing platform (Illumina Inc., San Diego, CA, USA). After discarding raw sequence reads with a quality score < 20 and a length < 50 bp, the clean reads were assembled using SOAP denovo software to obtain contigs for prediction and annotation. Open reading frames (ORFs) obtained from each sample were predicted using MetaGene (http://metagene.nig.ac.jp) Eggnog database (version 4.5) was used to cluster orthologous groups of proteins (COG) for annotation of ORFs through BLASTP (BLAST version 2.2.28+) with an e-value cutoff of 1e-5. Then, KEGG pathways were annotated by a BLAST search (Version 2.2.28+) against the KEGG database (http://www.genome.jp) based on an optimized e-value cutoff of 1e-5.
Fecal Metabolic Analysis
We transferred 100 µL of each fecal sample into centrifuge tubes after being thawed at room temperature. The mixture was then mixed with 300 µL of methanol and 10 µL of 3.0 mg/mL DL-o-chlorophenylalanine. Following that, a 30-second vortex and centrifugation at 12,000 rpm for 15 min at 4 °C were performed successively. Subsequently, 200 µL of the supernatant was transferred for LC-MS analysis. A preheated hyper gold C18 column was used for chromatographic separation. A prepared sample of 10 µL was then injected into the automatic sampler and kept at 4 °C throughout the analysis. During the analysis, samples were eluted using a mobile phase for positive ion mode (ESI+) and negative ion mode (ESI-), in which solvent A was composed of water and 5% acetonitrile with 0.1% formic acid, and solvent B was composed of acetonitrile with 0.1% formic acid. The flow rate was kept at 0.35 mL/min and the elution gradients of mobile phase (A: B) were set as follows: 100%:0% for 0–1.5 min, 80%:20% at 1.5 min, and 0%:100% at 9.5 min, followed by 3 min of re-equilibration. The ion source temperature was set at 300 °C, and the capillary temperature was set at 350 °C. The flow rates of sheath gas, aux gas, and sweep gas were 45 arb, 15 arb, and 1 arb, respectively. The spray voltage was set at 3.0 kV and 3.2 kV for the ESI+ and ESI- modes, respectively. The S-Lens RF level was set at 60%. Samples were analyzed in a random order to avoid the negative influence of signal fluctuation on instrument detection. In addition, a quality control (QC) sample was injected at regular intervals throughout the analysis, to evaluate the stability of the system and the reliability of the experimental data.
Bioinformatics Analysis
The Majorbio I-Sanger Cloud Platform (http://www.i-sanger.com) was used for bioinformatics analysis in this study. MOTHUR (version v.1.30.1) was used to calculate alpha diversity indices, such as Sobs, Ace, Shannon, and Simpson. Wilcoxon rank sum tests were used to evaluate differences. Beta-diversity analysis was performed to evaluate similarities and differences between detected samples using pairwise Wilcoxon rank sum tests combined with Benjamini-Hochberg (BH) correction. A P value less than 0.05 was considered statistically significant. Linear discriminant analysis effect size (LEfSe) was used in this study to identify the different species.
MicroPITA (microbiomes: picking interesting taxonomic abundance) was used to select samples for sequencing during metagenomic analysis. LEfSe was used in this study to determine differences in COG and KEGG categories between different groups. Furthermore, results with LDA values > 2.0 and P < 0.05 were considered to be statistically significant.
The original metabolomic data were handled according to QC samples, and metabolites with low repetition were removed (CV < 30%). The data was then converted logarithmically to base two. The remaining data were analyzed using principal component analysis (PCA) and orthogonal partial least square discriminant analysis (OPLS-DA) after being normalized using Pareto scaling. Metabolic pathway analysis of statistically different metabolites was carried out using MetaboAnalyst software v.4.0 to reveal the top altered pathways. The Spearman correlation was analyzed to display correlations between gut microbiota and fecal metabolites.
Results
The Effects of Benaglutide on the Diversity of Gut Microbiota in Patients with T2DM
In this study, we used 16S ribosomal RNA gene sequencing and metagenomic sequencing on the stool specimens collected from healthy participants, patients with T2DM who were treated with metformin, and patients with T2DM who were treated with metformin combined with benaglutide to determine whether benaglutide changes gut microbiota in patients with T2DM. First, α diversity analysis was conducted. Rarefaction curves for the Sobs and Shannon indices revealed a gradual decrease in operational taxonomic unit (OTU) rates as the number of individuals sampled increased, indicating that the sampling depth was adequate to support a reliable assessment of dominant members of the microbial community. Second, the indices of Sobs, Ace, Shannon, and Simpson were calculated and analyzed using the Wilcoxon rank-sum test. There was no statistical difference in the Ace and Chao indices between the four groups. Furthermore, statistical differences in Shannon and Simpson diversity were only found in groups A and C (Figure 1).
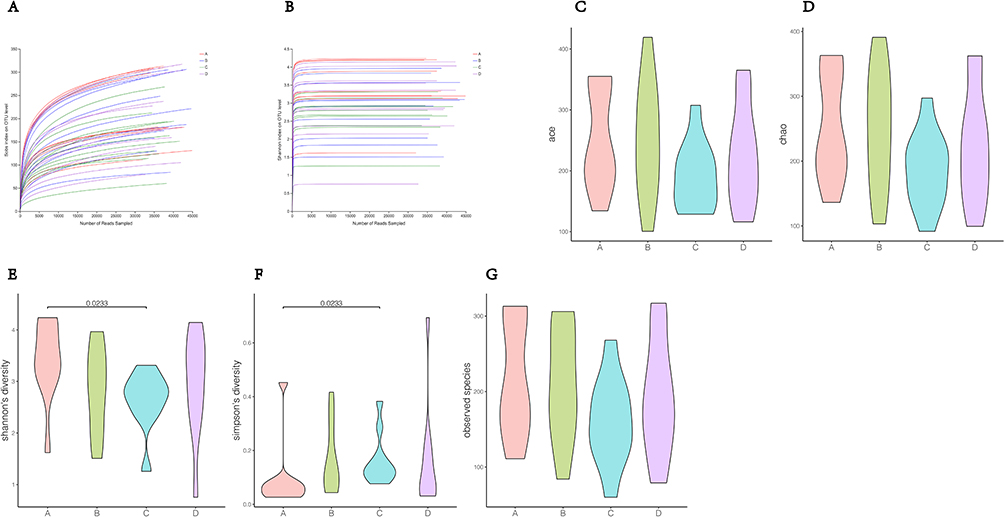 |
Figure 1 Alpha diversity analysis. (A) Rarefaction curves of Sobs index; (B) rarefaction curves of Shannon index; (C–G) Differences in alpha diversity indices between groups. |
In addition, a taxonomic analysis of the readings showed that there were mainly 12 phyla, 20 classes, 31 orders, 30 families, 30 genera, and 31 species (Figure 2).
 |
Figure 2 Distribution of gut microbiota species at phylum (A), class (B), order (C), family (D), genus (E) and species (F) levels. |
We also analyzed the β diversity to evaluate the differences and richness of microbiota diversity between each group. As shown in Table 1, species that distinguished themselves from other microbiota dominated at the level of families, genera, orders, and species among the 27 microbiota. Among the seven statistically distinct species, Faecalibacterium prausnitzii showed a dominance of richness over other gut microbiota in the control group. Furthermore, compared to other gut microbiota, there was a significant decrease in the richness of F. prausnitzii in patients who were treated with metformin alone, indicating a difference in gut microbiota between patients with T2DM and the control group and the fact that metformin failed to restore gut microbiota in patients with T2DM to a normal state. Although patients with T2DM who were treated with metformin combined with benaglutide had a lower richness of F. prausnitzii than the control group, this difference was not statistically significant. These findings suggest that benaglutide could normalize the gut microbiota in patients with T2DM. Significant differences were also observed in the gut microbiota richness of Ruminococcus bicirculans, Eubacterium rectale ATCC 33656, Eubacterium ramulus, Bifidobacterium adolescentis, and Bacteroides eggerthii between the control group and patients with T2DM who were treated with metformin combined with benaglutide. A statistically significant difference in the gut microbiota richness of R. bicirculans was also observed between the control group and patients with T2DM treated with metformin alone. However, when compared to other gut microbiota in the control group, these six microbiota had a relatively low level of richness (Figure 3).
 |
Table 1 P values of Richness of Gut Microbiota with Statistical Difference |
 |
Figure 3 Bar graph of gut microbiota with statistically differential richness. |
Metagenomic sequencing was also performed in this study to determine the impact of benaglutide on the microbial population genes in patients with T2DM. According to the data, a total of 3,764,329 open reading frames (ORFs) were predicted (with ORFs ranging from 147,214 to 434,750 in each group). Subsequently, Kyoto Encyclopedia of Genes and Genomes (KEGG) pathway annotation was conducted using a Basic Local Alignment Search Tool (BLAST) search of the KEGG database. The analysis indicated that dominant ORFs could induce the presence of specific metabolic pathways, such as the biosynthesis of secondary metabolites and amino acids, and microbial metabolism in different environments.
Changes in Fecal Metabolites of Patients with T2DM After Benaglutide Treatment
To determine alterations in fecal metabolites in patients with T2DM after benaglutide treatment, fecal metabolomics profiles were created for all groups in this study. PCA between groups was performed after Pareto scaling, as PCA can distinguish between metabolic differences between groups and variability across groups. Separation trends on PC1 (principal component 1) and PC2 (principal component 2) dimension maps were not visible between the groups, indicating that there was no change in fecal metabolic profiles between the four groups (Figure 4). Furthermore, orthogonal partial least squares discriminant analysis (OPLS-DA) was used to analyze samples to verify differential metabolites between the groups. Score plots for OPLS-DA confirmed differential metabolites between the four groups based on our data, and the OPLS-DA fitting model retained the ability to verify differences between all four groups (Figure 5).
 |
Figure 4 PCA scores of fecal metabolome. |
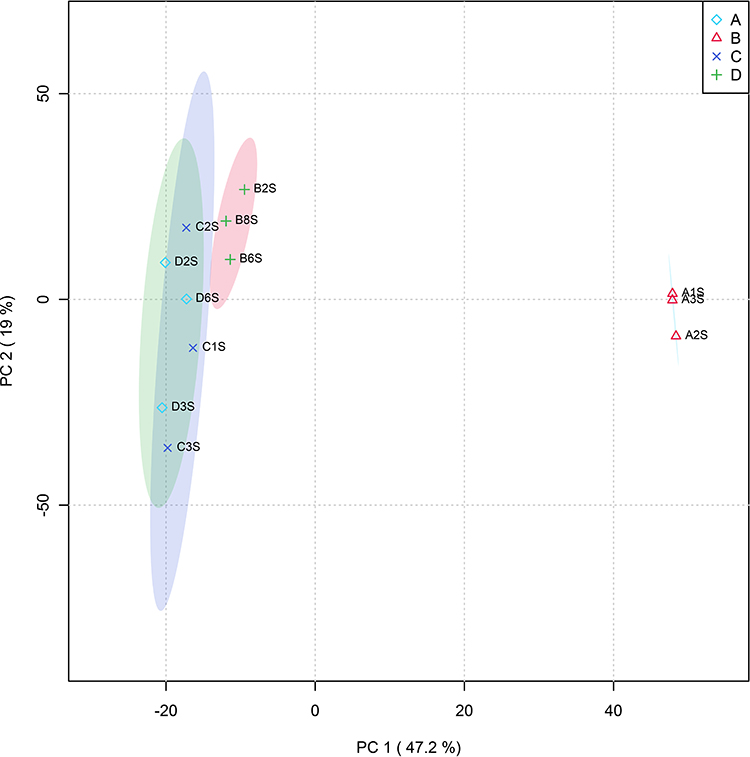 |
Figure 5 OPLS-DA analysis of fecal metabolites: result of permutation tests. |
Furthermore, differential metabolites were analyzed using one-way ANOVA (analysis of variance) with a variable importance in projection (VIP) threshold of 1 (P < 0.05). Hierarchical cluster analysis (HCA) with heat maps was also completed to display 32 differential metabolites in the fecal metabolome. The analysis showed that these 32 different metabolites formed four distinct clusters (Figure 6). As shown in Figures 7–10, the six most abundant metabolites in group D were grouped into cluster 1, and the 12 most abundant metabolites in group A were grouped into cluster 2. Nine metabolites that were more predominantly enriched in groups A and B than in groups C or D were grouped into cluster 3. The three metabolites that were more abundant in groups C and D than in groups A and B were grouped into cluster 4.
 |
Figure 6 Heat map of differential metabolites in stool. |
 |
Figure 7 Compound expressions in cluster 1 of differential metabolites in stool. |
 |
Figure 8 Compound expressions in cluster 2 of differential metabolites in stool. |
 |
Figure 9 Compound expressions in cluster 3 of differential metabolites in stool. |
 |
Figure 10 Compound expressions in cluster 4 of differential metabolites in stool. |
We performed a comprehensive correlation analysis for groups B and C to validate the alterations in fecal metabolites caused by benaglutide, including how metabolites correlated with 16S ribosomal RNA gene sequencing data and metagenomic sequencing data. Figures 11 and 12 show that between patients treated with metformin alone and patients treated with metformin combined with benaglutide, 20 different fecal metabolites were associated with 51 intestinal species. Metabolites of F. prausnitzii include 4-pyridoxic acid, vanillin, digoxin, 2- (8- [3] -ladderane octyl) -sn-glycero-3-phosphocholine, 2-methylguanosine, ascorbic acid-2-sulfate, N-acetylamino lactose, N2-acetyl-L-aminoadipic acid, and calaba flavonoid. In these metabolites, there was a statistical correlation between patients treated with metformin alone and patients treated with metformin combined with benaglutide.
 |
Figure 11 Correlation between metabolites and S16S between group B and group C. *P < 0.05; **P < 0.01; ***P < 0.001. |
 |
Figure 12 Correlation between metabolites and metagenomic analysis between group B and group C. *P < 0.05; **P < 0.01; ***P < 0.001. |
KEGG enrichment analysis was performed between groups B and C, which revealed metabolic pathways such as biosynthesis of phenylpropanoids, taurine, vitamin B6 metabolism, sulfur metabolism, primary bile acid biosynthesis, neuroactive ligand-receptor interactions, and flavonoid biosynthesis (Figure 13).
 |
Figure 13 KEGG enrichment analysis between group B and group C. *P < 0.05; **P < 0.01. |
Discussion
Benaglutide is a short-acting GLP-1RA with 100% homology to human GLP-1. Human GLP-1, which is secreted by L-cells of the intestinal mucosa, is effective in lowering blood glucose due to its ability to delay gastric emptying,14 promotes pancreatic insulin secretion, and inhibits pancreatic glucagon secretion. Benaglutide was approved for the treatment of type 2 diabetes in China in December 2016. Increasing evidence indicates that benaglutide is effective in controlling blood glucose and lowering body weight,15 but its underlying mechanism of action remains unknown.
The gut microbiota and its metabolites play a crucial role in the development of T2DM and obesity.16,17 Therefore, in this study, we used 16S ribosomal RNA amplicon sequencing on stool specimens from participants to verify whether benaglutide could change the diversity of gut microbiota through α and β diversity analysis. The data revealed that the values of Ace, Chao, Shannon, and Simpson indices differed between the four groups, indicating that specific α diversity of gut microbiota would be generated by its corresponding treatment. Subsequently, we carried out β diversity analysis to confirm the similarities and differences between all four groups. Among the 11 genera and 7 species that showed statistical differences in this study, F. prausnitzii were negatively associated with T2DM.18 Two previous case-control studies found few fecal bacilli in this disease group.19,20 Moreover, this genus was reduced after treatment with different glucose-reducing regimens, such as metformin21 and bariatric surgery.22 Furthermore, F. prausnitzii was frequently detected at the species level during studies on this genus, and it was found to be negatively associated with T2DM in four out of five human case-control studies.23–27 Based on our analysis, our study yielded results consistent with these prior studies, namely, F. prausnitzii dominated the gut microbiota of healthy participants in the control group, but the richness of F. prausnitzii was statistically significantly lower in the gut microbiota of patients treated with metformin alone. These findings suggest that metformin monotherapy did not normalize gut microbiota in patients with T2DM. The gut microbiota richness of F. prausnitzii in patients with T2DM who were treated with metformin combined with benaglutide was relatively lower than in the control group. However, this difference was not statistically significant. These findings suggest that benaglutide could normalize the diversity of gut microbiota in patients with T2DM. In general, a decrease in the number of Freund’s adjuvant is associated with the production of short-chain fatty acids (SCFAs) by the gut microbiota,28 whereas an increase in SCFAs is clearly associated with obesity.29,30 In conclusion, the effectiveness of benaglutide on glycemic and weight control should be partly attributed to its ability to specifically alter gut microbiota diversity in patients with T2DM, including its effects on F. prausnitzii.
At present, association between T2DM and inflammation is well-established.31 Many inflammatory index may be useful in predicting the development and control levels of T2DM.32,33 Significant advances have been made in understanding the composition and functional capabilities of the gut microbiota and its roles in T2DM. Accumulating evidence suggests that gut microbiota and its metabolites, and the ensuing inflammation contributes to T2DM initiation and T2DM progression.34 SCFAs, which are bacterial products that balance redox status and can act as signaling molecules that participate in the activation of key enzymes involved in cholesterol, lipid, and glucose metabolism, were found to be involved in the development of diabetes and obesity.35,36 Furthermore, gut microbiota were able to regulate incretin production, such as GLP-1 and gastrointestinal kinins [peptide YY (PYY)] through SCFAs and their binding to free fatty acid receptor 2 (FFAR2).37 GLP-1RAs showed beneficial effects on mortality and major cardiovascular adverse events (MACE) compared to other types of hypoglycemic drugs.38
Metagenomic sequencing analysis in this study suggested that dominant ORFs can stimulate some metabolic pathways. Therefore, differences in metabolites in stools were identified using PCA and OPLS-DA analysis to determine whether benaglutide treatment altered fecal metabolomic profiles in patients with T2DM. Based on our data, it was confirmed that OPLS-DA analysis can detect changes in fecal metabolites between the four groups. In this study, 32 different metabolites were identified in fecal metabolomics, and fecal metabolites differed between the control group and patients with T2DM. To confirm that benaglutide could affect fecal metabolites in patients with T2DM, we examined how metabolites in patients with T2DM correlated with 16S ribosomal RNA gene sequencing and metagenomic sequencing data. Based on the data, 20 different fecal metabolites were associated with 51 gut microbiota including F. prausnitzii, between patients treated with metformin alone and patients treated with metformin combined with benaglutide. Among these 20 fecal metabolites, the T2DM population was associated with F. prausnitzii in 4-pyridoxic acid, vanillin, digoxin, 2- (8- [3] -ladderane octyl) -sn-glycero-3-phosphocholine, 2-methylguanosine, ascorbic acid-2-sulfate, N-acetylamino lactose, N2-acetyl-L-aminoadipic acid, and calaba flavonoid. KEGG enrichment analysis was used to explore the pathways underlying these metabolite differences. This study revealed the biosynthesis of phenylpropanoids, taurine and hypotaurine metabolism, sulfur metabolism, primary bile acid biosynthesis, vitamin B6 metabolism, neuroactive ligand-receptor interaction, and flavonoid biosynthesis. Whether these pathways are associated with the glucose-lowering and weight-lowering effects of benaglutide needs to be further investigated.
Conclusion
In conclusion, benaglutide can normalize the diversity of gut microbiota in patients with T2DM, particularly the abundance of F. prausnitzii.39 The hypoglycemic and weight-lowering effects of benaglutide may be mediated by specific gut metabolites; however, the precise mechanism requires further investigation.
Data Sharing Statement
All data generated or analysed during this study are included in this article. Further enquiries can be directed to the corresponding author.
Ethics Approval and Consent to Participate
The study was conducted in accordance with the Declaration of Helsinki (as was revised in 2013). The study was approved by Ethics Committee of the Qingpu Branch of Zhongshan Hospital affiliated to Fudan University (No.Qingyi2021-27). Written informed consent was obtained from all participants.
Acknowledgments
We are particularly grateful to all the people who have given us help on our article.
Funding
This study was funded by the Shanghai Municipal Health Commission (No. 20204Y0060); Shanghai Qingpu District Science and Technology Commission (No. QKY2021-03); and Shanghai Qingpu District Health Commission (No. QWJ2022-01).
Disclosure
The authors declare that they have no competing interests in this work.
References
1. Sililas P, Huang L, Thonusin C, et al. Association between gut microbiota and development of gestational diabetes mellitus. Microorganisms. 2021;9:1686. doi:10.3390/microorganisms9081686
2. Li SC, Xiao Y, Wu RT, et al. Comparative analysis of type 2 diabetes-associated gut microbiota between Han and Mongolian people. J Microbiol. 2021;59:693–701. doi:10.1007/s12275-021-0454-8
3. Maskarinec G, Raquinio P, Kristal BS, et al. The gut microbiome and type 2 diabetes status in the Multiethnic Cohort. PLoS One. 2021;16:e0250855. doi:10.1371/journal.pone.0250855
4. Padakandla SR, Das T, Sai Prashanthi G, et al. Dysbiosis in the gut microbiome in streptozotocin-induced diabetes rats and follow-up during retinal changes. Invest Ophthalmol Vis Sci. 2021;62:31. doi:10.1167/iovs.62.10.31
5. Roth-Schulze AJ, Penno MAS, Ngui KM, et al. Type 1 diabetes in pregnancy is associated with distinct changes in the composition and function of the gut microbiome. Microbiome. 2021;9:167. doi:10.1186/s40168-021-01104-y
6. Que Y, Cao M, He J, et al. Gut bacterial characteristics of patients with type 2 diabetes mellitus and the application potential. Front Immunol. 2021;12:722206. doi:10.3389/fimmu.2021.722206
7. Chen Z, Radjabzadeh D, Chen L, et al. Association of insulin resistance and type 2 diabetes with gut microbial diversity: a microbiome-wide analysis from population studies. JAMA Netw Open. 2021;4:e2118811. doi:10.1001/jamanetworkopen.2021.18811
8. Du X, Liu J, Xue Y, et al. Alteration of gut microbial profile in patients with diabetic nephropathy. Endocrine. 2021;73:71–84. doi:10.1007/s12020-021-02721-1
9. Zeng Z, Guo X, Zhang J, Yuan Q, Chen S. Lactobacillus paracasei modulates the gut microbiota and improves inflammation in type 2 diabetic rats. Food Funct. 2021;12:6809–6820. doi:10.1039/d1fo00515d
10. van Bloemendaal L, Ten Kulve JS, la Fleur SE, Ijzerman RG, Diamant M. Effects of glucagon-like peptide 1 on appetite and body weight: focus on the CNS. J Endocrinol. 2014;221:T1–T16. doi:10.1530/JOE-13-0414
11. Vilsbøll T, Christensen M, Junker AE, Knop FK, Gluud LL. Effects of glucagon-like peptide-1 receptor agonists on weight loss: systematic review and meta-analyses of randomised controlled trials. BMJ. 2012;344:d7771. doi:10.1136/bmj.d7771
12. Wang G, Wu P, Qiu Y, et al. Effect of beinaglutide treatment on weight loss in Chinese patients with type 2 diabetes mellitus and overweight/obesity. Arch Endocrinol Metab. 2021;65:421–427. doi:10.20945/2359-3997000000388
13. Zhang F, Chen Z, Wu D, et al. Recombinant human GLP-1 beinaglutide regulates lipid metabolism of adipose tissues in diet-induced obese mice. iScience. 2021;24:103382. doi:10.1016/j.isci.2021.103382
14. Nadkarni P, Chepurny OG, Holz GG. Regulation of glucose homeostasis by GLP-1. Prog Mol Biol Transl Sci. 2014;121:23–65. doi:10.1016/B978-0-12-800101-1.00002-8
15. Zhang YL, Zhou C, Li XF, et al. Beinaglutide showed significant weight-loss benefit and effective glycaemic control for the treatment of type 2 diabetes in a real-world setting: a 3-month, multicentre, observational, retrospective, open-label study. Obes Sci Pract. 2019;5:366–375. doi:10.1002/osp4.342
16. Lippert K, Kedenko L, Antonielli L, et al. Gut microbiota dysbiosis associated with glucose metabolism disorders and the metabolic syndrome in older adults. Benef Microbes. 2017;8:545–556. doi:10.3920/BM2016.0184
17. Scheithauer TPM, Rampanelli E, Nieuwdorp M, et al. Gut microbiota as a trigger for metabolic inflammation in obesity and type 2 diabetes. Front Immunol. 2020;11:571731. doi:10.3389/fimmu.2020.571731
18. Gurung M, Li Z, You H, et al. Role of gut microbiota in type 2 diabetes pathophysiology. EBioMedicine. 2020;51:102590. doi:10.1016/j.ebiom.2019.11.051
19. Gao R, Zhu C, Li H, et al. Dysbiosis signatures of gut microbiota along the sequence from healthy, young patients to those with overweight and obesity. Obesity. 2018;26:351–361. doi:10.1002/oby.22088
20. Salamon D, Sroka-Oleksiak A, Kapusta P, et al. Characteristics of gut microbiota in adult patients with type 1 and type 2 diabetes based on next‑generation sequencing of the 16S rRNA gene fragment. Pol Arch Intern Med. 2018;128:336–343. doi:10.20452/pamw.4246
21. Tong X, Xu J, Lian F, et al. Structural alteration of gut microbiota during the amelioration of human type 2 diabetes with hyperlipidemia by metformin and a traditional Chinese herbal formula: a multicenter, randomized, open label clinical trial. mBio. 2018;9:e02392–e023117. doi:10.1128/mBio.02392-17
22. Murphy R, Tsai P, Jüllig M, Liu A, Plank L, Booth M. Differential changes in gut microbiota after gastric bypass and sleeve gastrectomy bariatric surgery vary according to Diabetes remission. Obes Surg. 2017;27:917–925. doi:10.1007/s11695-016-2399-2
23. Zhang X, Shen D, Fang Z, et al. Human gut microbiota changes reveal the progression of glucose intolerance. PLoS One. 2013;8:e71108. doi:10.1371/journal.pone.0071108
24. Karlsson FH, Tremaroli V, Nookaew I, et al. Gut metagenome in European women with normal, impaired and diabetic glucose control. Nature. 2013;498:99–103. doi:10.1038/nature12198
25. Remely M, Aumueller E, Merold C, et al. Effects of short chain fatty acid producing bacteria on epigenetic regulation of FFAR3 in type 2 diabetes and obesity. Gene. 2014;537:85–92. doi:10.1016/j.gene.2013.11.081
26. Furet JP, Kong LC, Tap J, et al. Differential adaptation of human gut microbiota to bariatric surgery-induced weight loss: links with metabolic and low-grade inflammation markers. Diabetes. 2010;59:3049–3057. doi:10.2337/db10-0253
27. Graessler J, Qin Y, Zhong H, et al. Metagenomic sequencing of the human gut microbiome before and after bariatric surgery in obese patients with type 2 diabetes: correlation with inflammatory and metabolic parameters. Pharmacogenomics J. 2013;13:514–522. doi:10.1038/tpj.2012.43
28. Qin J, Li Y, Cai Z, et al. A metagenome-wide association study of gut microbiota in type 2 diabetes. Nature. 2012;490:55–60. doi:10.1038/nature11450
29. Rahat-Rozenbloom S, Fernandes J, Gloor GB, Wolever TM. Evidence for greater production of colonic short-chain fatty acids in overweight than lean humans. Int J Obes. 2014;38:1525–1531. doi:10.1038/ijo.2014.46
30. de la Cuesta-Zuluaga J, Mueller NT, Álvarez-Quintero R, et al. Higher fecal short-chain fatty acid levels are associated with gut microbiome dysbiosis, obesity, hypertension and cardiometabolic disease risk factors. Nutrients. 2018;11(1):51. doi:10.3390/nu11010051
31. Atak B, Aktas G, Duman TT, Erkus E, Kocak MZ, Savli H. Diabetes control could through platelet-to-lymphocyte ratio in hemograms. Rev Assoc Med Bras. 2019;65(1):38–42. doi:10.1590/1806-9282.65.1.38
32. Aktas G, Kocak MZ, Bilgin S, Atak BM, Duman TT, Kurtkulagi O. Uric acid to HDL cholesterol ratio is a strong predictor of diabetic control in men with type 2 diabetes mellitus. Aging Male. 2020;23(5):1098–1102. doi:10.1080/13685538.2019.1678126
33. Aktas G, Kocak MZ, Duman TT,et al. Mean Platelet Volume (MPV) as an inflammatory marker in type 2 diabetes mellitus and obesity. Bali Med J. 2018;7(3):650–953. doi:10.15562/bmj.v7i3.806
34. Brennan CA, Garrett WS. Gut microbiota, inflammation, and colorectal cancer. Annu Rev Microbiol. 2016;70:395–411. doi:10.1146/annurev-micro-102215-095513
35. Nøhr MK, Pedersen MH, Gille A, et al. GPR41/FFAR3 and GPR43/FFAR2 as cosensors for short-chain fatty acids in enteroendocrine cells vs FFAR3 in enteric neurons and FFAR2 in enteric leukocytes. Endocrinology. 2013;154:3552–3564. doi:10.1210/en.2013-1142
36. Tolhurst G, Heffron H, Lam YS, et al. Short-chain fatty acids stimulate glucagon-like peptide-1 secretion via the G-protein-coupled receptor FFAR2. Diabetes. 2012;61:364–371. doi:10.2337/db11-1019
37. Cani PD, Delzenne NM. The role of the gut microbiota in energy metabolism and metabolic disease. Curr Pharm Des. 2009;15:1546–1558. doi:10.2174/138161209788168164
38. Brønden A, Christensen MB, Glintborg D, et al. Effects of DPP −4 inhibitors, GLP −1 receptor agonists, SGLT −2 inhibitors and sulphonylureas on mortality, cardiovascular and renal outcomes in type 2 diabetes: a network meta-analyses-driven approach. Diabet Med. 2023;40:e15157. doi:10.1111/dme.15157
39. Meier JJ. GLP-1 receptor agonists for individualized treatment of type 2 diabetes mellitus. Nat Rev Endocrinol. 2012;8:728–742. doi:10.1038/nrendo.2012.140
 © 2023 The Author(s). This work is published and licensed by Dove Medical Press Limited. The full terms of this license are available at https://www.dovepress.com/terms.php and incorporate the Creative Commons Attribution - Non Commercial (unported, v3.0) License.
By accessing the work you hereby accept the Terms. Non-commercial uses of the work are permitted without any further permission from Dove Medical Press Limited, provided the work is properly attributed. For permission for commercial use of this work, please see paragraphs 4.2 and 5 of our Terms.
© 2023 The Author(s). This work is published and licensed by Dove Medical Press Limited. The full terms of this license are available at https://www.dovepress.com/terms.php and incorporate the Creative Commons Attribution - Non Commercial (unported, v3.0) License.
By accessing the work you hereby accept the Terms. Non-commercial uses of the work are permitted without any further permission from Dove Medical Press Limited, provided the work is properly attributed. For permission for commercial use of this work, please see paragraphs 4.2 and 5 of our Terms.