")
Back to Journals » Diabetes, Metabolic Syndrome and Obesity » Volume 16
Effect of Aerobic Exercise in Chinese Adult Individuals at Risk for Type 2 Diabetes Mellitus (T2DM) with Low Salivary Amylase Gene (AMY1) Copy Number Variation
Authors Zhang X , Moran C, Wang R, Zhou Y
Received 17 February 2023
Accepted for publication 18 July 2023
Published 19 September 2023 Volume 2023:16 Pages 2875—2883
DOI https://doi.org/10.2147/DMSO.S409007
Checked for plagiarism Yes
Review by Single anonymous peer review
Peer reviewer comments 2
Editor who approved publication: Prof. Dr. Muthuswamy Balasubramanyam
Xinming Zhang,1,* Colin Moran,2,* Ruiyuan Wang,3 Yue Zhou3
1School of Sport Science, Nantong University, Nantong City, Jiangsu Province, People’s Republic of China; 2School of Health Sciences and Sport, University of Stirling, Stirling, Scotland, The United Kingdom; 3School of Sport Science, Beijing Sport University, Beijing City, People’s Republic of China
*These authors contributed equally to this work
Correspondence: Xinming Zhang, Nantong University, No. 9 Seyuan Road, Nantong, Jiangsu Province, People’s Republic of China, Tel +86 15901080090, Email [email protected]
Purpose: Type 2 Diabetes mellitus (T2DM) has become a life-threatening health problem around the world. Studies have confirmed that aerobic exercise can prevent the risk of T2DM. Furthermore, recent research showed that salivary amylase gene (AMY1) copy number variation (CNV) could be one of the genetic factors that increased the risk of T2DM. To provide more evidence on how AMY1 CNV and exercise is correlated with the risk of T2DM, we designed this study to show the differences in postprandial carbohydrate metabolism between people with different AMY1 copy numbers, and how aerobic exercise can influence this process.
Participants and Methods: Sixteen participants without cardiovascular disease were chosen, 8 with AMY1 CNV≥ 6 (High CNV group, HCNV), and 8 with AMY1 CNV ≤ 2 (Low CNV group, LCNV). All participants were Chinese, Han nationality, 18 to 40 years old, with fasting blood glucose lower than 6.1 mmol/L and normal blood pressure levels. They were asked to visit the laboratory in fasting state and drink a cup of solution with 75 grams of edible carbohydrate (glucose or starch). After carbohydrate intake, blood samples were taken at certain times at rest or after aerobic exercise. Blood glucose levels were tested with a portable blood glucose monitor, and insulin levels were tested with the enzyme-linked immunosorbent assay (ELISA).
Results: The LCNV group had significantly higher resting insulin levels and homeostatic model assessment of insulin resistance (HOMA-IR) than the HCNV group. Compared to the HCNV group, postprandial blood glucose levels and insulin levels were insensitive to starch intake in the LCNV group. However, this difference disappeared after aerobic exercise was added as an intervention.
Conclusion: Lower AMY1 CNV could be associated with higher risk of T2DM and complex carbohydrate metabolism disorder, while aerobic exercise can reduce the risk by increasing the carbohydrate utilization rate.
Keywords: salivary amylase gene, copy number variation, blood glucose, insulin
Introduction
Diabetes mellitus (DM) is one of the most common disorders of metabolism.1–4 According to the World Health Organization (WHO), the number of people with diabetes reached 422 million in 2014. In 2019, DM was ranked as the ninth cause of death, leading directly to around 1.5 million deaths. Except for the high prevalence, the pathological symptoms of DM, such as long-term hyperglycemia, will lead to acute and chronic complications including diabetic ketoacidosis, lactic acidosis, vascular diseases, and neuropathy. These complications may cause blindness, extremity necrosis, or visceral diseases such as diabetic nephropathy,5 making DM a worldwide life-threatening health problem. The most common form of DM is type 2 diabetes mellitus (T2DM). As the WHO reported, more than 95% of people with diabetes have T2DM, and it is usually caused by obese, lack of exercise, and genetics.
Many studies have confirmed that aerobic exercise can prevent the risk of T2DM. Aerobic exercise can effectively reduce the blood glucose level of patients with T2DM, thus reducing the occurrence of complications.6 For people who have a family history of T2DM but are not yet a patient, moderate aerobic exercise plays an important part in reducing their risk of having T2DM.7
T2DM has a strong heritability. Based on previous family and twin studies, the heritability of T2DM was estimated as 25% to 72%.8 Apart from the monogenic and polygenic forms of T2DM,9 salivary amylase gene (AMY1) copy number variation (CNV) has recently been considered as one of the genetic factors that increased the risk of T2DM. Studies have shown that lower AMY1 CNV is related to higher risk of insulin resistance in the asymptomatic population,10 and the risk will increase with an increasing age.11
Research has already found that AMY1 CNV is positively correlated with protein content and saliva activity.12 Another study has proven that a higher AMY1 copy number could contribute to better digestion of the starchy diet. This study also indicated that people with higher AMY1 copy number may have their peak postprandial blood insulin level ahead of those with lower AMY1 copy numbers and have a lower postprandial blood glucose level after eating a starchy diet.13 These indicate that the risk of T2DM correlated with a lower AMY1 copy number is probably caused by the low efficiency of starch utilization, yet more evidence should be provided to prove this hypothesis.
To provide more evidence on how AMY1 CNV is correlated with the risk of T2DM, we designed our study to show the specific differences in postprandial carbohydrate metabolism between people with different AMY1 copy numbers, and how aerobic exercise can influence this process.
Materials and Methods
DNA Collection and AMY1 CNV Estimation
To find our target participants, we collected 133 saliva samples from one of our previous studies14 using sample collection tubes (Zhishan Biology Company, Xiamen, China). Subsequently, PrepIT•L2P (DNA Genotek, Canada) was used to extract DNA. The quantity and quality of extracted DNA were then determined by the DS-11FX Spectrophotometer/Fluorometer (Denovix, USA).
Real-time fluorescence quantitative Polymerase Chain Reaction (RTFQ PCR) was applied to estimate AMY1 CNV for each participant. We used the TaqMan copy number assay (Hs07226361_cn, Thermo Fisher, USA) as the target detector, and the TaqMan copy number reference assay (RNaseP) (Hs07226361_cn, Thermo Fisher, USA) was then applied to detect the sequence on the other chain in Applied Biosystems™ ViiA 7 real-time PCR System (Thermo Fisher, USA). The ΔΔCT results were calculated in Applied Biosystems™ ViiA 7 software v2.0 (Thermo Fisher, USA). These results were used to select proper participants and categorize the chosen ones into two groups.
Participants Selection
All participants we selected are Chinese, Han nationality, 18 to 40 years old, with a fasting blood glucose level lower than 6.1 mmol/L, a normal blood pressure level (resting systolic pressure between 100 and 130 mmHg and diastole between 60 and 80 mmHg), and without any cardiovascular disease. From the above AMY1 CNV results, we decided to use AMY1 CNV ≥ 6 (High CNV group, HCNV) and AMY1 CNV ≤ 2 (Low CNV group, LCNV) as our target subject conditions. We had 20 participants with LCNV and 31 with HCNV, and 19 of them (10 participants with LCNV and 9 participants with HCNV) agreed to continue with the following experiment. Three of them dropped off due to their personal reasons during the experiment. Finally, we collected data from 16 participants who completed all the experimental procedures, 8 with AMY1 CNV ≥ 6 (High CNV group, HCNV), and 8 with AMY1 CNV ≤ 2 (Low CNV group, LCNV). All the participants have received a paper-form informed consent listing the whole experimental process and risks before they participated in. They all agreed and signed it before they were officially involved in the study. The protocol has been approved by the School of Sport Research Ethics Committee of the University of Stirling (SSREC code # 880).
Individual Anaerobic Threshold (AT)
All the participants were required to receive an individual anaerobic threshold test prior to blood sampling to determine the intensity of aerobic exercise later.
Participants were not allowed to drink alcohol or stay up late the day before visiting the lab. Before the test, participants were required to be equipped with the Polar sport tester (Polar Electro, Finland) for heart rate monitoring and a mask for gas analysis (CORTEX, Germany) later. The individual anaerobic threshold was measured by the improving graded exercise text, which was performed on the treadmill, with starting power at 50 watts for both genders. The velocity for each degree was 2.7 km/h, 4.0 km/h, 5.5 km/h, 6.8 km/h, 8.1 km/h, 8.9 km/h, and 9.3 km/h. The workout power increment was 30 watts for male participants and 20 watts for female participants, which was instantly adjusted with personal body weight and treadmill slope using the Metasoft system (3.9 version, CORTEX, Germany). The degree of force would continue to increase throughout the test until the participants became exhausted. There were 7 degrees at most, each degree lasted 3 minutes, and no rest was allowed between each degree. The participants were under medical supervision during the entire test period.
We stopped the test at once under any of the following conditions: a) Participants felt intolerable for the current degree of force at any time. b) Participants have reached their maximum heart rate (220-age heartbeat per minute). c) The oxygen intake has stopped increasing to any degree.
All data was collected in the Metasoft system (3.9 version, CORTEX, Germany) and exported in Excel formats. We use the V-slope method to estimate the AT for each participant. The estimation was repeated three times for each result. The average of these three values was then calculated as the final AT.
Blood Sampling
Blood Sampling in the Resting Condition
All devices and supplies were prepared one day before the test, including venous indwelling needles, aseptic adhesive dressings, portable blood glucose monitor, and paired test strips (Accu-chek active, Roche, Germany), anticoagulation tubes with EDTA, normal saline and aseptic syringes. For participants, alcohol intake, excessive diet, staying up late, or any other behavior that affected metabolism level were strictly prohibited before the day of their visit. Two visits were required for carbohydrate intake including glucose and starch, and there should be at least one week between the two visits.
On test day, all participants should visit on an empty stomach in the early morning, with the venous indwelling needle inserted into their antecubital vein after a short rest. A 3 mL blood sample was first drawn to monitor fasting blood glucose and insulin level as baseline. After that, participants were asked to consume a cup of solution that contained 75 g of carbohydrates (glucose or starch) in 2 minutes. The time point was recorded as 0 when they finished drinking, and blood samples were taken through the cannula at 15 min, 30 min, 45 min, 60 min, 90 min, and 120 min. After sampling, the cannula was washed with normal saline in case of blood clotting. All samples were stored in the refrigerator at −20 degrees Celsius. Blood glucose levels were measured and recorded immediately after taking samples, and the insulin levels would be tested by enzyme-linked immunosorbent assay later.
All procedures are summarized in Figure 1.
 |
Figure 1 The flow diagram for blood sampling in the resting condition. Activities were sorted at each time point. |
Blood Sampling After Exercise
Like resting conditions, all devices and supplies should also be prepared as mentioned above one day before the test. Two visits were required for carbohydrates including glucose and starch, and at least one week of period was also required between the two visits.
Participants were still asked to visit on an empty stomach in the early morning, equipped with the Polar Sport Tester (Polar Electro, Finland) for heart rate monitoring and the mask for gas analysis (MetaLyzer 3B-R2, CORTEX, Germany) upon their arrival. They were asked to consume a cup of solution containing 75 g of carbohydrate (glucose or starch) within 2 minutes, and the time point was recorded as 0 when the drink was finished. After one minute of adaptive preparation exercise, they started their exercise at a force of 95% AT lasting 30 minutes. When exercise was stopped, the venous indwelling needle was injected, and the blood sample was taken immediately. 3 mL of blood sample was taken through the cannula at 30 min, 45 min, 60 min, 90 min, and 120 min separately, and the cannula was washed with normal saline in case of blood clotting after sampling. All samples were stored in the refrigerator at −20 degree Celsius. Blood glucose levels were measured and recorded when samples were taken, while insulin levels were measured by enzyme-linked immunosorbent assay later.
All the procedures are summarized in Figure 2.
 |
Figure 2 The flow diagram for blood sampling after exercise. Activities were sorted at each time point. |
Enzyme-Linked Immunosorbent Assay for Insulin Level
All the blood samples we collected were incubated at room temperature for 10–20 minutes, and the tubes were centrifugated for 20 min at 2000–3000 rpm afterward, with the supernatant collected as plasma samples. We used the human insulin ELISA kit (96 well, Andygene, Beijing, China) to test insulin levels. After the reactions, the initial density (O.D.) value for each sample in the well was determined by a xMark microplate spectrophotometer (Bio-Rad, Philadelphia, USA). We used the known concentration of insulin level in the kit and its O.D. value to calculate the most suitable estimation formula between insulin level and O.D. value by SPSS software (version 24.0, IBM Corporation, USA), and then the original concentration of each sample was then determined using the estimation formula mentioned above.
Statistical Analysis
All the statistical analyses were performed with SPSS software (version 24.0, IBM Corporation, USA), and the figures were drawn using GraphPad Prism 8 (GraphPad Software Inc., USA).
The areas under the curve (ΔAUC) were calculated as a time length multiplied by specific indexes, and the homeostatic model assessment of insulin resistance (HOMA-IR) was determined using the standard formula  .
.
Since gender would not be a factor that influences blood glucose and insulin levels, as proved by chi-square (P > 0.05), we use an independent T-test for comparison of blood glucose and insulin levels between different groups. To compare the data between different carbohydrates and different exercise conditions, we conducted a paired T-test for intragroup comparison. Analysis of variance for repeated measurement design data was applied when comparing trends of changes in blood glucose and insulin levels under different conditions.
All data were presented in the form of mean ± SD.
Results
Blood Glucose and Insulin Levels
HOMA-IR, Resting Blood Glucose, and Insulin Levels
Although fasting blood glucose levels were similar, significant differences could be found in fasting insulin levels between the two CNV groups (p = 0.05). The HOMA-IR was also significantly higher in the LCNV group (p = 0.046) (Table 1).
 |
Table 1 HOMA-IR, Resting Blood Glucose, and Insulin Levels |
Peak Values of Postprandial Blood Glucose and Insulin Levels
There was a significant difference in peak blood glucose levels in both the LCNV (p = 0.002) and HCNV groups (p = 0.001) between the glucose and starch intake. The peak insulin level of the LCNV group was significantly higher than that of the HCNV group after taking glucose (p = 0.043). After taking starch, the peak blood glucose level of LCNV group was significantly lower than that of the HCNV group (p = 0.036).
After exercise, only in the LCNV group showed a significant difference in peak blood glucose levels between different intakes (p = 0.012). In peak insulin levels, whether after glucose (p = 0.025) or starch (p = 0.038) intake, there was a significant difference between the two CNV groups.
For comparison between different conditions, no significant differences were found in both LCNV and HCNV groups after both intakes (p > 0.05) (Table 2).
 |
Table 2 Peak Postprandial Blood Glucose and Insulin Levels |
Areas Under the Curve of Postprandial Blood Glucose and Insulin Levels
In the resting condition, after glucose intake, we found significant differences only in postprandial insulin level areas between the LCNV and HCNV groups (p = 0.039). After a starch intake, in the LCNV group, we found significant differences not only in postprandial blood glucose level areas (p = 0.01) but also in postprandial insulin level areas (p = 0.039) between starch and glucose intake. However, in HCNV group, we only found significant difference in postprandial blood glucose level areas (P = 0.003) between different intakes.
In the exercise condition, significant differences were found in postprandial insulin level areas after both glucose intake (p = 0.036) and starch intake (p = 0.045) between the LCNV and HCNV groups. The difference in postprandial blood glucose level areas between different intakes was still significant in only LCNV group (p = 0.019).
For comparison between different conditions, there were also no significant differences found in both LCNV and HCNV groups after both intakes (p > 0.05) (Table 3).
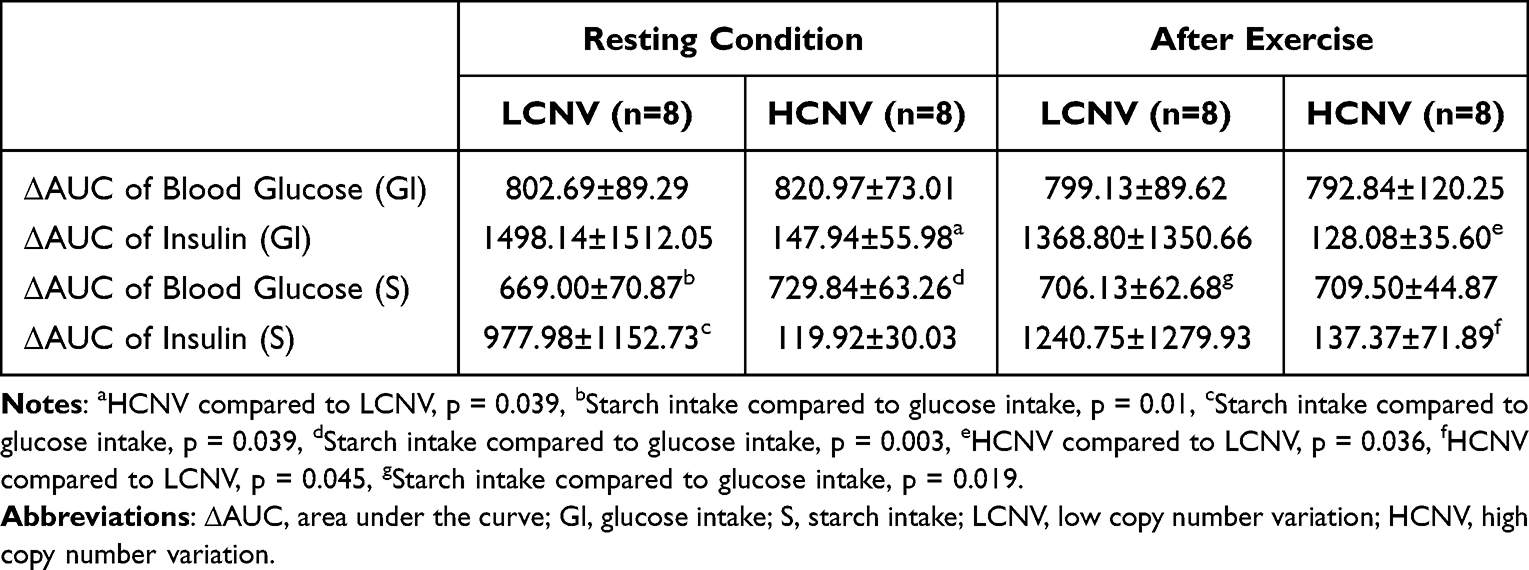 |
Table 3 Areas Under the Curve of Postprandial Blood Glucose and Insulin Levels |
Changing Trends Analysis of Blood Glucose and Insulin Levels
Changing Trends in the Resting Condition
Repeated measurement ANOVA showed that after taking glucose, there were no significant differences in the changing trends of blood glucose levels between the LCNV and HCNV groups (p = 0.673). However, after the starch intake, the significant difference of trends appeared between the two groups (p = 0.025). For insulin levels, the change trends of insulin levels were basically the same after taking glucose (p = 0.451), but the insulin levels of the LCNV group dropped suddenly at 30 minutes (p = 0.05) after starch intake, leading to the change trends difference between the two CNV groups (p = 0.038).
The changing trends of blood glucose and insulin level in the resting condition is shown in Figure 3.
 |
Figure 3 This figure showed the changing trends of blood glucose and insulin level in resting condition. |
Changing Trends After Exercise
The changing trends were similar in blood glucose levels after both glucose intake (p = 0.519) and starch intake (p = 0.796) between the LCNV and HCNV groups. For insulin levels, the changing trend was also similar after both glucose intake (p = 0.209) and starch intake (p = 0.106) between the two groups.
The changing trends of blood glucose and insulin levels after exercise is shown in Figure 4.
 |
Figure 4 This figure showed the changing trends of blood glucose and insulin level after exercise. |
Discussion
Although there was no significant difference in fasting blood glucose levels between the two groups, the HOMA-IR of the LCNV group was significantly higher than that of the HCNV group due to the higher fasting insulin level in the LCNV group. This result was consistent with Choi’s research on the relationship between AMY1 CNV and insulin resistance in Korean males, so we indicated that the risk of DM was associated with a lower copy number of AMY1.10
After starch intake, although the ΔAUC have obviously decreased in both groups, we found that the LCNV group had lower peak postprandial glucose levels. The peak postprandial blood glucose level of the LCNV group appeared at the 30th minute, earlier than that of the HCNV group at the 45th minute. After the peak value occurred, the decreasing trend of blood glucose level in the LCNV group tends to be quicker than in the HCNV group, and both groups tend to reach the fasting glucose level at 120 min. The sudden decrease of insulin level in the LCNV group at the 30th minute, which was the same time point as the peak postprandial blood glucose level, may be the reason why this peak value appeared earlier than in the HCNV group. This trend was against the hypothesis that people with a higher AMY1 copy number might have peak postprandial blood insulin levels ahead of those with a lower AMY1 copy number and had a lower postprandial blood glucose level after eating a starchy diet.13
Because starch must be decomposed into glucose by amylase in various digestive organs before being used by the human body, the starch intake transfer rate to blood glucose depends on the efficiency of starch decomposition. Previous studies have shown that a higher AMY1 copy number can increase protein concentration and improve enzyme activity in saliva.15 Therefore, people with a higher copy number of AMY1 can better decompose large starch molecules into smaller ones, increasing the transfer rate from starch intake into blood glucose, thus leading to a higher postprandial blood glucose level.16 But this assumption was inconsistent with the result in our study. If lower AMY1 CNV led to lower starch transfer rate of glucose, postprandial blood glucose would show a relatively high value and postponed peak level instead of earlier peak and recovered to fasting level after 2 hours. What we observed agreed with the study made by Farrell’s group that people with higher AMY1 copy numbers had a higher postprandial blood glucose level response, but not with a higher insulin level response.17
There are two ways to explain this. One is that people with a lower AMY copy number rely more on fatty acid oxidation for energy supply, which reduces the body’s ability to absorb molecular glucose, which may also explain why people with a lower AMY1 copy number are more easily overweight or obese.18 This hypothesis has recently been supported by research made by Nakajima, which showed that women with lower serum salivary amylase had a lower RQ.19 Second, according to another research, people with a lower AMY copy number had a poorer ability to digest part of the starch intake, leading to excretion instead of utilization.20 The second hypothesis could be supported by a recent study, which showed that people with a lower AMY1 copy number tend to have higher levels of methane in the intestinal tract, which would reduce oxygen concentration, thus hindering carbohydrate metabolism in the human body.21 However, both assumptions indicated that people with lower AMY1 copy number might have problems in starch digestion and utilization.
For different AMY1 CNV groups, the energy source (glucose or starch) was an essential interactive factor affecting the change in insulin level due to the sudden drop of insulin level at 30 min of the LCNV group after starch intake. Compared to glucose intake, no further difference was found in the peak value or ΔAUC of Insulin between the LCNV and HCNV groups. This result is consistent with our previous results related to blood glucose levels that starch intake cannot increase blood glucose level,22 suggesting the possibility that people with low AMY1 CNV have difficulty in starch digesting and utilizing. This indication can be supported by Zhan’s research, which has proved that patients younger than 45 with metabolic syndrome had a relatively lower AMY1 copy number.23
After 30 minutes of aerobic exercise, unlike in the resting condition, no differences were shown between the two groups in the trend change in blood glucose and insulin levels after starch intake. It seemed that aerobic exercise helped with the increase in postprandial blood glucose levels after starch intake, leading to the stimulation of insulin secretion. Studies have shown that aerobic exercise was able to increase saliva protein activity and levels.24 Because starch utilization tended to be similar after aerobic exercise between the two groups, we assumed that aerobic exercise stimulated more saliva activity in the LCNV group than in the HCNV group, which contributed to better complex carbohydrate digestion and absorption, and benefit people with lower AMY1 copy number by better starch digestion and absorption. By increasing the metabolism rate, excess post-exercise oxygen consumption may also play an important role in the rise of the post postprandial glucose level in the LCNV group.25
Limitation of the Study
In our study, we did not perform a statistical analysis of the exercise metabolism in different AMY1 CNV groups, leading to the consequence that we lacked some data in the discussion part and could only draw conclusions through hypotheses.
Conclusion
To conclude, our study reports that a lower AMY1 CNV could be a non-invasive biomarker associated with the risk factors of T2DM and interestingly aerobic exercise can reduce this risk by increasing the starch utilization rate.
Acknowledgments
Our study complies with the Declaration of Helsinki. We thank Shengju Chen and Shuangshuang Zhang for their contribution during data collection and all the participants involved in this study.
Disclosure
The authors report that there are no conflicts of interest in this work.
References
1. Harris MI, Flegal KM, Cowie CC, et al. Prevalence of diabetes, impaired fasting glucose, and impaired glucose tolerance in U.S. adults: the third national health and nutrition examination survey, 1988–1994. Diabetes Care. 1998;21(4):518–524. doi:10.2337/diacare.21.4.518
2. Sereday MD, Gonzalez C, Giorgini D, et al. Prevalence of diabetes, obesity, hypertension and hyperlipidemia in the central area of Argentina. Diabetes Metab. 2004;30(4):335–339. doi:10.1016/S1262-3636(07)70125-8
3. Sinha R, Fisch G, Teague B, et al. Prevalence of impaired glucose tolerance among children and adolescents with marked obesity. N Engl J Med. 2002;346(11):802–810. doi:10.1056/NEJMoa012578
4. Pan XR, Li GW, Hu YH, et al. Effects of diet and exercise in preventing NIDDM in people with impaired glucose tolerance: the Da Qing IGT and diabetes study. Diabetes Care. 1997;20(4):537–544. doi:10.2337/diacare.20.4.537
5. Gregg EW, Sattar N, Ali MK. The changing face of diabetes complications. Lancet Diabetes Endocrinol. 2016;4(6):537–547. doi:10.1016/S2213-8587(16)30010-9
6. Tuomilehto J, Lindström J, Eriksson JG, et al. Prevention of type 2 diabetes mellitus by changes in lifestyle among subjects with impaired glucose tolerance. N Engl J Med. 2001;344(18):1343–1350. doi:10.1056/NEJM200105033441801
7. Wing RR, Venditti E, Jakicic JM, et al. Lifestyle intervention in overweight individuals with a family history of diabetes. Diabetes Care. 1998;21(3):350–359. doi:10.2337/diacare.21.3.350
8. Florez JC, Udler MS, Hanson RL, et al. Genetics of type 2 diabetes. In: Diabetes in America.
9. Malecki MT. Genetics of type 2 diabetes mellitus. Diabetes Res Clin Pract. 2005;68:S10–S21. doi:10.1016/j.diabres.2005.03.003
10. Choi YJ, Nam YS, Yun JM, et al. Association between salivary amylase (AMY1) gene copy numbers and insulin resistance in asymptomatic Korean men. Diabetic Med. 2015;32(12):1588–1595. doi:10.1111/dme.12808
11. Liu Y, Smith CE, Parnell LD, et al. Salivary AMY1 Copy Number Variation Modifies Age-Related Type 2 Diabetes Risk. Clin Chem. 2020;66(5):718–726. doi:10.1093/clinchem/hvaa072
12. Mandel AL, Breslin PAS. High endogenous salivary amylase activity is associated with improved glycemic homeostasis following starch ingestion in adults. J Nutr. 2012;142(5):853–858. doi:10.3945/jn.111.156984
13. Alberti G, Parada J, Cataldo LR, et al. Glycemic response after starch consumption in relation to salivary amylase activity and copy-number variation of AMY1 gene. J Food Nutr Res. 2015;3:558–563.
14. Zhang X, Moran C, Wang R, et al. Salivary amylase gene (AMY1) copy number variation has only a minor correlation with body composition in Chinese adults. Genes Genomics. 2023;45(7):935–943. doi:10.1007/s13258-023-01381-x
15. Yang ZM, Lin J, Chen LH, et al. The roles of AMY1 copies and protein expression in human salivary α-amylase activity. Physiol Behav. 2015;138:173–178. doi:10.1016/j.physbeh.2014.10.037
16. Catherine PDG, Breslin PAS, Knop FK, Vilsbøll T. Salivary amylase: digestion and metabolic syndrome. Curr Diab Rep. 2016;16(1):1–7. doi:10.1007/s11892-015-0693-3
17. Farrell M, Ramne S, Gouinguenet P, et al. Effect of AMY1 copy number variation and various doses of starch intake on glucose homeostasis: data from a cross-sectional observational study and a crossover meal study. Genes Nutr. 2021;21:16.
18. Arredouani A, Stocchero M, Culeddu N, et al. Metabolomics profile of low-copy number carriers at the salivary α-amylase gene suggests a metabolic shift toward lipid-based energy production. Diabetes. 2016;65(11):3362–3368. doi:10.2337/db16-0315
19. Nakajima K, Higuchi R, Iwane T, et al. The association of low serum salivary and pancreatic amylases with the increased use of lipids as an energy source in non-obese healthy women. BMC Res Notes. 2020;13(1):237. doi:10.1186/s13104-020-05078-2
20. Rukh G, Ericson U, Andersson-Assarsson J, et al. Dietary starch intake modifies the relation between copy number variation in the salivary amylase gene and BMI. Am J Clin Nutr. 2017;106(1):256–262. doi:10.3945/ajcn.116.149831
21. Poole AC, Goodrich JK, Youngblut ND, et al. Human salivary amylase gene copy number impacts oral and gut microbiomes. Cell Host Microbe. 2019;25(4):553–564. doi:10.1016/j.chom.2019.03.001
22. McArdle WD, Katch FI, Katch VL. Exercise Physiology: Nutrition, Energy, and Human Performance.
23. Zhan F, Chen J, Yan H, et al. Association of serum amylase activity and the copy number variation of AMY1/2A/2B with metabolic syndrome in Chinese adults. Diabetes Metabol Syndrome Obes. 2021;14:4705–4714. doi:10.2147/DMSO.S339604
24. Koibuchi E, Suzuki Y. Exercise upregulates salivary amylase in humans (Review). Exp Ther Med. 2014;7(4):773–777. doi:10.3892/etm.2014.1497
25. Maehlum S, Grandmontagne M, Newsholme EA, et al. Magnitude and duration of excess postexercise oxygen consumption in healthy young subjects. Metabolism. 1986;35(5):425–429. doi:10.1016/0026-0495(86)90132-0
 © 2023 The Author(s). This work is published and licensed by Dove Medical Press Limited. The full terms of this license are available at https://www.dovepress.com/terms.php and incorporate the Creative Commons Attribution - Non Commercial (unported, v3.0) License.
By accessing the work you hereby accept the Terms. Non-commercial uses of the work are permitted without any further permission from Dove Medical Press Limited, provided the work is properly attributed. For permission for commercial use of this work, please see paragraphs 4.2 and 5 of our Terms.
© 2023 The Author(s). This work is published and licensed by Dove Medical Press Limited. The full terms of this license are available at https://www.dovepress.com/terms.php and incorporate the Creative Commons Attribution - Non Commercial (unported, v3.0) License.
By accessing the work you hereby accept the Terms. Non-commercial uses of the work are permitted without any further permission from Dove Medical Press Limited, provided the work is properly attributed. For permission for commercial use of this work, please see paragraphs 4.2 and 5 of our Terms.