Back to Journals » Diabetes, Metabolic Syndrome and Obesity » Volume 15
EAT Thickness as a Predominant Feature for Evaluating Arterial Stiffness in Patients with Heart Failure with Preserved Ejection Fraction
Authors Liu Z, Hu W, Zhang H, Tao H, Lei P, Liu J, Yu Y, Dong Q, Gao L, Zhang D ![]()
Received 29 December 2021
Accepted for publication 11 April 2022
Published 21 April 2022 Volume 2022:15 Pages 1217—1226
DOI https://doi.org/10.2147/DMSO.S356001
Checked for plagiarism Yes
Review by Single anonymous peer review
Peer reviewer comments 2
Editor who approved publication: Professor Ming-Hui Zou
Zhiqiang Liu, Weiwei Hu, Hanwen Zhang, Hongmei Tao, Peng Lei, Jie Liu, Yali Yu, Qian Dong, Lei Gao, Dongying Zhang
Department of Cardiovascular Medicine, The First Affiliated Hospital of Chongqing Medical University, Chongqing, People’s Republic of China
Correspondence: Dongying Zhang; Lei Gao, Email [email protected]; [email protected]
Objective: Heart failure with preserved ejection fraction (HFpEF) is an intricacy heterogeneous syndrome. However, the association between EAT and arterial stiffness in HFpEF patients remains unknown.
Methods: A total of 102 patients were enrolled into the study, and brachial-ankle pulse-wave velocity (baPWV), epicardial adipose tissue (EAT) and body composition were assessed. Linear regression analysis was carried out to model the relationship between variables (especially EAT thickness) and baPWV.
Results: The results showed that patients with the thicker EAT fat pad (≥ 3.55 mm) tended to have comorbidities of hypertension, coronary artery disease (CAD), diabetes and hyperlipidemia, also with a higher level of obesity, fasting blood glucose (FBG), glycosylated hemoglobin (HbA1c), total cholesterol (TC) and triglyceride (TG). The level of baPWV was higher in EAT ≥ 3.55 mm group than the other group. BaPWV was positively associated with EAT, age, heart rate, waist circumference, visceral fat area, systolic and diastolic blood pressure, CRP and FBG. After adjusting for EAT, age and visceral fat area, EAT thickness (β = 0.256, P = 0.009) and visceral fat area (β = 0.229, P = 0.036) significantly associated with baPWV.
Conclusion: The study assessed for the first time that the increased EAT thickness was closely related with baPWV in HFpEF patients, suggesting patients with the thicker EAT may be independently associated with arterial stiffness under the context of HFpEF.
Keywords: HFpEF, epicardial adipose tissue, baPWV, artery stiffness
Introduction
Heart failure with preserved ejection fraction (HFpEF) is typically a syndrome with pathophysiological heterogeneity, challenging the diagnosis and the efficient treatments.1 The heterogeneous syndrome is more than a representation of left ventricular diastolic dysfunction, but with complicated etiologies including limitations in left ventricular systolic reserve, systemic and pulmonary vascular function, nitric oxide (NO) bioavailability, chronotropic reserve, right heart function, autonomic tone, left atrial function, and peripheral impairments.2
Another important consideration is the pathological effects of vascular abnormalities in HFpEF. Vascular abnormalities are important factors promoting the progression of HFpEF with the prominent feature of increased arterial stiffness.3,4 The upregulation of nonmuscle myosin and the downregulation in sensitivity to NO-mediated vasodilation are common traits in HFpEF. These changes contribute directly to vascular tone, leading to increased contractility and force, resulting in an increase in arterial stiffness, which will ultimately produce cardiac hypertrophy, remodeling and failure.5 Brachial-ankle pulse-wave velocity (baPWV), as a non-invasive method for assessing arterial stiffness, is wildly used by researchers for assessing arterial stiffness related risks. Also, baPWV is reported to be independently associated with cardiovascular events in HFpEF patients.3,6–8
Obesity is one of the distinctive pathophysiologic and phenotypic characteristics of HFpEF.9,10 Its metabolic sequelae can increase nitroso-oxidative stress and thereby limit NO bioavailability in the heart and vasculature.2 Studies have reported that obesity is associated with arterial stiffness in obese or overweight subjects without overt cardiovascular disease.11 However, beyond generalized obesity, fat distribution, especially the accumulation on epicardial adipose tissue (EAT) may have a more profound impact on the pathophysiologic changes of HFpEF.12,13 Previous studies have found that EAT thickness was correlated with arterial stiffness in patients with hypertension, diabetes and non-alcoholic fatty liver disease, respectively.14–17 As a heterogeneous disease, HFpEF always combined with obesity, hypertension, diabetes, and other metabolic disorder or organ dysfunction.1 Whereas, the association between EAT and arterial stiffness in HFpEF patients remains unknown. Here, the study aims to evaluate the relationship between EAT and arterial stiffness in the context of HFpEF.
Patients and Methods
Study Design and Study Subjects
The study enrolled 135 patients who were diagnosed with HFpEF and admitted to the Cardiology Department of the First Affiliated Hospital of Chongqing Medical University from Oct. 2020 to Jan. 2021. All the patients fulfilled the inclusion criteria of a clear diagnosis with HFpEF according to the HFA-PEFF and H2FPEF diagnostic algorithm18,19 and agreed to participate with a written informed consent. Patients with the history of infection, carcinoma, hepatic insufficiency, congenital heart disease, peripheral arterial disease and isolated right-sided heart failure were excluded. Patients without baPWV (n=16) and EAT (n=17) results were also excluded. According to the above inclusion and exclusion criteria, 102 patients were finally enrolled in the study (Figure 1). Demographic data, comorbidities, personal history, vital signs and laboratory examinations were collected by medical history system. All the data was collected using a same protocol by well-trained researchers with a double-blind method. This study was conducted in accordance with the Declaration of Helsinki and was approved by the ethics committee of the First Affiliated Hospital of Chongqing Medical University (No. 2020–606) and registered in clinicaltrials.gov with an identifier of NCT04594499.
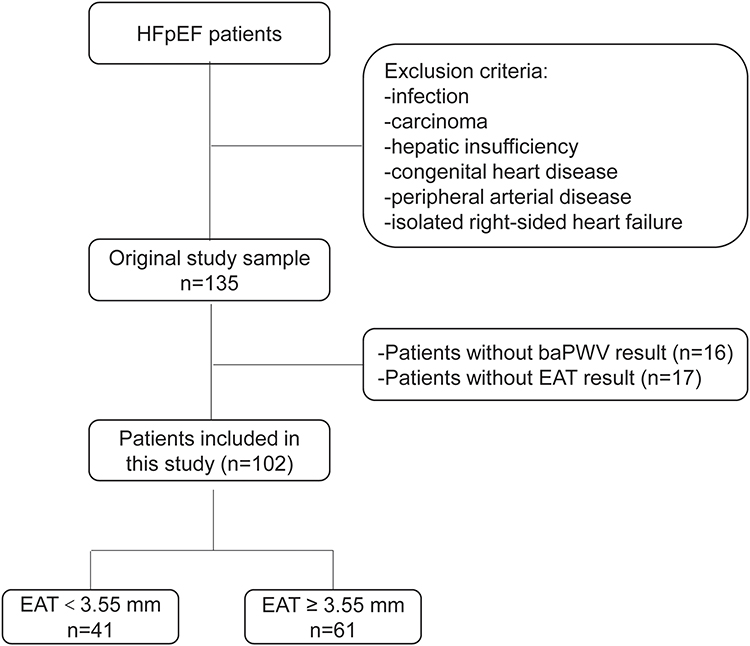 |
Figure 1 Population selection flow diagram. Notes: Infection was defined as pneumonia, bacteremia, sepsis or unknown causes with white blood cell (WBC)> 15×109/L and procalcitonin (PCT) >2.5 ng/mL. Hepatic insufficiency was defined as alanine aminotransferase (ALT) and aspartate aminotransferase (AST) > 3 times of upper limit of normal (ULN) value. |
Measurement of the EAT Thickness
The thickness of EAT was measured on the free wall of the right ventricle (RV) by echocardiography in the parasternal long-axis view as previously described12 by color ultrasound diagnostic apparatus (AU11403, Vivid E95, USA, Figure 2). All the echocardiography examinations were performed by a fixed researcher who was blinded to the study. The thickness of EAT was recorded for three cardiac cycles and the average value was used for statistical analysis. EAT in 15 randomly selected subjects was remeasured by the same echocardiologist three days later. The coefficient of intra-observer variation was 4.4%.
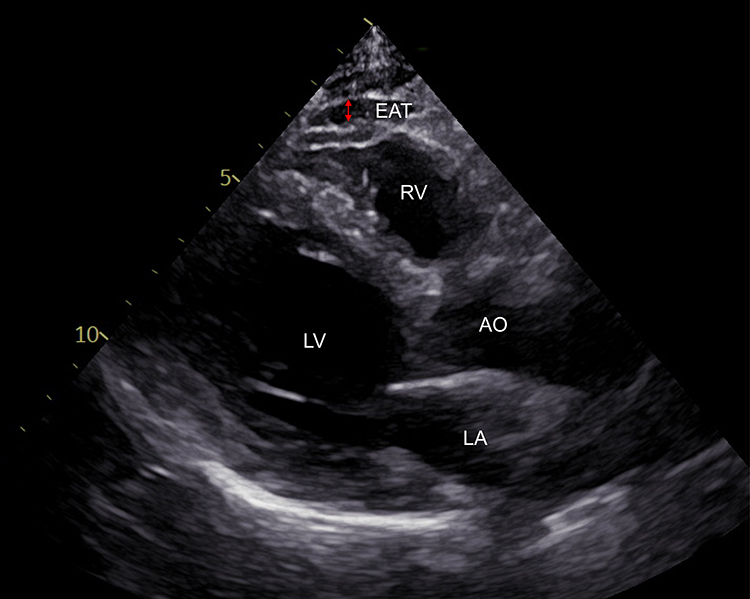 |
Figure 2 Ultrasound diagnostic apparatus assessment of epicardial adipose tissue (EAT) which was marked by the red arrow. Abbreviations: LV, left ventricle; LA, left atrium; AO, aorta; RV, right ventricle. |
Measurement of baPWV
BaPWV is a validity, reproducibility, and clinical significance of noninvasive way to evaluation arterial stiffness.20 BaPWV was measured by a fully automatic waveform analyzer according to the operating manual (BP-203RPEIII, OMRON, China). The blood pressure and arterial pulse wave of bilateral femoral arteries and ankle joints were measured at the same time. Briefly, the subjects were examined in the supine position after lying in bed for at least 5 minutes. The inflatable cuff was wrapped around the upper arm and ankle and connected to the plethysmography sensor to determine the volume pulse waveform. After sampling, baPWV was measured automatically by the integrated software. The baPWV coefficient of intra-observer variation was 2.6%. The average value of both sides baPWV was used for analysis, and the reference for determining arterial stiffness was baPWV above 1500cm/s.
Body Composition
The body composition was measured by the body composition analyzer (DBA-210, DONGHWA, China) with medical institution registration certificate number of 20202070083. The subjects were asked to stand barefoot vertically on the body composition analyzer, hold the dual measurement arms of the analyzer with both hands at an angle of 30–40 degrees with the body. After the automatic measurement, data including visceral fat area, body fat mass, fat percentage, obesity degree and body weight were obtained. The coefficient of intra-observer variation of visceral fat area, body fat mass and fat percentage were 4.1%, 4.2%, 4.7%, respectively. Waist, hip and abdominal circumferences were measured by a soft ruler with an inelastic minimum scale of 1mm. Waist circumference (WC) was measured in a standing position and the ruler was just above the hip bone without pressing the skin. In the same way, hip circumference was measured in front of the pubic symphysis and at the most protruding part of the gluteus maximus muscle around the hip. The abdominal circumference (AC) was measured horizontally around the umbilicus.
Statistical Analyses
Continuous variables were tested for normality by using Kolmogorov–Smirnov test (K–S test) or Shapiro–Wilk test (S-W test). Data with a normal distribution were presented as mean ± standard deviation, and data with a skewed distribution were presented as median with interquartile ranges. Receiver operating characteristic curve (ROC) was used to screen the best cut-off of EAT thickness for diagnosing arterial stiffness defined by baPWV≥1500 cm/s. Intergroup comparison between HFpEF with EAT thickness<3.55 mm (EAT<3.55 mm group) and with EAT thickness ≥3.55 mm (EAT≥3.55 mm group) were made by the independent-samples t-test (normally distributed continuous variables), Mann–Whitney U-test (nonnormally distributed continuous variables) and chi-square test (categorical variables). Pearson or Spearman correlation coefficients were used to measure the strength of the relationship between EAT thickness and variables according to the distribution. Linear regression analysis was carried out to model the relationship between the independent variables and the dependent variable with “enter” as the variable filtering method. Data analyses were performed using SPSS version 24.0 (SPSS, Chicago, IL, USA).
Results
Receiver Operator Characteristic (ROC) Curve for Prediction Arterial Stiffness
The arterial stiffness was defined as the mean value of baPWV above 1500 mm/s. Receiver operation characteristic (ROC) curves were shown in Figure 3 to examine the diagnostic value and the best cut-off of EAT thickness for prediction arterial stiffness. The area under the curve (AUC) for arterial stiffness was 0.759 (95% CI 0.645–0.873, P <0.001). The best cut-off of EAT thickness to predict arterial stiffness was 3.55 mm with 67.1% sensitivity and 70.0% specificity (Figure 3).
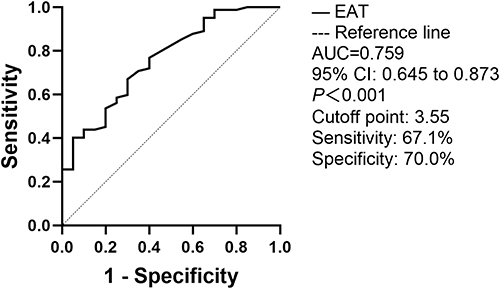 |
Figure 3 The receiver operating characteristic (ROC) curve of the EAT for predicting arterial stiffness. Notes: The area under the curve (AUC) for arterial stiffness was 0.759. The best cut-off of EAT thickness to predict arterial stiffness was 3.55 mm with the sensitivity of 67.1% and the specificity of 70.0% (95% CI 0.645-0.873). |
Clinical Characteristics
A total of 102 participants were eligible for the study. Patients were assigned into two groups according to the thickness of EAT. Patients with the thicker EAT fat pad (≥3.55 mm) tended to have comorbidities of hypertension, coronary artery disease (CAD), diabetes and hyperlipidemia (P<0.05). There was a tendency that patients with the thicker EAT were more likely combined with obesity reflected by waist circumference, waist to hip ratio, AC, body mass index (BMI), body fat mass, visceral fat area, fat percentage and obesity degree (P<0.05). Patients in EAT≥3.55 mm group had higher levels of fasting blood glucose (FBG), glycosylated hemoglobin (HbA1c), total cholesterol (TC) and triglyceride (TG) than the EAT<3.55mm group. The level of baPWV was higher in EAT≥3.55 mm group than that in the other group (P=0.002). The H2FPEF and HFA-PEFF scores were significantly higher in EAT≥3.55 mm group compared with those in the other group (P<0.001, Table 1). Other characteristics including gender, age, whether had a history of smoking or alcohol consumption, heart rate, blood pressure, echocardiogram (including parameters of E, e’, E/e’, LAVI, LVMI and EF), c-reactive protein (CRP), white blood cells (WBC), neutrophils, triglyceride, low-density lipoprotein (LDL) had no significant difference between two groups (Table 1).
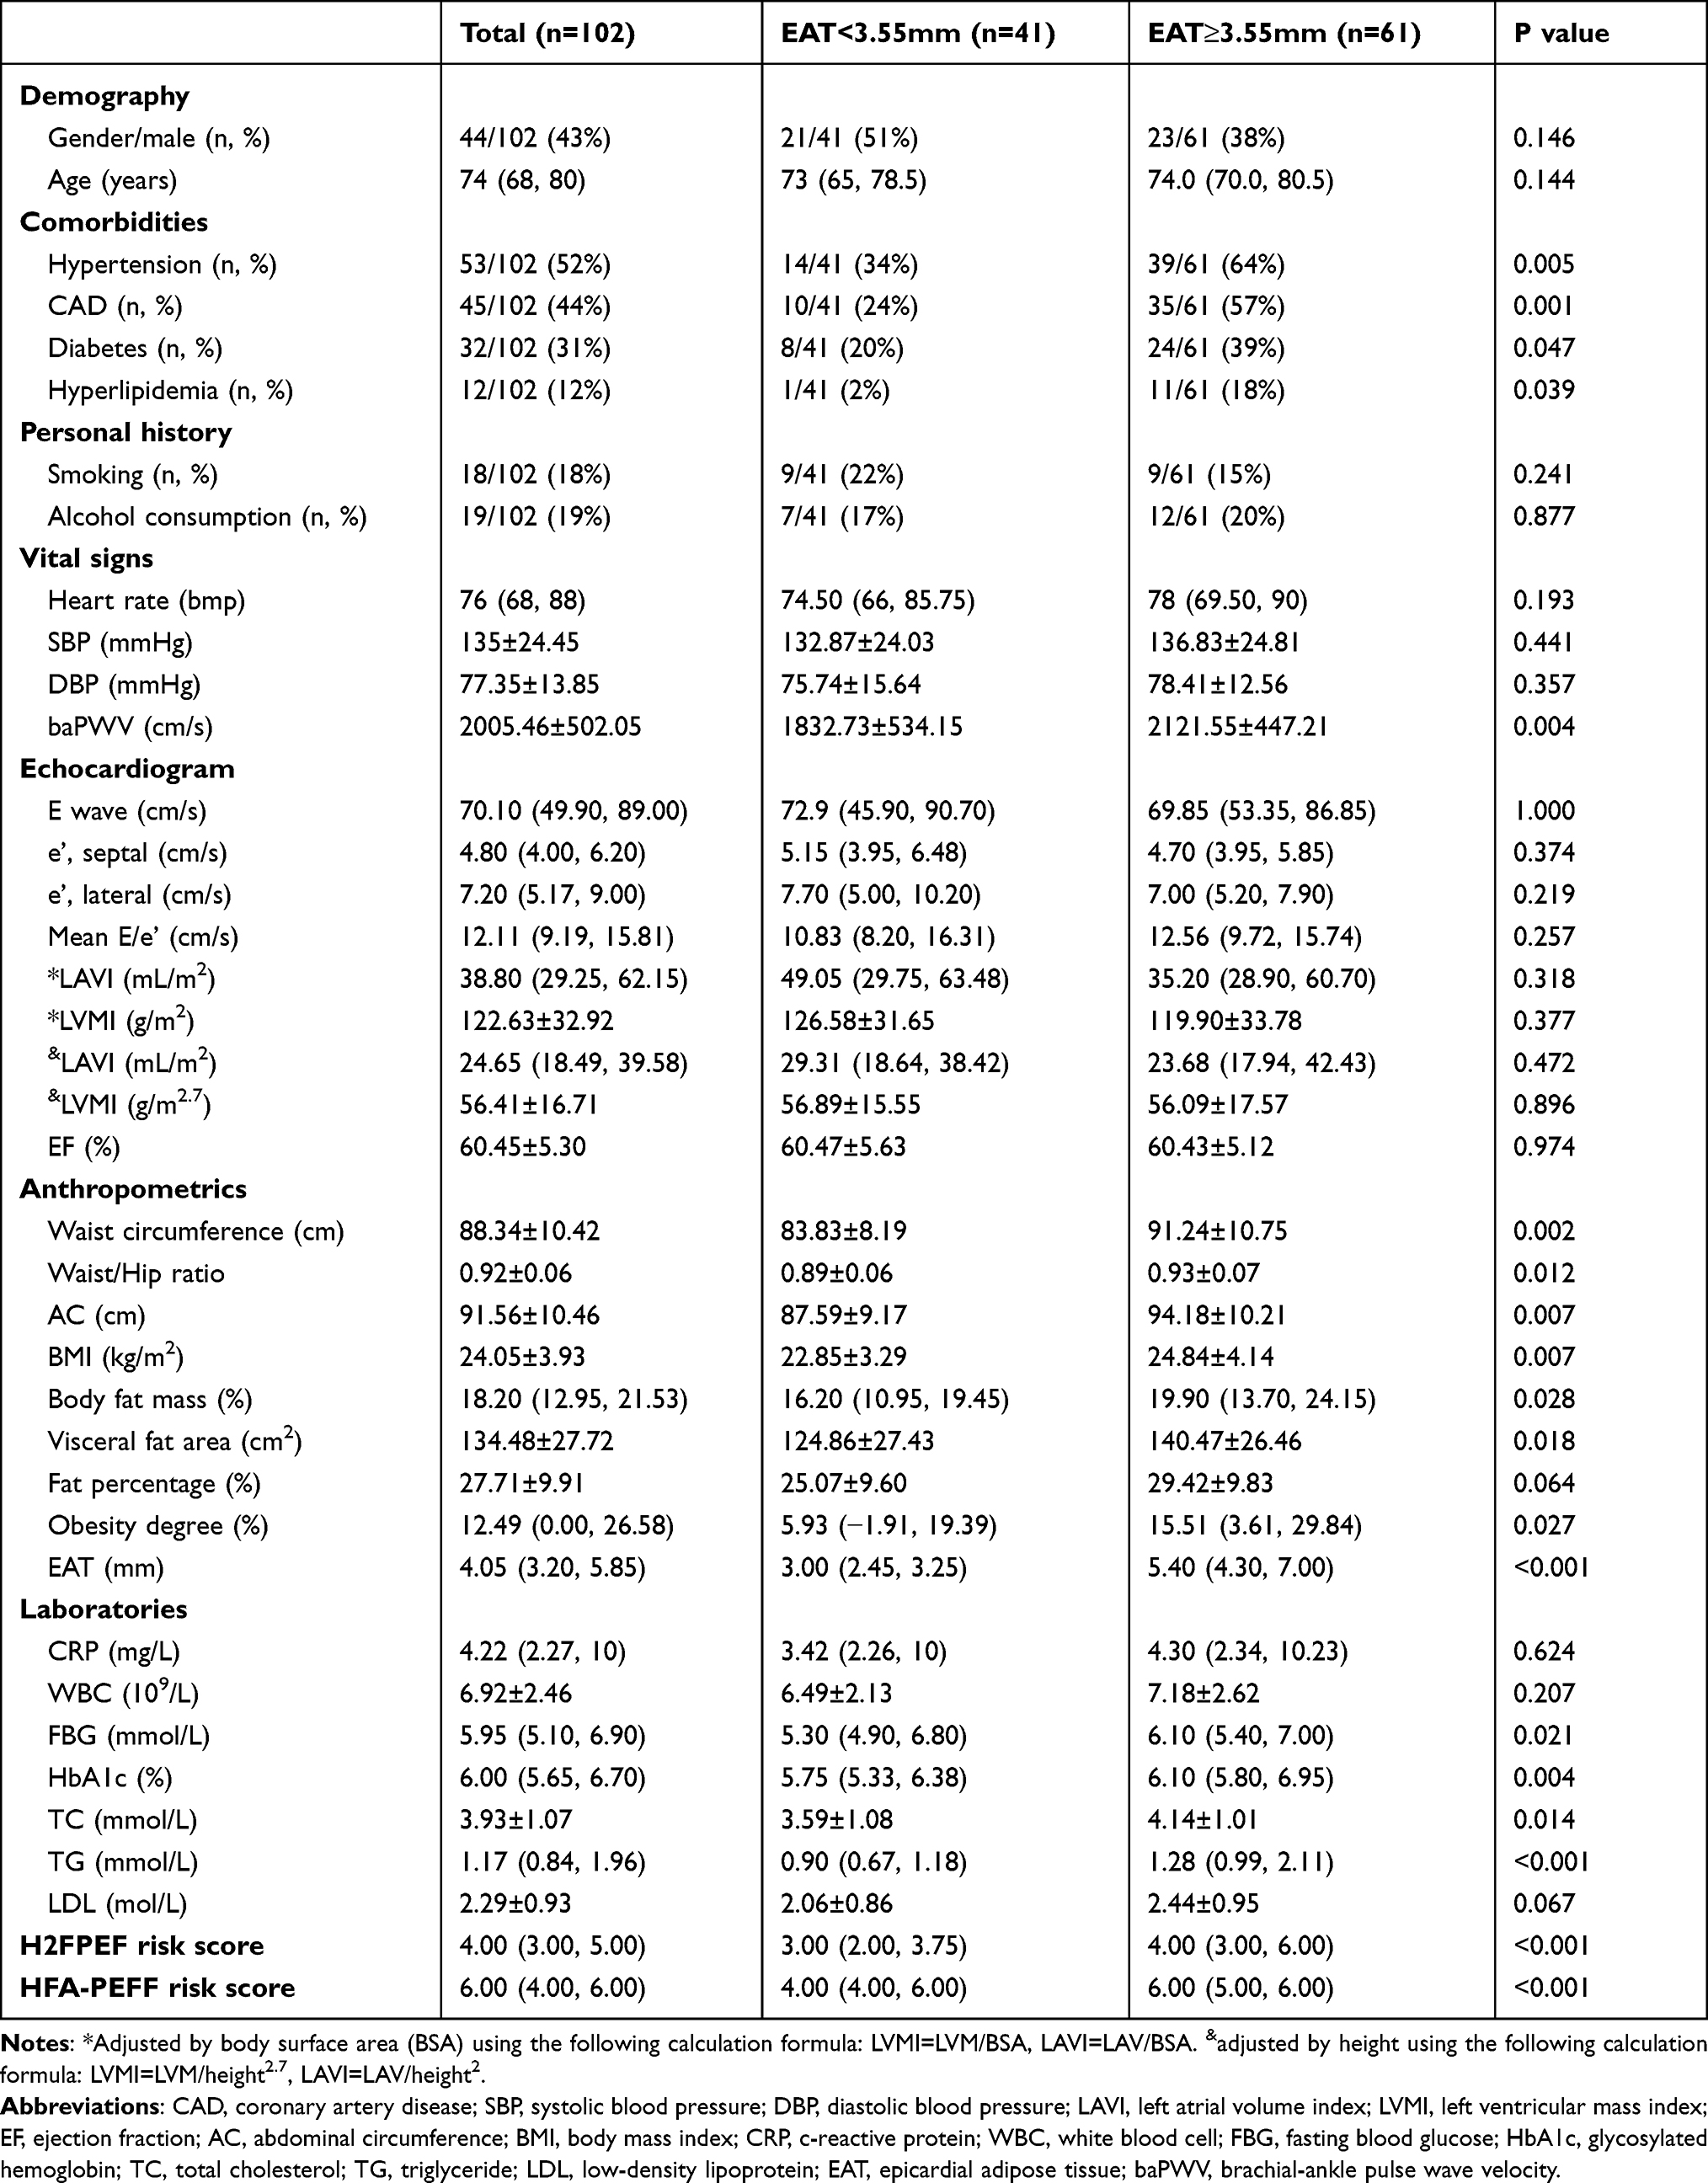 |
Table 1 Characteristics of the Study Population According to EAT Thickness |
Correlation Analysis Among EAT, baPWV and Selected Variables
EAT was positively correlated with baPWV, BMI, waist circumference, waist to hip ratio, body fat mass, visceral fat area, fat percentage, obesity degree, FBG, HbA1c, TC and TG (P<0.05). BaPWV was positively associated with EAT, age, heart rate, waist circumference, visceral fat area, systolic and diastolic blood pressure, CRP and FBG (P<0.05, Table 2, Supplementary Figure 1). Univariate linear regression was applied to analyze the associations between baPWV and absolute variables shown in Supplementary Table 1. Results revealed that a history of hypertension (β=0.244, P=0.017) and coronary artery disease (CAD, β=0.255, P=0.014) were significantly associated with baPWV.
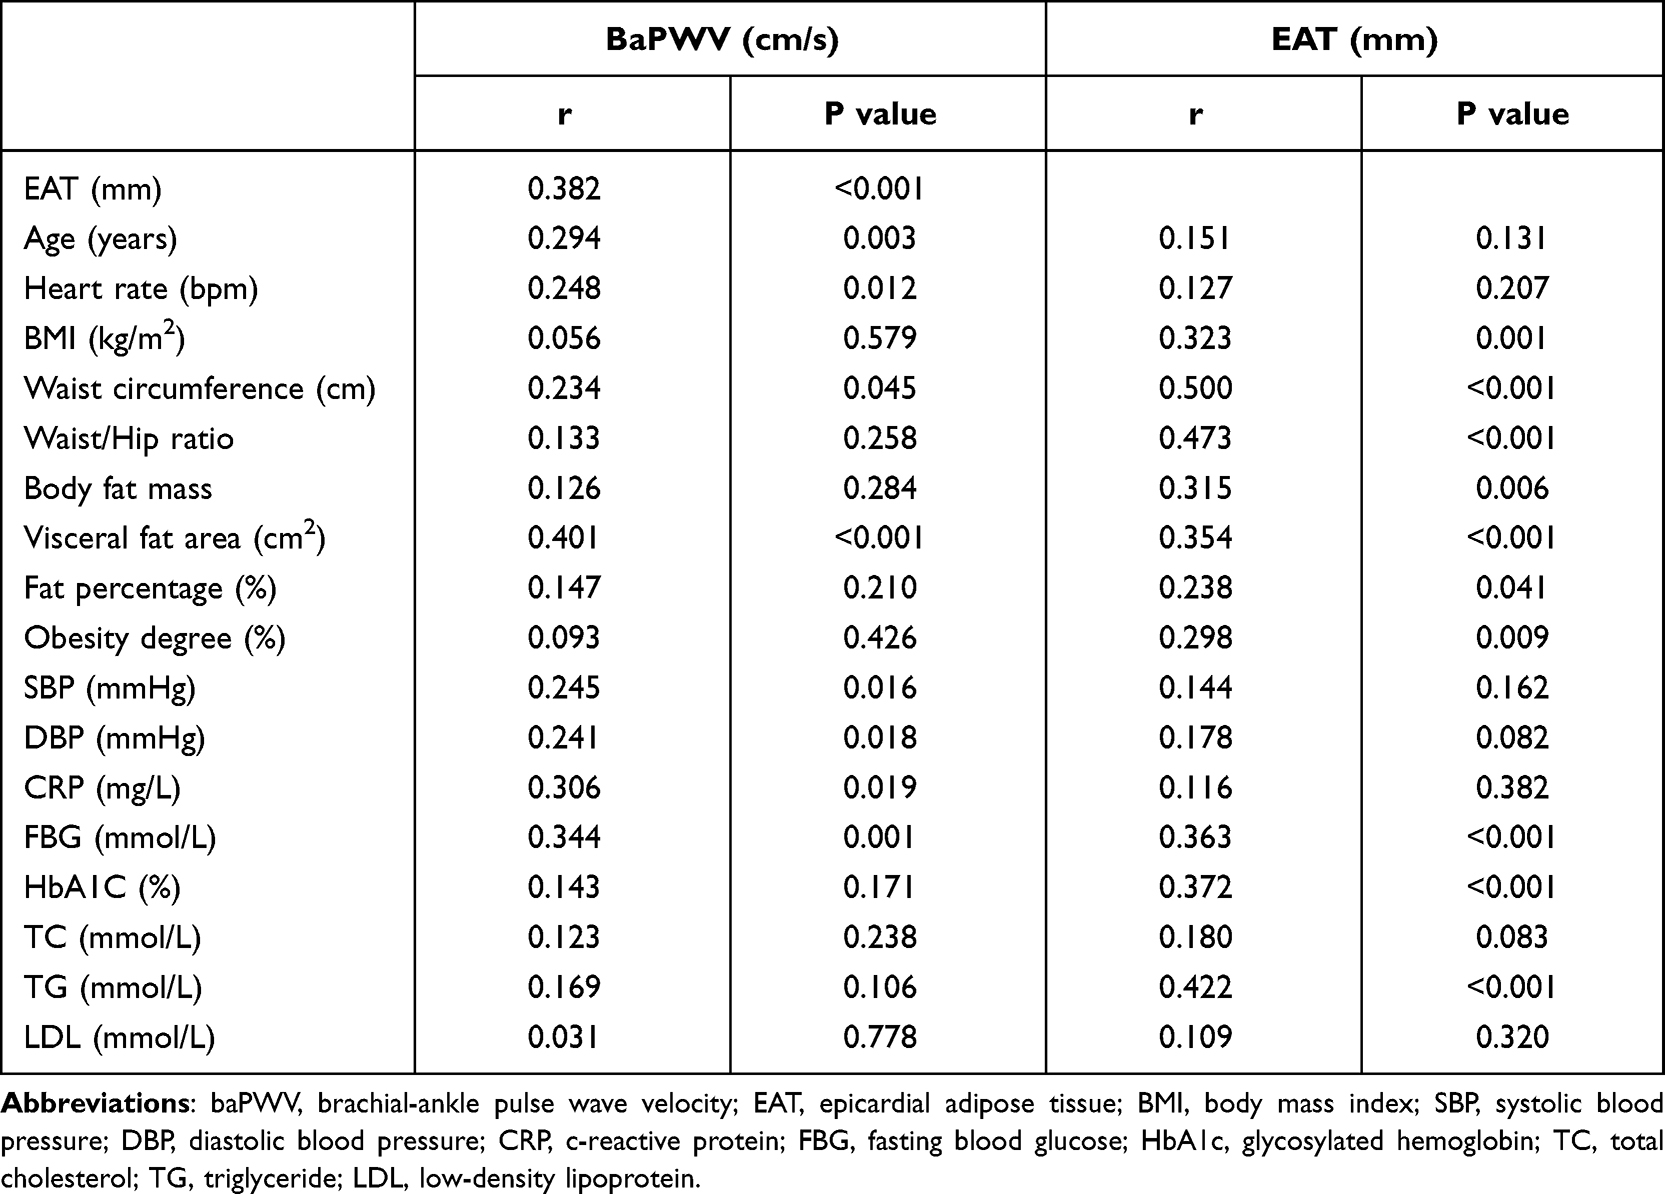 |
Table 2 Correlation Analysis Among Epicardial Fat Thickness, baPWV, and Other Variables |
Multiple Linear Regression Analysis with baPWV as the Dependent Variable
An enter multiple linear regression model was developed in 6 separate models, with baPWV as the dependent variable and EAT, age, gender, hypertension, CAD, heart rate, systolic blood pressure, diastolic blood pressure, waist circumference, visceral fat area, CRP and FBG as independent variables (Table 3). In Model 1, EAT thickness (β=0.292, P=0.002) and age (β=0.274, P=0.004) predicted baPWV. In Model 2, 3 and 5, EAT thickness was the only significant predictor to baPWV. In Model 4, EAT thickness (β=0.361, P=0.004) and visceral fat area (β=0.379, P=0.014) were predictors to baPWV. After adjusting for EAT, age and visceral fat area, EAT thickness (β=0.256, P=0.009) and visceral fat area (β=0.229, P=0.036) predicted baPWV (Model 6, Table 3).
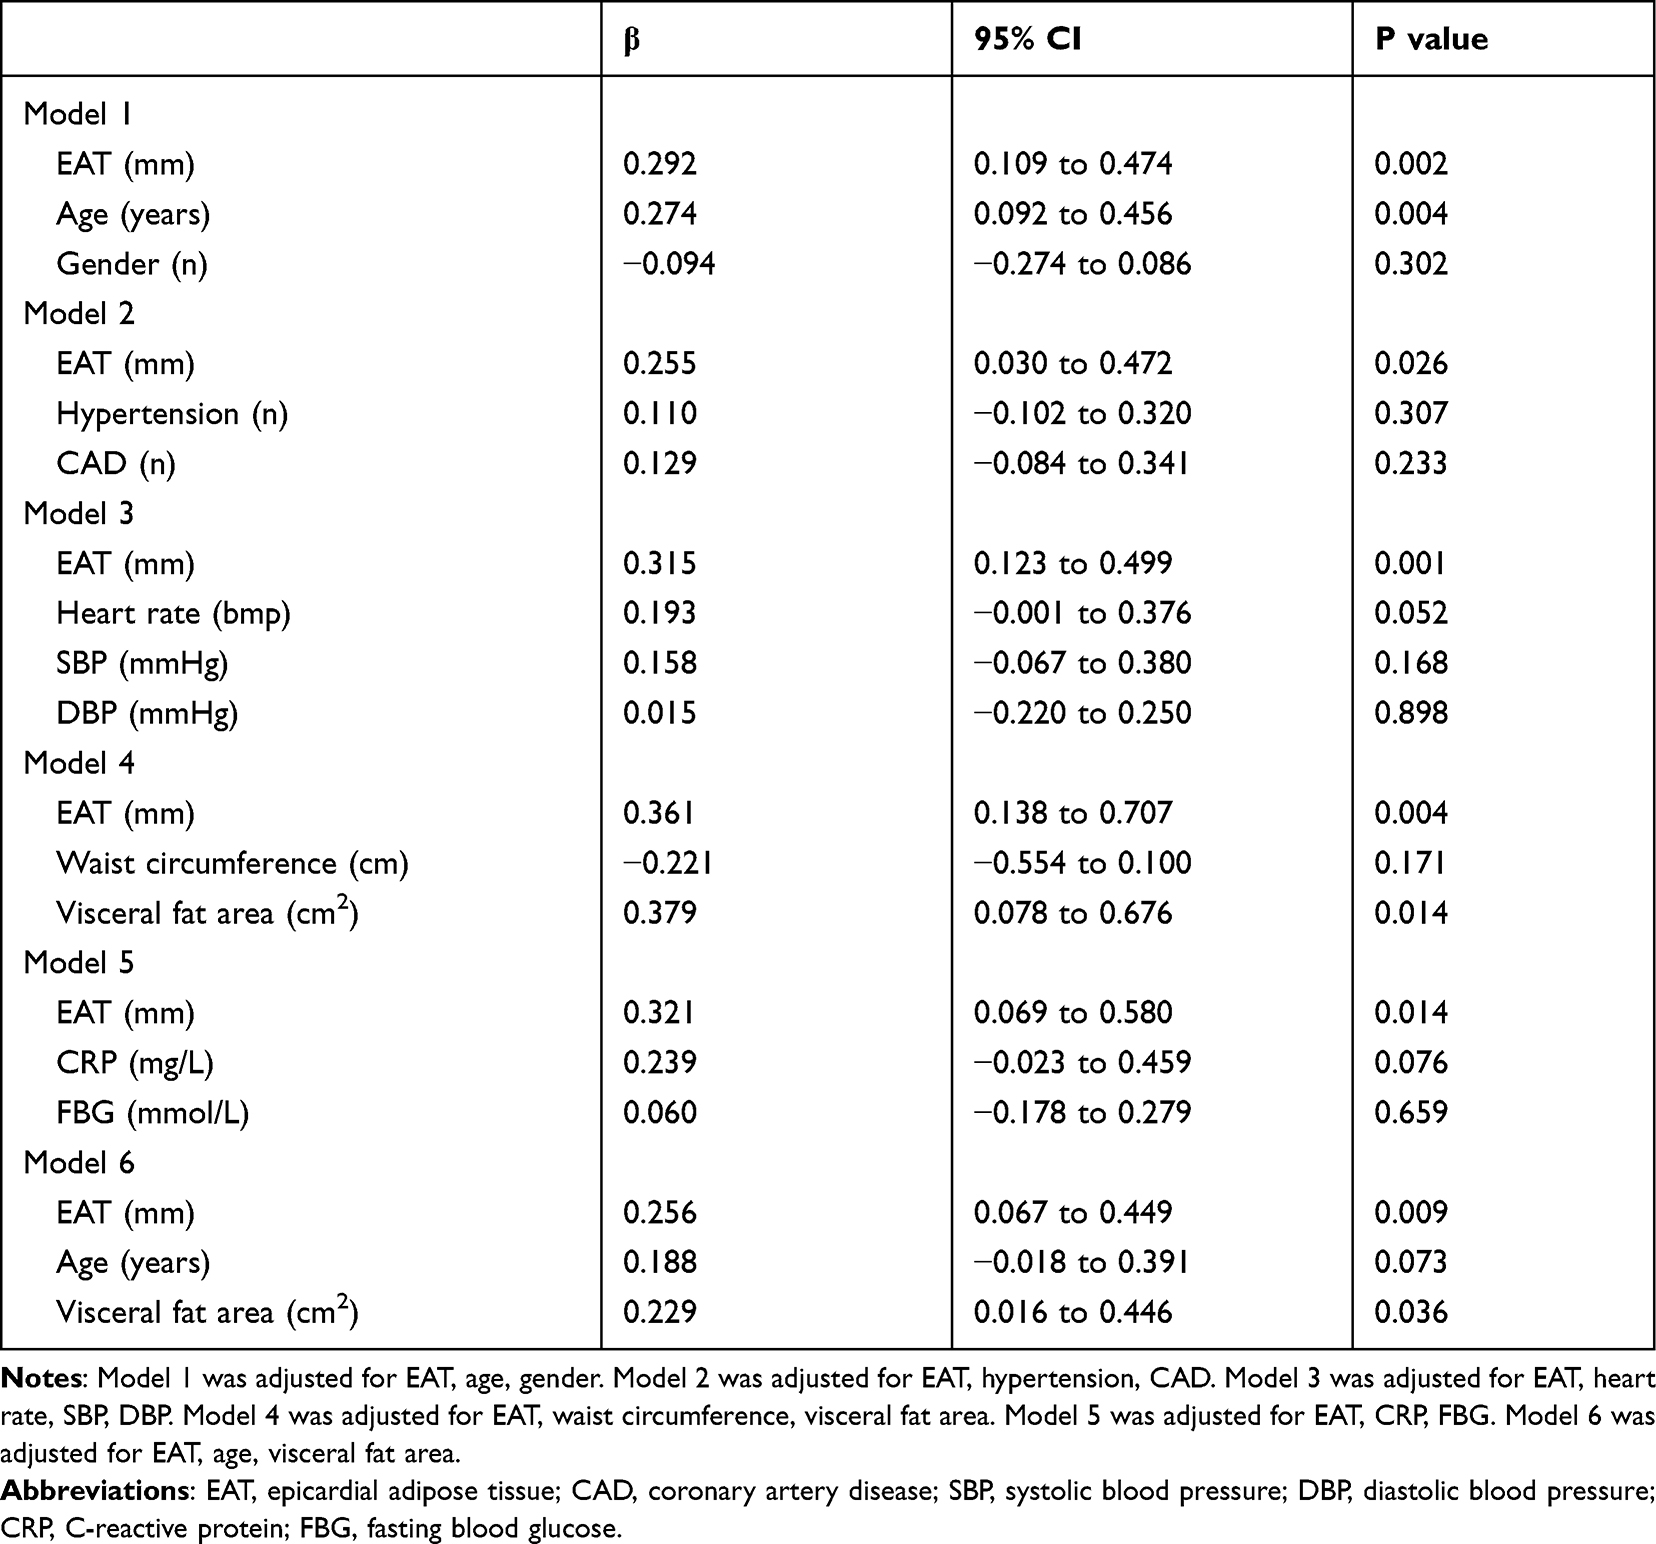 |
Table 3 Multivariate Linear Regression Analysis for the Effect of Epicardial Fat Thickness on the Absolute Value of baPWV |
Discussion
The study assessed for the first time that the increased EAT thickness was closely related with baPWV in HFpEF patients, suggesting patients with the thicker EAT may be independently associated with arterial stiffness under the context of HFpEF.
Knowledge is limited to elucidate thoroughly the mechanism of how HFpEF was affected by EAT. In our study, HFpEF patients with thicker EAT were prone to having more comorbidities including hypertension, CAD, diabetes and hyperlipidemia as were shown in Table 1. Importantly, there was a positive correlation between EAT thickness and baPWV (Table 2). These indicated that HFpEF patients with thicker EAT might suffer more pressure load and metabolic stress on myocardium. But no significant difference was observed in left ventricular structure and function between EAT<3.55mm group and the thicker group (Table 1), which was also reported by previous studies.12,13 Interestingly, the EAT thickness was significantly associated with cardiac hemodynamic changes during exercise, with the higher right-sided filling pressures and reduced exercise capacity, which were considered as the main feathers of HFpEF.12,13 The H2FPEF and HFA-PEFF scores have been proposed to be useful markers for HFpEF and predicting outcomes.21,22 In our study, the thicker EAT was evidently associated with higher H2FPEF score and HFA-PEFF score, suggesting that EAT might probably serve as an indicator for the severity and prognosis of HFpEF.
The mechanism of how EAT affected HFpEF via artery stiffness was still not clear. A considerable hypothesis might be the endocrine feature of EAT which releases cytokines, adipokines, microRNAs, and cellular mediators, resulting in a potent detrimental effect on vascular tone.23–25 The impaired compliance of the artery then adds cardiac afterload, leading to the cardiac incompliance and limiting the cardiac reserve. Those pathophysiological mechanisms might partly explain why patients with HFpEF do not have symptoms of congestion in pulmonary and systemic circulation, whereas complicate with reduced activity tolerance.
Obesity is one of the distinct features of HFpEF patients. As part of visceral adipose tissue (VAT) components, EAT was well associated with BMI as previously reported.12,13 In the present study, the body components including BMI, waist circumference, waist to hip ratio, body fat mass, visceral fat area, fat percentage and obesity degree were all positively related to the EAT thickness. But only the waist circumference and the visceral fat area were associated with baPWV (Table 2). Furthermore, multivariate linear regression analysis demonstrated that EAT and visceral fat area were independently related with arterial stiffness (model 4 and 6, Table 3). The above results indicated that both EAT and VAT might contribute to arterial stiffness, leading to the progress of HFpEF.
Previous research reported that pericardial adipose tissue (PAT) at baseline was correlated with visceral fat area, liver fat, and insulin resistance in overweight women.26 Longitudinally, after a weight control, the above associations were lost but only the loss of PAT was correlated with visceral fat area,26 suggesting that PAT was closely linked with VAT. The EAT has similar traits with PAT due to its close anatomic relationships,27 indicating the EAT might also gain with VAT under pathological environment. Physiologically, though EAT, VAT and subcutaneous adipose tissue were significantly correlated with arterial stiffness reported in an asymptomatic population, only EAT was independently correlated with arterial stiffness after linear regression.28 However, in the pathological context of HFpEF, whether the function of EAT on arterial stiffness might exceed the effect of VAT need to be further explored.
From the present study, we evaluated the association between the increased EAT thickness and baPWV in patients with HFpEF. The findings suggest that echocardiographic EAT thickness could provide information on assessing subclinical target organ damage in HFpEF patients. HFpEF patients with increasing EAT should receive more attention to reduce unfavorable cardiovascular risk factors. In the present study, we were not aimed to show how could EAT transcend the classic indicators such as baPWV, flow-mediated dilation (FMD) and cardio-ankle vascular index (CAVI). We provided a suggestion to focus the thickness of EAT during echocardiogram practice in patients with HFpEF that may be an indicator of higher stiffness of the arteries. Further investigation is necessary to understand the function of EAT, and to illustrate its mechanism leading to the increase of arterial stiffness, as well as the progression of HFpEF. Targeting EAT and regulating the balance of its secretions might be one potential way to control heart failure in the future.
Conclusions
In conclusion, the increased EAT thickness was closely related with baPWV in HFpEF patients, suggesting patients with the thicker EAT may be independently associated with arterial stiffness under the context of HFpEF.
Data Sharing Statement
Data will be available from the corresponding author (email: [email protected]) upon reasonable request.
Acknowledgment
We would like to express our deeply thanks to the team of ultrasonography of the department of cardiovascular medicine in the First Affiliated Hospital of Chongqing Medical University.
All authors made a significant contribution to the study, whether that is in the conception, acquisition of data, analysis, or in all these areas; took part in drafting, revising or reviewing the article; gave final approval of the version to be published; agreed on the journal to which the article will be submitted; and agreed to be accountable for all aspects of the work.
Funding
Coauthor Z.D. was funded by National Natural Science Foundation of China, 81570212; Chongqing Health Commission, 2022MSXM028; Chongqing Returnees Stay and Create Fund 2020, Chongqing High-end Talent Fund. Coauthor G.L. was funded by China Cardiovascular Health Alliance-Access Research Fund (2021-CCA-ACCESS-130).
Disclosure
The authors have no conflicts of interest to declare in this work.
References
1. Borlaug BA. Evaluation and management of heart failure with preserved ejection fraction. Nat Rev Cardiol. 2020;17(9):559–573. doi:10.1038/s41569-020-0363-2
2. Borlaug BA. The pathophysiology of heart failure with preserved ejection fraction. Nat Rev Cardiol. 2014;11(9):507–515. doi:10.1038/nrcardio.2014.83
3. Tokitsu T, Yamamoto E, Oike F, et al. Clinical significance of brachial-ankle pulse-wave velocity in patients with heart failure with preserved left ventricular ejection fraction. J Hypertens. 2018;36(3):560–568. doi:10.1097/HJH.0000000000001589
4. Kawaguchi M, Hay I, Fetics B, Kass DA. Combined ventricular systolic and arterial stiffening in patients with heart failure and preserved ejection fraction: implications for systolic and diastolic reserve limitations. Circulation. 2003;107(5):714–720. doi:10.1161/01.cir.0000048123.22359.a0
5. Lyle MA, Brozovich FV. HFpEF, a disease of the vasculature: a closer look at the other half. Mayo Clin Proc. 2018;93(9):1305–1314. doi:10.1016/j.mayocp.2018.05.001
6. Chow B, Rabkin SW. The relationship between arterial stiffness and heart failure with preserved ejection fraction: a systemic meta-analysis. Heart Fail Rev. 2015;20(3):291–303. doi:10.1007/s10741-015-9471-1
7. Choi TY, Ahmadi N, Sourayanezhad S, Zeb I, Budoff MJ. Relation of vascular stiffness with epicardial and pericardial adipose tissues, and coronary atherosclerosis. Atherosclerosis. 2013;229(1):118–123. doi:10.1016/j.atherosclerosis.2013.03.003
8. Kim BJ, Kim BS, Kang JH. Echocardiographic epicardial fat thickness is associated with arterial stiffness. Int J Cardiol. 2013;167(5):2234–2238. doi:10.1016/j.ijcard.2012.06.013
9. Harada T, Obokata M. Obesity-related heart failure with preserved ejection fraction: pathophysiology, diagnosis, and potential therapies. Heart Fail Clin. 2020;16(3):357–368. doi:10.1016/j.hfc.2020.02.004
10. Obokata M, Reddy Y, Pislaru SV, Melenovsky V, Borlaug BA. Evidence supporting the existence of a distinct obese phenotype of heart failure with preserved ejection fraction. Circulation. 2017;136(1):6–19. doi:10.1161/CIRCULATIONAHA.116.026807
11. Li P, Wang L, Liu C. Overweightness, obesity and arterial stiffness in healthy subjects: a systematic review and meta-analysis of literature studies. Postgrad Med. 2017;129(2):224–230. doi:10.1080/00325481.2017.1268903
12. Koepp KE, Obokata M, Reddy Y, Olson TP, Borlaug BA. Hemodynamic and functional impact of epicardial adipose tissue in heart failure with preserved ejection fraction. JACC Heart Fail. 2020;8(8):657–666. doi:10.1016/j.jchf.2020.04.016
13. Gorter TM, van Woerden G, Rienstra M, et al. Epicardial adipose tissue and invasive hemodynamics in heart failure with preserved ejection fraction. JACC Heart Fail. 2020;8(8):667–676. doi:10.1016/j.jchf.2020.06.003
14. Homsi R, Sprinkart AM, Gieseke J, et al. Cardiac magnetic resonance based evaluation of aortic stiffness and epicardial fat volume in patients with hypertension, diabetes mellitus, and myocardial infarction. Acta Radiol. 2018;59(1):65–71. doi:10.1177/0284185117706201
15. Sunbul M, Agirbasli M, Durmus E, et al. Arterial stiffness in patients with non-alcoholic fatty liver disease is related to fibrosis stage and epicardial adipose tissue thickness. Atherosclerosis. 2014;237(2):490–493. doi:10.1016/j.atherosclerosis.2014.10.004
16. Korkmaz L, Cirakoglu OF, Ağaç MT, et al. Relation of epicardial adipose tissue with arterial compliance and stiffness in patients with hypertension. Angiology. 2014;65(8):691–695. doi:10.1177/0003319713502120
17. Gong YY, Peng HY. Correlation analysis of epicardial adipose tissue thickness, C-reactive protein, interleukin-6, visfatin, juxtaposed with another zinc finger protein 1, and type 2 diabetic macroangiopathy. Lipids Health Dis. 2021;20(1):25. doi:10.1186/s12944-021-01451-7
18. Pieske B, Tschöpe C, de Boer RA, et al. How to diagnose heart failure with preserved ejection fraction: the HFA-PEFF diagnostic algorithm: a consensus recommendation from the Heart Failure Association (HFA) of the European Society of Cardiology (ESC). Eur J Heart Fail. 2020;22(3):391–412. doi:10.1002/ejhf.1741
19. Reddy Y, Carter RE, Obokata M, Redfield MM, Borlaug BA, Simple A. Evidence-based approach to help guide diagnosis of heart failure with preserved ejection fraction. Circulation. 2018;138(9):861–870. doi:10.1161/CIRCULATIONAHA.118.034646
20. Yamashina A, Tomiyama H, Takeda K, et al. Validity, reproducibility, and clinical significance of noninvasive brachial-ankle pulse wave velocity measurement. Hypertens Res. 2002;25(3):359–364. doi:10.1291/hypres.25.359
21. Sueta D, Yamamoto E, Nishihara T, et al. H2FPEF score as a prognostic value in HFpEF patients. Am J Hypertens. 2019;32(11):1082–1090. doi:10.1093/ajh/hpz108
22. Sun Y, Si J, Li J, et al. Predictive value of HFA-PEFF score in patients with heart failure with preserved ejection fraction. Front Cardiovasc Med. 2021;8:656536. doi:10.3389/fcvm.2021.656536
23. Iacobellis G. Local and systemic effects of the multifaceted epicardial adipose tissue depot. Nat Rev Endocrinol. 2015;11(6):363–371. doi:10.1038/nrendo.2015.58
24. Patel VB, Shah S, Verma S, Oudit GY. Epicardial adipose tissue as a metabolic transducer: role in heart failure and coronary artery disease. Heart Fail Rev. 2017;22(6):889–902. doi:10.1007/s10741-017-9644-1
25. Packer M, Lam C, Lund LH, Maurer MS, Borlaug BA. Characterization of the inflammatory-metabolic phenotype of heart failure with a preserved ejection fraction: a hypothesis to explain influence of sex on the evolution and potential treatment of the disease. Eur J Heart Fail. 2020;22(9):1551–1567. doi:10.1002/ejhf.1902
26. Bosy-Westphal A, Kossel E, Goele K, et al. Association of pericardial fat with liver fat and insulin sensitivity after diet-induced weight loss in overweight women. Obesity. 2010;18(11):2111–2117. doi:10.1038/oby.2010.49
27. Lee HY, Després JP, Koh KK. Perivascular adipose tissue in the pathogenesis of cardiovascular disease. Atherosclerosis. 2013;230(2):177–184. doi:10.1016/j.atherosclerosis.2013.07.037
28. Park HE, Choi SY, Kim HS, Kim MK, Cho SH, Oh BH. Epicardial fat reflects arterial stiffness: assessment using 256-slice multidetector coronary computed tomography and cardio-ankle vascular index. J Atheroscler Thromb. 2012;19(6):570–576. doi:10.5551/jat.12484
 © 2022 The Author(s). This work is published and licensed by Dove Medical Press Limited. The
full terms of this license are available at https://www.dovepress.com/terms
and incorporate the Creative Commons Attribution
- Non Commercial (unported, 3.0) License.
By accessing the work you hereby accept the Terms. Non-commercial uses of the work are permitted
without any further permission from Dove Medical Press Limited, provided the work is properly
attributed. For permission for commercial use of this work, please see paragraphs 4.2 and 5 of our Terms.
© 2022 The Author(s). This work is published and licensed by Dove Medical Press Limited. The
full terms of this license are available at https://www.dovepress.com/terms
and incorporate the Creative Commons Attribution
- Non Commercial (unported, 3.0) License.
By accessing the work you hereby accept the Terms. Non-commercial uses of the work are permitted
without any further permission from Dove Medical Press Limited, provided the work is properly
attributed. For permission for commercial use of this work, please see paragraphs 4.2 and 5 of our Terms.