Back to Journals » Journal of Inflammation Research » Volume 18
Early Immune-Inflammatory Profiling and Prognostic Biomarkers in Patients with Acute Diquat Poisoning: A Multicenter Study with Exploratory Bioinformatics Analysis
Authors Wang P, Lin LY, Song CY, Fang JJ, Zhang BW, Li WS, Yu HJ, Fu YP, Lu YQ ![]()
Received 19 June 2025
Accepted for publication 3 October 2025
Published 15 October 2025 Volume 2025:18 Pages 14245—14260
DOI https://doi.org/10.2147/JIR.S547369
Checked for plagiarism Yes
Review by Single anonymous peer review
Peer reviewer comments 2
Editor who approved publication: Professor Ning Quan
Ping Wang,1,2 Li-Ying Lin,1,2 Cong-Ying Song,1,2 Jian-Jiang Fang,3 Bing-Wen Zhang,4 Wan-Sheng Li,5 Hui-Jie Yu,6 Yong-Ping Fu,7 Yuan-Qiang Lu1,2
1Department of Emergency Medicine, The First Affiliated Hospital, School of Medicine, Zhejiang University, Hangzhou, Zhejiang, 310003, People’s Republic of China; 2Zhejiang Key Laboratory for Diagnosis and Treatment of Physic-Chemical and Aging-Related Injuries, Hangzhou, Zhejiang, 310003, People’s Republic of China; 3Department of Emergency Medicine, The Affiliated Lihuili Hospital of Ningbo University, Ningbo, Zhejiang, 315040, People’s Republic of China; 4Department of Emergency Medicine, Jinhua Municipal Central Hospital, Jinghua, Zhejiang, 321000, People’s Republic of China; 5Department of Emergency Medicine, Taizhou Municipal Hospital, Taizhou, Zhejiang, 318000, People’s Republic of China; 6Department of Emergency Medicine, The Affiliated Hospital of Jiaxing University, Jiaxing, Zhejiang, 314001, People’s Republic of China; 7Department of Emergency Medicine, Affiliated Hospital of Shaoxing University, Shaoxing, Zhejiang, 312000, People’s Republic of China
Correspondence: Yuan-Qiang Lu, Department of Emergency Medicine, The First Affiliated Hospital, School of Medicine, Zhejiang University, Hangzhou, Zhejiang, 310003, People’s Republic of China, Tel +86 13588706807, Email [email protected]
Purpose: With the increasing incidence of acute diquat (DQ) poisoning, this study aims to analyze immune biomarkers in patients and explore their impact on outcomes.
Methods: A retrospective multicenter cohort study included 145 patients with acute DQ poisoning from six hospitals in Zhejiang Province, China. Immune-inflammatory parameters were compared between DQ patients and healthy controls. Patients were then grouped according to their 28-day survival status for prognostic analysis. Clinical, laboratory, and immune parameters were collected. Least absolute shrinkage and selection operator (LASSO) regression, multivariate logistic regression, and receiver operating characteristic analysis were used to identify predictors of mortality. Bioinformatics analysis was performed to explore potential molecular targets and pathways.
Results: Of 145 patients, 72 died within 28 days. Non-survivors showed higher procalcitonin (PCT), lactate, and organ injury markers, as well as elevated interleukin-6 and interleukin-10, compared with survivors. Compared with healthy controls, patients with DQ poisoning exhibited increased white blood cells (WBC), neutrophils, monocytes, and cytokines, alongside reduced lymphocytes and T-cell subsets (all P < 0.0001). LASSO and logistic regression identified PCT, WBC, and lactate as independent predictors of mortality, with PCT providing the greatest discriminative value (AUC = 0.88). Bioinformatics analysis further indicated enrichment of immune-related pathways and hub genes associated with immune dysregulation.
Conclusion: Acute DQ poisoning causes pronounced immune-inflammatory disturbances that are more severe in non-survivors. PCT is the strongest independent predictor of 28-day mortality, while exploratory bioinformatics highlights immune pathways with potential prognostic and therapeutic relevance.
Keywords: diquat poisoning, procalcitonin, immune-related biomarker, immune dysregulation, STAT3, bioinformatics analysis
Introduction
Diquat (DQ), chemically known as 1,1’-ethylene-2,2’-bipyridyldiylium dibromide, is a non-selective bipyridylium herbicide.1 With the banning of paraquat (PQ), the use of DQ has gradually increased. This increase has led to a rise in cases of intentional ingestion for suicide purpose, posing a serious public health issue. Acute DQ poisoning results in multiorgan dysfunction, particularly involving the kidneys, digestive tract, and central nervous system.2–6 Despite advances in clinical management, current treatment remains largely limited to symptomatic supportive care, and the prognosis is often poor—underscoring the urgent need for early identification of high-risk patients.7
The mechanisms underlying DQ toxicity remain incompletely understood. Experimental studies have demonstrated that DQ exposure leads to excessive production of reactive oxygen species (ROS), resulting in oxidative stress, lipid peroxidation, mitochondrial dysfunction, and inflammatory injury.8–10 These processes contribute to cell death and multiorgan damage, especially in the liver, kidneys, and lungs. While measurement of serum DQ concentration is considered the most direct indicator of toxic burden,11,12 its routine clinical application is limited by the requirement for specialized laboratory equipment.13 Therefore, the search for accessible biomarkers to guide prognosis remains an unmet clinical challenge.
Accumulating evidence from animal studies suggests that DQ-induced oxidative stress disrupts the redox balance and stimulates pro-inflammatory cytokine production, thereby influencing the host immune response.14–17 Recent studies suggest that DQ may directly or indirectly affect the peripheral immune status of the organism. After DQ poisoning, DQ accumulates in the spleen and affects the balance of M1/M2 macrophage subpopulations in mice, decreasing the proportion of M1 and M2 subgroups in the spleen, thereby reducing the immune response capability. These preclinical findings raise the possibility that immune dysregulation may serve as a prognostic marker in humans, thought this has yet to be systematically studied.
Therefore, this study aimed to investigate the immune alterations in patients with acute DQ poisoning, evaluate their association with clinical outcomes, and identify potential immunological biomarkers for prognosis.
Methods
Objects of Study
This study protocol was approved by the Ethics Committee of The First Affiliated Hospital, Zhejiang University School of Medicine (approval number: 20230483). All participants provided broad informed consent at their first visit. This study adhered to the principles of the Declaration of Helsinki. The data were collected from patients with acute DQ poisoning who were admitted to the First Affiliated Hospital of Zhejiang University, the Affiliated Lihuili Hospital of Ningbo University, Jinhua Municipal Central Hospital, Taizhou Municipal Hospital, the First Affiliated Hospital of Jiaxing University, and the Affiliated Hospital of Shaoxing University from January 2021 to December 2024. The primary objective of this study was to identify early clinical and immunological predictors of 28-day mortality in patients with acute DQ poisoning. The primary endpoint was defined as 28-day all-cause mortality. Secondary endpoints included differences in serum inflammatory cytokines and peripheral lymphocyte subsets between groups. The inclusion and exclusion criteria were applied across all six centers. The inclusion criteria were as follows: (1) acute DQ poisoning patients diagnosed by high-performance liquid chromatography-mass spectrometry (HPLC-MS/MS); (2) patients or their family members with informed consent. The exclusion criteria were: (1) combined with other poisons; (2) patients were admitted to our hospital 48 hours after DQ poisoning; (3) pregnant or lactating women; (4) patients with severe liver or kidney diseases, hematological diseases, autoimmune diseases, tumors, organ transplantation or chronic diseases requiring immunomodulatory therapy; (5) patients who abandoned treatment within 24 hours of admission. Patients were categorized into survival and non-survival groups based on 28-day outcomes. The detailed procedure is shown in Figure 1. To compare immunological parameters, 48 healthy sex- and age-matched individuals were included as controls. Inclusion criteria for controls were: (1) no history of pesticide exposure; (2) absence of chronic illness or immunologic disorders; and (3) normal baseline laboratory results. Healthy controls were recruited solely for immune-related assays.
 |
Figure 1 Flowchart for study sample selection. |
Data Collection and Definition
Blood samples were immediately collected from admitted patients and tested for DQ concentration using HPLC-MS/MS. Given the uncertainty of pesticide products, we also conducted PQ testing using HPLC-MS/MS to exclude PQ poisoning. The following clinical characteristics of the patients were collected, including age, sex, time interval from poisoning to our hospital admission, laboratory data, and clinical outcomes. The complete blood count (CBC), cytokine analysis, immunocyte subset typing, and T-cell activation analysis were collected immediately on admission. In addition to routine laboratory parameters, several inflammation-related indices were calculated based on CBC data to evaluate the systemic immune-inflammatory status. These included the neutrophil-to-lymphocyte ratio (NLR), which was defined as the ratio of the neutrophil count to the lymphocyte count, and the monocyte-to-lymphocyte ratio (MLR), which was calculated by dividing the monocyte count by the lymphocyte count. The platelet-to-lymphocyte ratio (PLR) was determined as the ratio of the platelet count to the lymphocyte count. The systemic immune-inflammation index (SII) was derived by multiplying the platelet count with the neutrophil count and dividing by the lymphocyte count. Similarly, the systemic inflammation response index (SIRI) was calculated as the product of neutrophil and monocyte counts divided by the lymphocyte count. The aggregate index of systemic inflammation (AISI) was determined by multiplying the platelet, neutrophil, and monocyte counts and dividing by the lymphocyte count. Furthermore, the derived neutrophil-to-lymphocyte ratio (dNLR) was computed as the neutrophil count divided by the difference between the total white blood cell (WBC) count and the neutrophil count. Finally, the neutrophil-to-lymphocyte*platelet ratio (NLPR) was calculated as the neutrophil count divided by the product of the lymphocyte and platelet counts. The 28-day survival status was collected via hospital information systems; for discharged patients, follow-up via telephone with the patient or their family was conducted.
Detection of Serum Cytokine Levels
Serum was collected immediately on admission. Six trapping microspheres of interleukin-2 (IL-2), IL-6, tumor necrosis factor-α (TNF-α), interferon-γ (IFN-γ), IL-4, and IL-10 (ACEA Biosciences) with different fluorescence intensities were specifically bound to cytokines in the serum and then combined with fluorescence detection reagents to form a double-antibody sandwich complex. Using flow cytometry, the fluorescence intensity of the captured microspheres was examined to determine the identity of each cytokine. At the same time, the fluorescence intensity of each cytokine complex was examined independently to obtain the quantitative value.
Lymphocyte Subsets and T-Cell Activation Analysis
Peripheral blood lymphocyte subsets were detected by flow cytometry (Agilent Biosciences). Blood was collected immediately on admission. Fluorescence-labeled monoclonal antibodies were used for staining, including: cluster of differentiation (CD)3-fluorescein isothiocyanate (FITC), CD8-phycoerythrin (PE), CD45-peridinin chlorophyll protein (PerCP), CD4-allophycocyanin (APC)/CD3-FITC, CD16+CD56-PE, CD19-APC/CD3-FITC, CD127-PE, CD4-PerCP-Cy5.5, CD25-APC/CD3-FITC, human leukocyte antigen–DR isotype (HLA-DR)-APC/CD3-FITC, CD38-PE/CD3-FITC, CD28-PE/CD3-FITC, and CD69-PE (Agilent Biosciences).
Leukocyte surface antigen specifically binds to the reagent’s fluorescently labeled antibody. When excited light is applied to blood cells in a flow cytometry setup, they create a high-speed jet of single-cell suspension that produces side-scattered light, forward scattered light, and fluorescence signals. The blood cells are encased in sheath fluid. Through quantitative examination of the fluorescent signal detection, the distribution of lymphocyte subsets is determined.
Target Prediction, Pathway Enrichment, and Protein-Protein Interaction Analysis of DQ
The simplified molecular input line entry system (SMILES) of DQ was retrieved from PubChem. Related targets for the active compounds were predicted using the Swiss Target Prediction,18 TargetNet,19 and SuperPRED20 databases, based on their SMILES formulas. Duplicate targets were removed, and the final dataset was analyzed in the Database for Annotation, Visualization, and Integrated Discovery (DAVID)21 for Gene Ontology (GO) annotation, Kyoto Encyclopedia of Genes and Genomes (KEGG) pathway, and Reactome enrichment to explore DQ’s biological functions and key pathways. Homo sapiens was selected, with a threshold of P < 0.05. The results were visualized using column and bubble charts for GO and KEGG enrichment, respectively. The STRING database version 12.022 was used to explore the protein-protein interactions (PPIs) of each target with a confidence score > 0.4. Unconnected targets were excluded. The PPI data were then imported into Cytoscape (version 3.10.3) for network reconstruction and hub target identification using the Maximal Clique Centrality (MCC) algorithm. Finally, GeneMANIA was used to explore functionally similar genes and perform further enrichment analysis.23
Statistical Analysis
SPSS 20.0, R software version 3.6.1, and GraphPad Prism 8.0 were used for statistical analysis. Categorical variables are presented as frequencies and percentages, with inter-group comparisons made using chi-square tests or Fisher’s exact tests, as appropriate. The normality of numerical variables was assessed using the Shapiro–Wilk test. For variables following a normal distribution, the data were expressed as mean±standard deviation (SD) and inter-group comparisons were performed using the Student’s t-test. For non-normally distributed variables, the data are presented as median and interquartile range (IQR), and comparisons between groups were made using the Mann–Whitney U-test. The relationship between variables was evaluated using Spearman’s rank correlation coefficient. Least absolute shrinkage and selection operator (LASSO) regression was used to select the most valuable variables. These variables were then applied to binary logistic regression to screen for independent risk factors. Receiver operating characteristic (ROC) analysis was conducted on these variables to identify the optimal cut-off values. Survival probability was estimated using the means of the Kaplan-Meier curves with death as the end point. A two-tailed P value < 0.05 was considered a statistically significant difference.
Results
Clinical Characteristics of Patients with Acute DQ Poisoning
A total of 145 cases of acute DQ poisoning and 48 healthy controls were enrolled in this study, strictly following the inclusion and exclusion criteria. Based on their 28-day survival status, patients with acute DQ poisoning were divided into the survival (73 cases) and non-survival (72 cases) groups. Table 1 presents the clinical characteristics of the two groups. The median age of the survival group was 26.00 [20.00–33.00] years, while that of the death group was 28.00 [22.00–37.00] years. Compared with survival group, the death group had significantly higher initial blood DQ concentrations (10,000.00 [5649.41–10,000.00] vs 303.83 [112.98–1313.49] ng/mL, P < 0.001). In terms of CBC parameters, the death group exhibited significantly elevated WBC, neutrophils, monocytes, red blood cell (RBC), hemoglobin, and hematocrit levels (all P < 0.01), while lymphocyte levels did not differ significantly. Several CBC-derived inflammatory parameters, including NLR, MLR, SII, SIRI, AISI, NLPR, and dNLR, were markedly higher in the death group (all P < 0.001). Procalcitonin (PCT) levels were also significantly elevated in the death group (4.12 [0.25–23.21] vs 0.05 [0.03–0.11] ng/mL, P < 0.001).
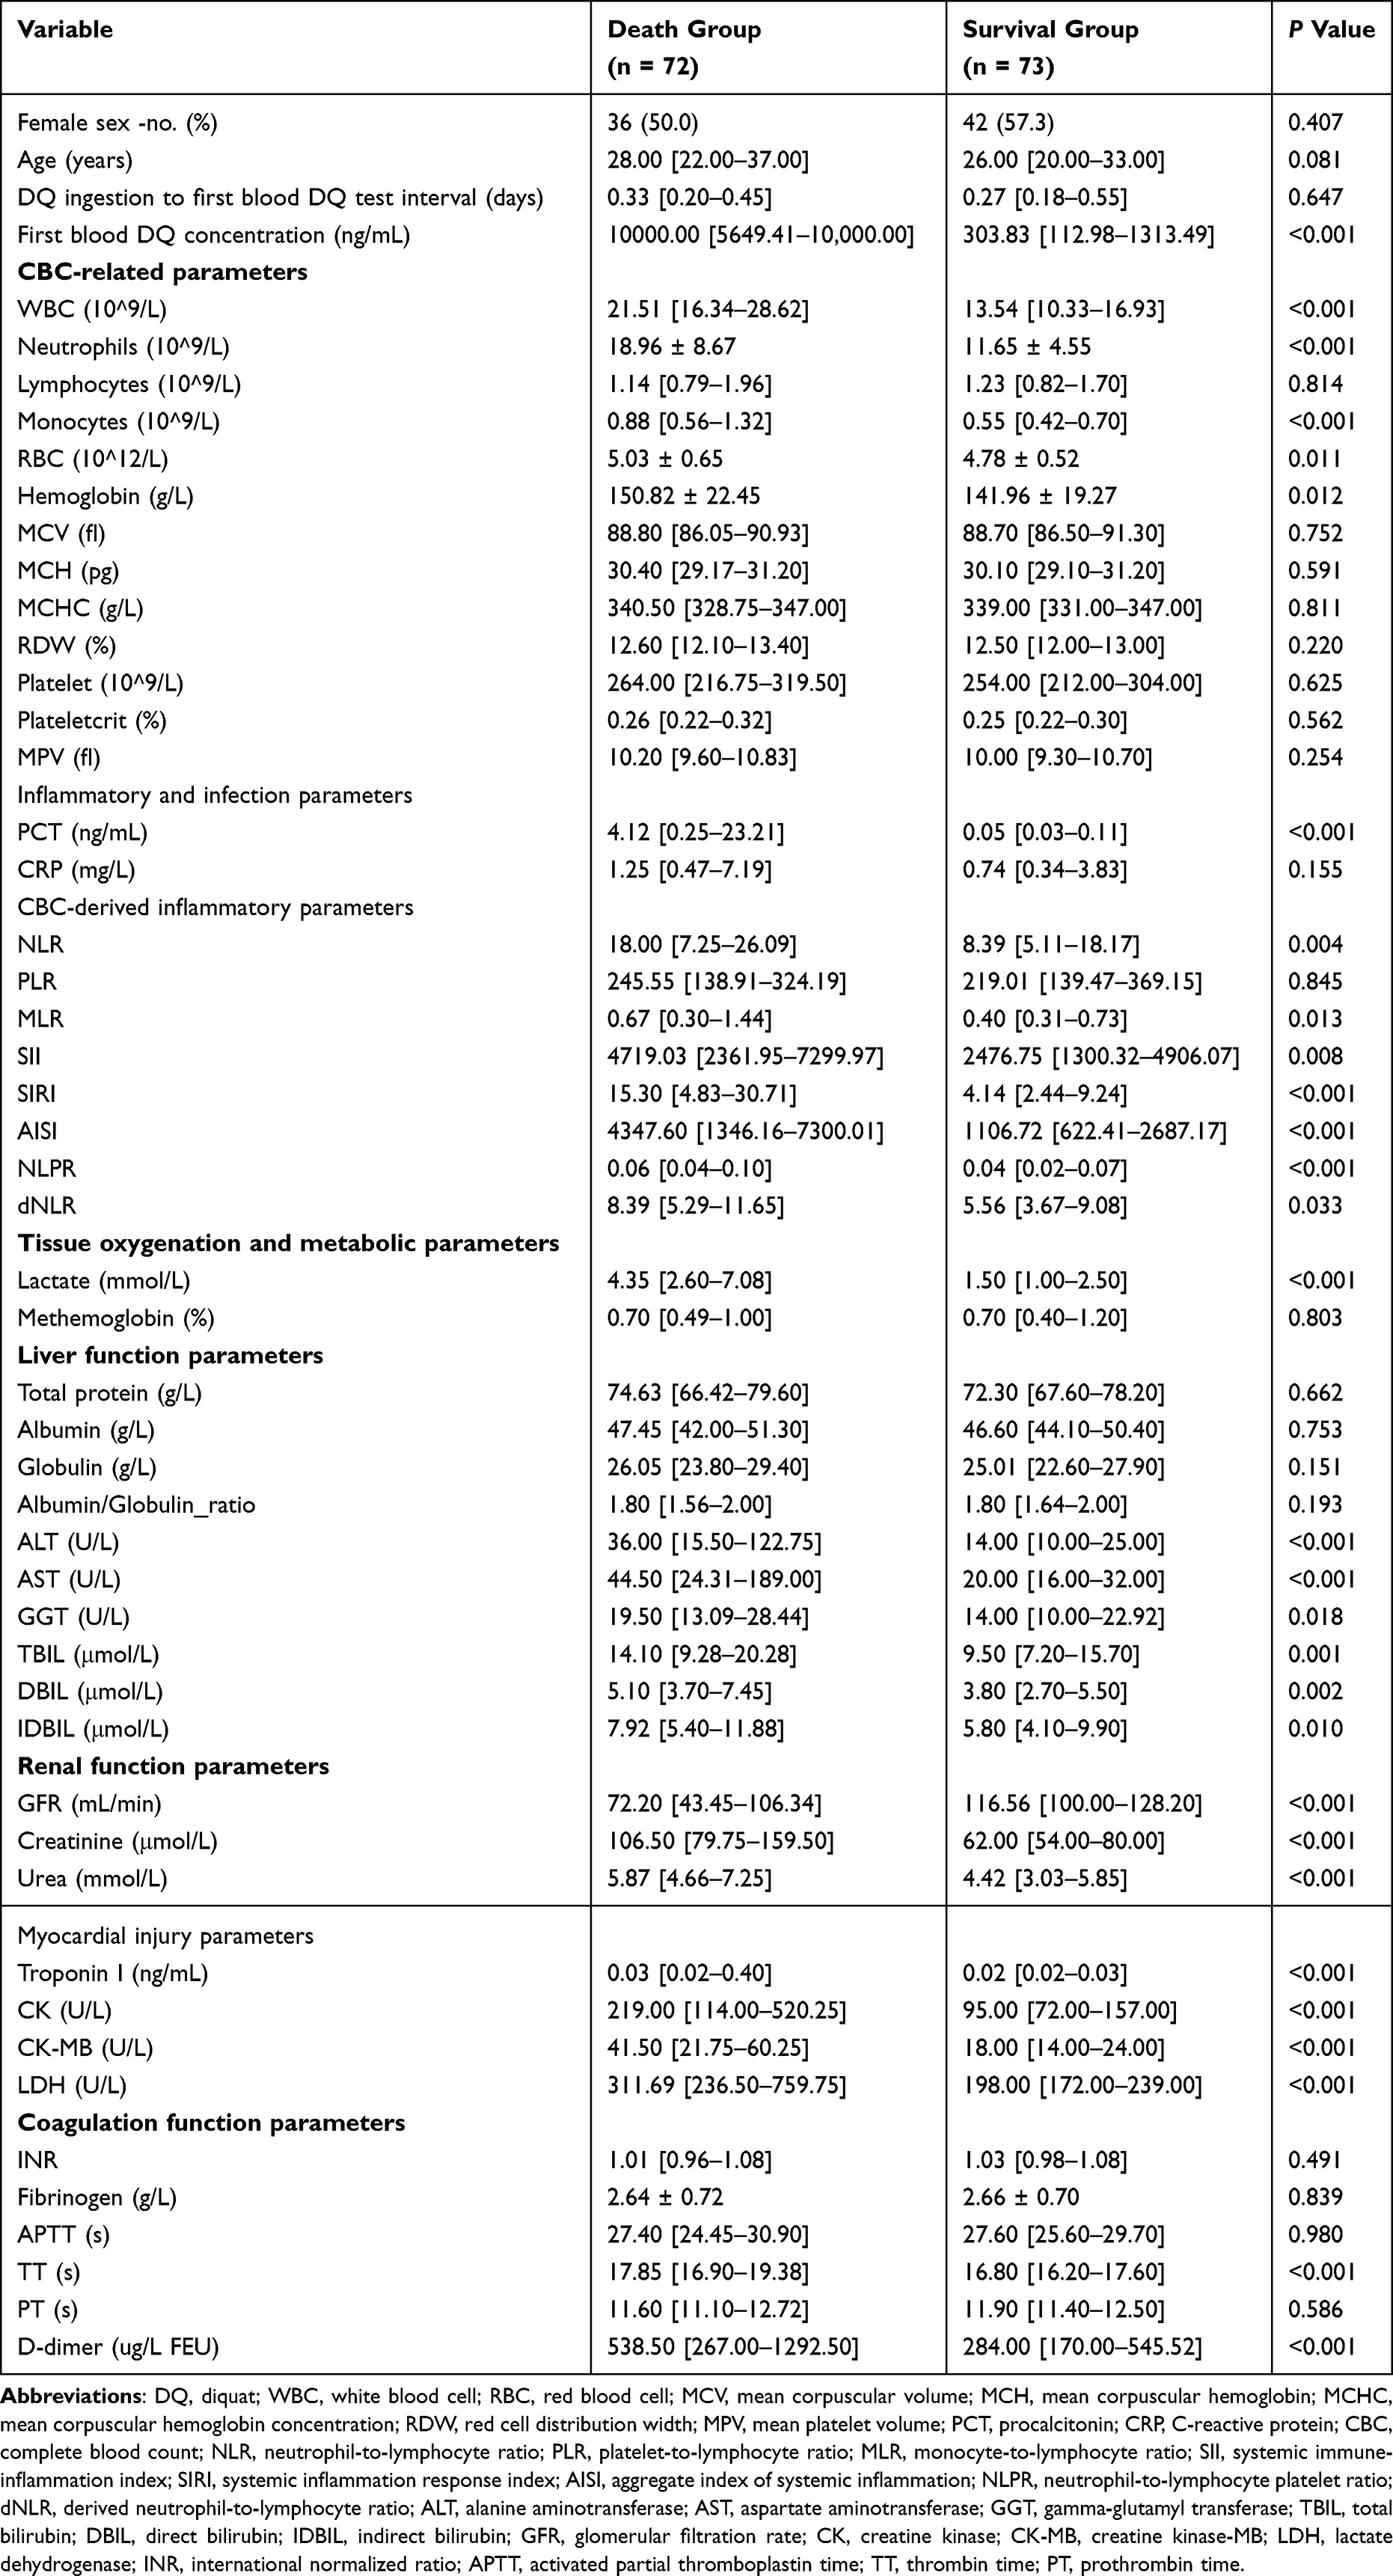 |
Table 1 Comparison of Clinical Characteristics Between Survival and Death Groups |
Regarding tissue oxygenation and metabolic status, lactate levels were substantially higher in the death group (4.35 [2.60–7.08] vs 1.50 [1.00–2.50] mmol/L, P < 0.001), while methemoglobin levels showed no significant difference. In hepatic function tests, alanine aminotransferase (ALT), aspartate aminotransferase (AST), gamma-glutamyl transferase (GGT), and bilirubin (total, direct, and indirect) levels were significantly elevated in the death group (all P < 0.01). Renal function markers, including serum creatinine, urea, and glomerular filtration rate (GFR), also showed significant differences, with the death group having worse renal profiles (all P < 0.001). Myocardial injury indicators were significantly elevated in the death group (all P < 0.01). Among coagulation parameters, only thrombin time (TT) and D-dimer levels differed significantly between these groups (both P < 0.001).
Comparison of Immunological Parameters Between Healthy Individuals and Patients with Acute DQ Poisoning
The results of the initial CBC on admission of the patients are depicted in Figure 2. Patients with acute DQ poisoning showed significantly increased WBC, neutrophils, and monocytes counts, along with a significant decrease in lymphocyte counts (all P < 0.001). Lymphocytes, a type of WBC, plays a crucial role in the immune system and are primarily classified into three types: T cells, B cells, and natural killer (NK) cells. Comparing changes in peripheral blood lymphocyte subsets in patients with acute DQ poisoning, it was found that CD3+ cells, CD3+ CD4+ cells, CD3+ CD8+ cells, and CD16+ CD56+ cells (NK cells) were significantly reduced (all P < 0.0001), whereas CD19+ cells (B cells) showed no significant differences (P > 0.05). Furthermore, the levels of inflammatory cytokines (IL-2, IL-6, IL-4, IL-10, TNF-ɑ, and IFN-γ) were significantly higher in patients with acute DQ poisoning compared to the healthy control group (all P < 0.0001). As shown in Figure 3, T cell activation—measured by surface markers including HLA-DR+,24 CD38+,25 CD28+,26 and CD69+,27—was significantly reduced in patients with acute DQ poisoning compared with healthy controls (all P < 0.01). The only exception was CD3⁺CD4⁺CD69⁺ T cells, which showed no significant difference (P > 0.05).
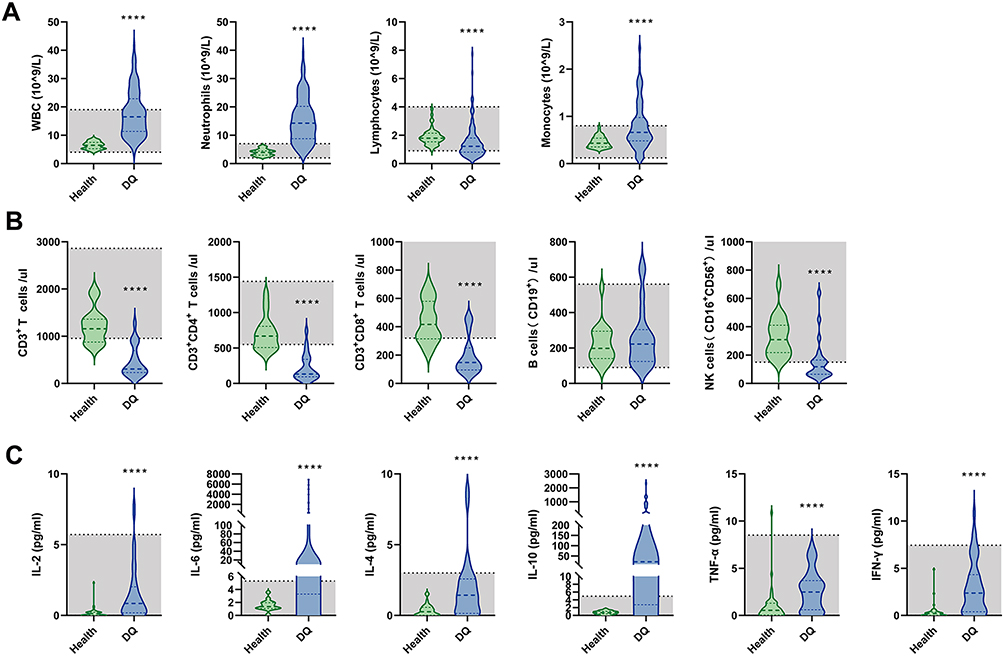 |
Figure 2 Immune cell counts and inflammatory cytokines were compared between patients with acute DQ poisoning and healthy controls. (A) Changes in the number of WBC, neutrophils, lymphocytes, and monocytes in patients with acute DQ poisoning (n = 145) compared to healthy controls (n = 48). (B) Changes in CD3+ T cells, CD3+ CD4+ T cells, CD3+ CD8+ T cells, B cells, and NK cells in patients with acute DQ poisoning (n = 27) compared to healthy controls (n = 48). (C) Changes in the levels of IL-2, IL-6, IL-4, IL-10, TNF-ɑ, and IFN-γ in patients with acute DQ poisoning (n = 50) compared to healthy controls (n = 48). **** P < 0.0001. |
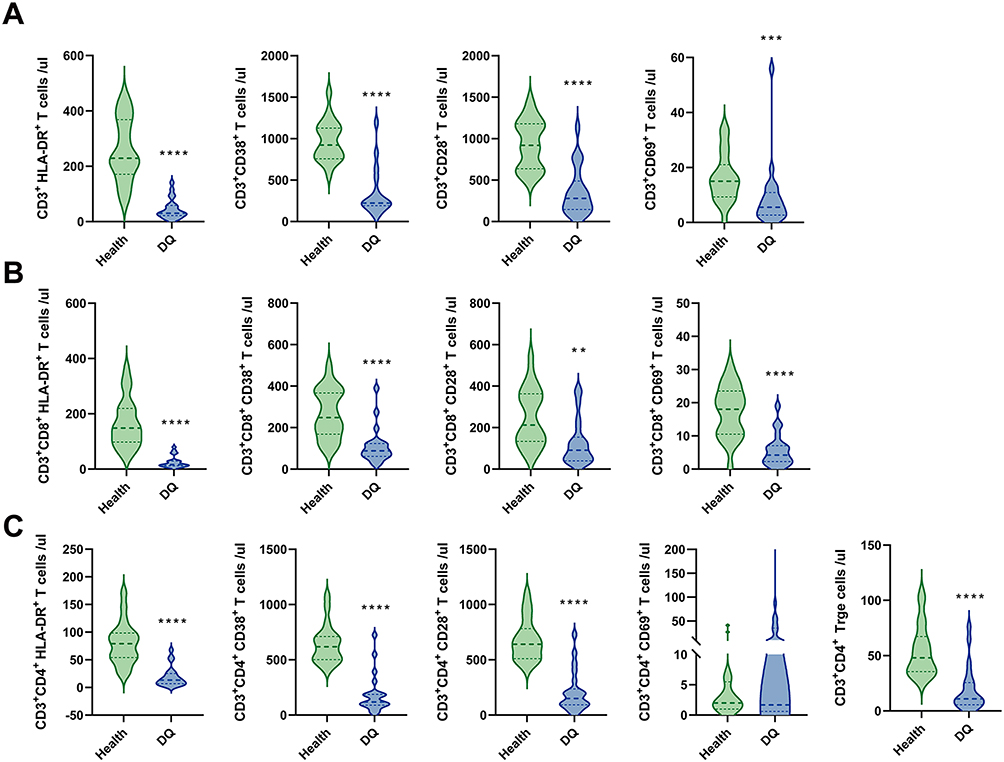 |
Figure 3 Comparison of T cell activation between patients with acute DQ poisoning and healthy controls. (A) Changes in CD3+ HLA-DR+ T cells, CD3+ CD38+ T cells, CD3+ CD28+ T cells, and CD3+ CD69+ T cells between patients with acute DQ poisoning (n = 22) and healthy controls (n = 20). (B) Changes in CD3+ CD8+ HLA-DR+ T cells, CD3+ CD8+ CD38+ T cells, CD3+ CD8+ CD28+ T cells, and CD3+ CD48+ CD69+ T cells between patients with acute DQ poisoning (n = 22) and healthy controls (n = 20). (C) Changes in CD3+ CD4+ HLA-DR+ T cells, CD3+ CD4+ CD38+ T cells, CD3+ CD4+ CD28+ T cells, CD3+ CD4+ CD69+ T cells, and CD3+ CD4+ Treg T cells between patients with acute DQ poisoning (n = 22) and healthy controls (n = 20). **P < 0.01, ***P < 0.001, ****P < 0.0001. |
Comparison of Immunological Parameters Between the Survival and Death Groups of Patients with Acute DQ Poisoning
As shown in Figure 4, there was a more pronounced elevation in WBC, neutrophils, and monocytes (all P < 0.0001), while lymphocytes showed no significant differences (P > 0.05) in the death group. A further comparison of T cell activation between the 13 patients in the survival group and the 9 patients in the death group revealed that although the death group showed reductions in CD3+ cells, CD3+ CD4+ cells, and CD3+ CD8+ cells compared to the survival group, there were no significant statistical differences (all P > 0.05), which could be explained by the smaller sample size. In addition, by observing the expression of inflammatory cytokines in these patients, it was found that the levels of IL-6 and IL-10 in the death group were significantly elevated (both P < 0.0001). A mild increase in IFN-γ and IL-2 was also observed in the death group (both P < 0.05), whereas IL-4 and TNF-α did not show significant differences.
 |
Figure 4 Immune cell counts and inflammatory cytokines were compared between the survival and death groups. (A) Changes in the number of WBC, neutrophils, lymphocytes, and monocytes in the death groups (n = 72) compared to the survival groups (n = 73). (B) Changes in CD3+ T cells, CD3+ CD4+ T cells, CD3+ CD8+ T cells, NK cells, and B cells in the death groups (n = 11) compared to the survival groups (n = 16). (C) Changes in levels of IL-2, IL-6, IL-4, IL-10, TNF-α, and IFN-γ in the death groups (n = 18) compared to the survival groups (n = 32). *P < 0.05, **** P < 0.0001. |
Although the above research results showed no significant difference in T cells between patients in the survival and death groups, we further analyzed the different T cell activation statuses of the two groups. As depicted in Figure S1, the activation levels of CD3+ CD8+ CD28+ cells and CD3+ CD8+ Treg cells were significantly decreased in the death group compared to the patients in the survival group (all P < 0.05).
Collinearity Analysis and Variable Selection Using LASSO Regression
To identify key predictors associated with mortality in patients with acute DQ poisoning, we applied LASSO logistic regression to the set of candidate variables that were significantly different between the survivor and death groups. All continuous variables were standardized using Z-score transformation prior to modeling. As shown in Figure 5A, the correlation heatmap revealed substantial multicollinearity among several variables, supporting the use of a regularized regression approach. To ensure reproducibility, a fixed random seed (set.seed = 123) was applied. Ten-fold cross-validation was performed to determine the optimal penalization parameter lambda (Figures 5B and C). At the optimal lambda (λ. min), a total of 8 non-zero coefficients were retained (Figure 5D and Table 2), including WBC, PCT, lactate, GFR, troponin I, AST, TBIL, and DBIL.
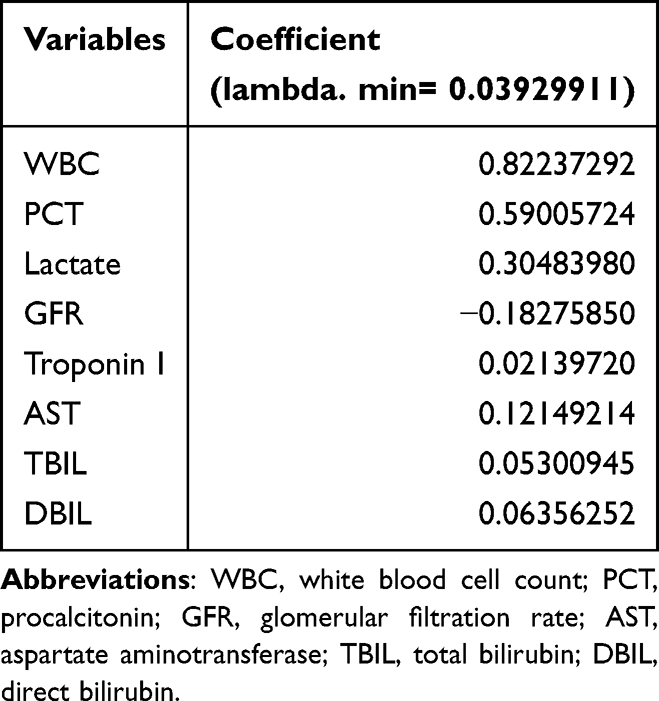 |
Table 2 Coefficient Table of Categorical Independent Variables Selected by LASSO Regression |
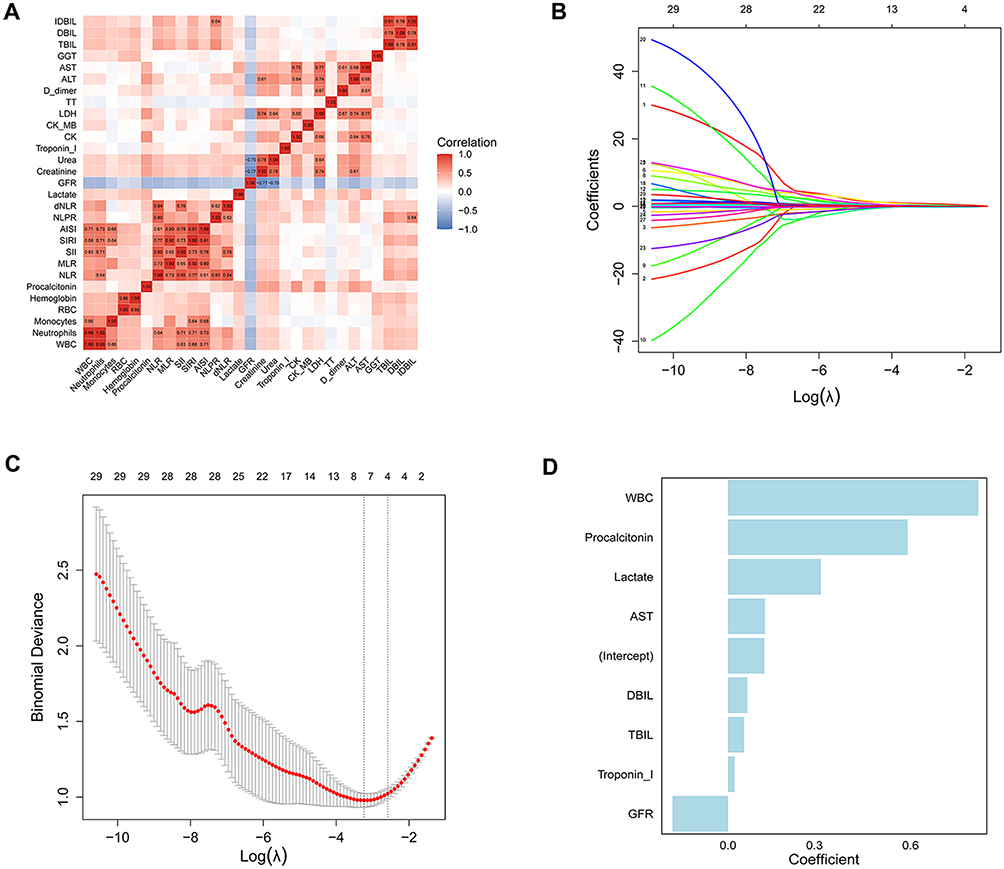 |
Figure 5 Screening of the key immune-related indicators most related to the prognosis of acute DQ poisoning. (A) Correlation heatmap of input variables included in the LASSO model. Strong correlations were observed between multiple inflammatory and organ function markers. (B) Plot for LASSO regression coefficients. A coefficient profile plot was plotted versus the log (λ). Different colored lines represent different variables. (C) Ten-fold cross-validation curve plotted against log(λ) values. The dotted line indicates the optimal lambda (λ. min) selected based on the minimum mean cross-validated error. (D) Barplot of non-zero coefficients selected at the optimal lambda (λ.min). |
Logistic Regression and ROC Curve Analysis for Prediction
To further evaluate the independent predictive value of the variables selected by LASSO regression, we conducted a logistic regression analysis on the 8 retained variables and calculated the ROC curves to assess their ability to predict mortality. As shown in Table 3 and Figure 6A, the multivariate logistic regression identified WBC, PCT, and lactate as independent risk factors significantly associated with 28-day mortality (all P < 0.05). Notably, PCT exhibited the highest odds ratio, suggesting it to be the strongest independent predictor among the selected variables. Based on the multivariable logistic regression model, a composite mortality prediction model was constructed. The corresponding ROC curve (Figure 6B) yielded an area under the curve (AUC) of 0.89 (95% confidence interval [CI], 0.84–0.95), indicating excellent discriminatory performance.
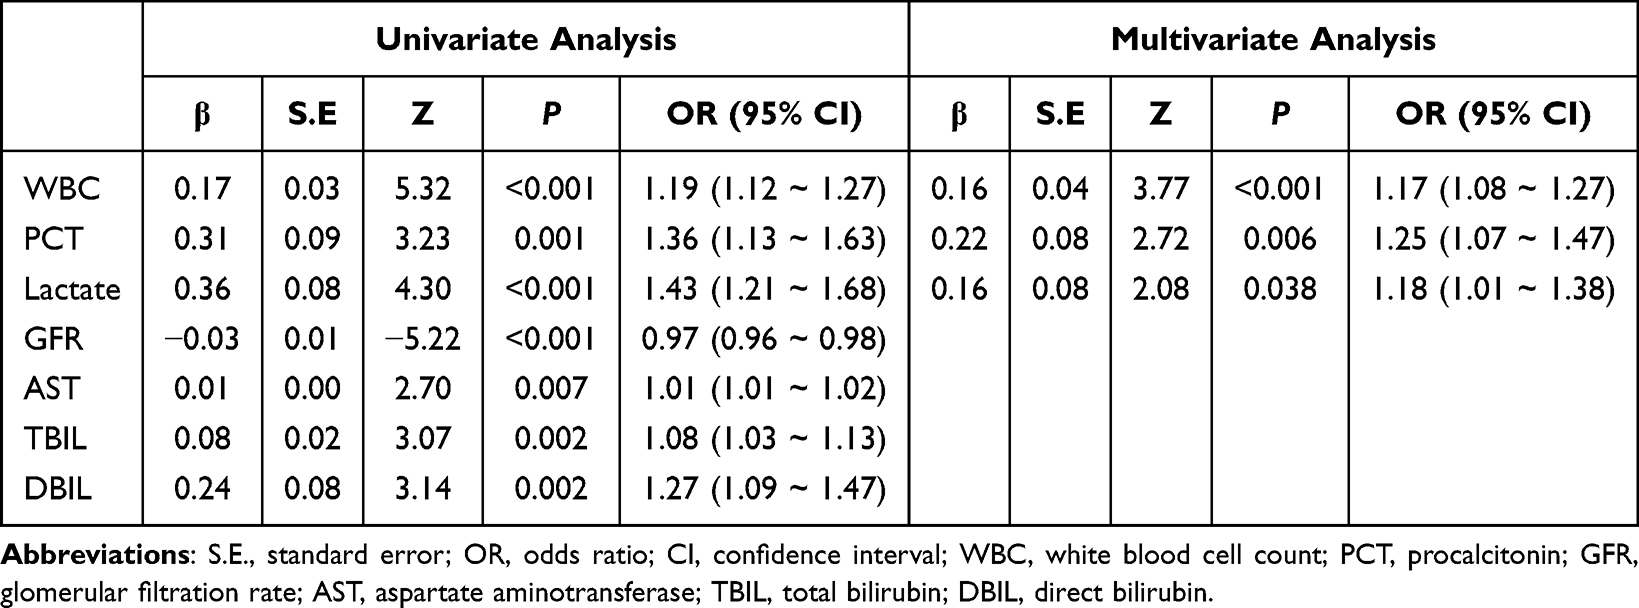 |
Table 3 Univariate and Multivariate Analysis of Clinical Variables Associated with Patient Outcomes |
 |
Figure 6 Evaluation of LASSO-selected variables for predicting 28-day mortality in patients with acute DQ poisoning. (A) Forest plot presenting the odds ratios (ORs) and 95% confidence intervals (CIs) from the multivariable logistic regression analysis of the 8 variables selected by LASSO regression. (B) Receiver operating characteristic (ROC) curve of the multivariable logistic regression model incorporating all 8 predictors. (C) ROC curves comparing the predictive performance of three individual biomarkers: procalcitonin, lactate, and WBC. (D) Kaplan–Meier survival curves stratified by procalcitonin levels (cutoff: 0.16 ng/mL). |
To further compare the prognostic accuracy of the individual variables, separate ROC analyses were performed for PCT, lactate, and WBC (Figure 6C). Among them, PCT showed the highest AUC (0.88, 95% CI: 0.82–0.93) with an optimal cutoff value of 0.16 ng/mL, outperforming lactate (AUC = 0.80) and WBC (AUC = 0.78). Based on this threshold, patients were stratified into high- and low-PCT groups (>0.16 vs ≤0.16 ng/mL), and a Kaplan–Meier survival analysis was performed (Figure 6D). The results demonstrated that patients in the high-PCT group had significantly lower 28-day survival probabilities compared to those in the low-PCT group (P < 0.0001), further supporting the prognostic value of PCT as an early indicator of mortality risk in patients with acute DQ poisoning.
Summary of DQ Target Identification and Pathway Enrichment
A total of 186 targets of DQ were obtained from three databases (Figure 7A). GO annotation, KEGG pathway, and Reactome enrichment are shown in the Figure 7. In the Biological Process (BP) category, the main processes involved inflammatory response, chemical synaptic transmission, and response to xenobiotic stimulus. In the Cellular Component (CC) category, the target proteins were primarily classified as plasma membrane, synapse, and dendrite. In the Molecular Function (MF) category, the target proteins mainly involved protein serine/threonine kinase activity, enzyme binding, and non-membrane spanning protein tyrosine kinase activity (Figure 7B). The KEGG and Reactome enrichment analyses revealed significant enrichment in immune-related pathways, particularly in cytokine signaling in the immune system. In the KEGG analysis, pathways such as chemokine signaling and inflammatory mediator regulation of transient receptor potential (TRP) channels were notably enriched, suggesting the involvement of target genes in the immune response and related diseases (Figure 7C). The Reactome analysis highlighted cytokine signaling as the most enriched pathway, along with G protein–coupled receptor (GPCR) signaling and IL-10 signaling, all of which were key to immune function (Figure 7D). As shown in Figure 7E, twelve hub targets were identified through the protein–protein interaction analysis, with the top three ranked genes being signal transducer and activator of transcription 3 (STAT3), heat shock protein 90 alpha family class A member 1 (HSP90AA1), and nuclear factor kappa B subunit 1 (NFKB1). The GeneMANIA tool was utilized to construct a co-expression network and predict the functions of the hub genes, and the result indicated that the hub genes and their related molecules were correlated to leukocyte migration, response to reactive oxygen species, fatty acid metabolic process, and vascular associated smooth muscle cell differentiation (Figure 7F).
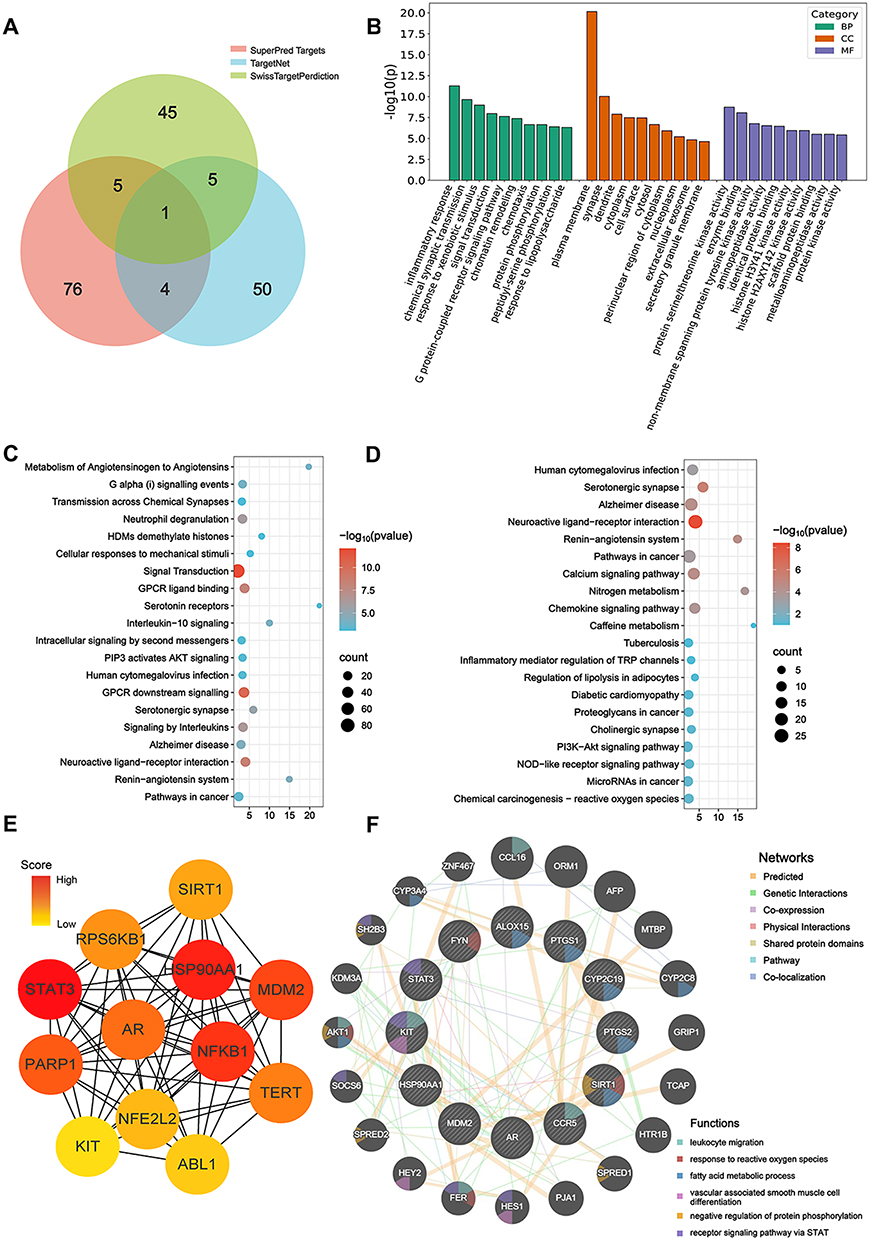 |
Figure 7 Enrichment analyses and PPI network with hub gene analyses of DQ targets. (A) Venn diagram showing the 186 targets shared with the targets of DQ. (B) The top 5 CC, BP, and MF enriched by DQ-related targets. (C) The top 20 KEGG pathways. (D) The top 20 Reactome enrichment. (E) PPI network of 12 hub targets. (F) Co-expression network of hub genes analyzed by GeneMANIA. |
Discussion
Our study demonstrates that acute DQ poisoning induces profound immune dysregulation, which is associated with poor outcomes. Patients exhibited increased levels of WBC, neutrophils, and monocytes, but marked reductions in lymphocytes, NK cells, and T-cell subsets (CD4+ and CD8+), with more pronounced suppression in non-survivors. T-cell activation markers were generally down-regulated, and cytokine profiling revealed concurrent elevations in both pro- and anti-inflammatory mediators, particularly IL-6 and IL-10 in the death group. Together, these findings indicate a maladaptive immune response characterized by hyperinflammation, T-cell exhaustion, and impaired immune surveillance, resembling patterns previously reported in PQ poisoning.28 An illustrative case of a splenectomized patient who ingested a lethal dose of DQ but survived with low IL-6 and IL-10 levels suggests that the absence of splenic immune activation may mitigate systemic inflammation. Although anecdotal, this observation supports the hypothesis that immune escalation, rather than toxic burden alone, mediates adverse outcomes.
Among clinical biomarkers, PCT emerged as an independent predictor of mortality. Normally produced at low levels by thyroid C cells, PCT rises during systemic inflammation and infection, making it a widely used biomarker in critical illness.29,30 Our study found that PCT levels increased following exposure to DQ and were particularly significant in predicting patient outcomes, aligning with findings from other research groups.31 We propose several mechanisms for the PCT elevation associated with DQ poisoning:
(1) As an acute phase reactant, PCT reflects systemic inflammatory activation induced by DQ-related tissue and organ damage.
(2) Immune suppression caused by DQ may predispose patients to secondary bacterial infections. Additionally, gastrointestinal injury, including intestinal edema, paralytic ileus, and bacterial translocation, may further contribute to infection-related PCT elevation.32,33
(3) PCT may also be upregulated in the absence of infection, particularly in the context of liver damage. Our data show increased AST and ALT levels in DQ patients, which is consistent with prior findings that hepatic injury can serve as a non-infectious source of PCT.34,35
(4) Finally, PCT may directly impair vascular integrity.35,36 Emerging evidence suggests that PCT promotes microvascular leakage by activating Src kinase and disrupting VE-cadherin complexes.37,38 This vascular dysfunction may contribute to circulatory collapse, a common cause of death in DQ poisoning.2,39 Agents such as sitagliptin, which inhibit DPP4 and modulate PCT signaling, may offer therapeutic benefit. Further studies are warranted to elucidate the vascular effects of PCT and explore novel interventions.
Our network pharmacology analysis identified several hub genes, including STAT3, HSP90AA1, and NFKB1. These molecules are well-recognized regulators of immune and inflammatory processes: STAT3 modulates cytokine signaling such as IL-6 and IL-10,40–42 HSP90AA1 functions as a molecular chaperone involved in stress responses and immune regulation,43 and NFKB1 controls a broad range of pro-inflammatory mediators.44 While their exact roles in DQ poisoning remain to be determined, these pathways have been widely implicated in immune and inflammatory regulation in other toxic or inflammatory conditions. Our enrichment findings, which align with the established roles of these pathways in immune and inflammatory regulation, and raise the possibility of their involvement in the immune dysregulation observed in DQ poisoning. These results should be considered hypothesis-generating and call for further mechanistic validation. Interestingly, previous research has also indicated that STAT3 may regulate the expression of PCT.45 This observation is consistent with our findings that elevated PCT levels following DQ exposure are emerged as a strong independent predictor of mortality.
However, this study has several limitations. First, T cell activation markers were only available in a subset of patients due to testing constraints, potentially introducing selection bias. Second, the dynamic changes of inflammatory markers over time were not assessed. Third, the network pharmacology analysis suggested potential hub genes; however, these findings are preliminary and lack direct validation in clinical samples of DQ poisoning. These results should thus be regarded as hypothesis-generating and warrant further experimental and clinical confirmation. Future prospective studies with larger cohorts and longitudinal sampling will be essential to validate our findings and to investigate the kinetics of immune responses during the clinical course of DQ poisoning. Furthermore, mechanistic studies exploring the potential therapeutic modulation of the PCT-endothelial axis may yield novel treatment strategies.
Conclusions
Acute DQ poisoning is associated with profound immune dysregulation that correlates with poor outcomes. PCT was identified as an independent predictor of 28-day mortality, highlighting its potential utility for early risk assessment and clinical decision-making. These findings underscore the importance of immune monitoring in DQ poisoning and point to PCT and immune-inflammatory pathways as promising targets for future clinical application and therapeutic exploration.
Abbreviations
AISI, Aggregate index of systemic inflammation; ALT, Alanine aminotransferase; APC, Allophycocyanin; APTT, Activated partial thromboplastin time; AST, Aspartate aminotransferase; AUC, Area under the curve; CBC, Complete blood count; CD, Cluster of differentiation; CK, Creatine kinase; CK-MB, Creatine kinase-MB; CRP, C-reactive protein; DBIL, Direct bilirubin; dNLR, Derived neutrophil-to-lymphocyte ratio; DQ, Diquat; FITC, Fluorescein isothiocyanate; GFR, Glomerular filtration rate; GGT, Gamma-glutamyl transferase; GO, Gene Ontology; HLA-DR, Human leukocyte antigen – DR isotype; HSP90AA1, Heat shock protein 90 alpha family class A member 1; IFN-γ, Interferon-gamma; IDBIL, Indirect bilirubin; IL, Interleukin; INR, International normalized ratio; IQR, Interquartile range; KEGG, Kyoto Encyclopedia of Genes and Genomes; LASSO, Least absolute shrinkage and selection operator; LDH, Lactate dehydrogenase; MCC, Maximal Clique Centrality; MLR, Monocyte-to-lymphocyte ratio; NFKB1, Nuclear factor kappa B subunit 1; NK, Natural killer (cells); NLPR, Neutrophil-to-lymphocyte platelet ratio; NLR, Neutrophil-to-lymphocyte ratio; PCT, Procalcitonin; PE, Phycoerythrin; PerCP, Peridinin chlorophyll protein; PLR, Platelet-to-lymphocyte ratio; PPI, Protein–protein interaction; PQ, Paraquat; PT, Prothrombin time; ROC, Receiver operating characteristic; ROS, Reactive oxygen species; SII, Systemic immune-inflammation index; SIRI, Systemic inflammation response index; SMILES, Simplified molecular-input line-entry system; STAT3, Signal transducer and activator of transcription 3; TBIL, Total bilirubin; Th1/Th2/Th17, T helper cell types 1, 2, and 17; TRP, Transient receptor potential; TNF-α, Tumor necrosis factor alpha; TT, Thrombin time; VE-cadherin, Vascular endothelial cadherin; WBC, White blood cells.
Ethics Approval and Consent to Participate
This study was approved by the Ethics Committee of The First Affiliated Hospital, Zhejiang University School of Medicine (20230483). All participants provided broad informed consent at their first visit. This study adhered to the principles of the Declaration of Helsinki.
Data Sharing Statement
Due to concerns regarding patient privacy, data sharing is restricted solely to academic research purposes, and only aggregated study data will be available to researchers. Upon publication, researchers may request access to the aggregated data by submitting a reasonable request with proposed analysis plans to the corresponding author, Dr. Yuan-Qiang Lu (E-mail: [email protected]). Data requestors will be required to sign a data access agreement.
Author Contributions
All authors made a significant contribution to the work reported, whether that is in the conception, study design, execution, acquisition of data, analysis and interpretation, or in all these areas; took part in drafting, revising or critically reviewing the article; gave final approval of the version to be published; have agreed on the journal to which the article has been submitted; and agree to be accountable for all aspects of the work.
Funding
This work was supported by the National Key Research and Development Program of China (2023YFC3603100 and 2023YFC3603105), the Major Humanities and Social Sciences Research Projects in Zhejiang higher education institutions (2024GH008), and the Project of Zhejiang Provincial Department of Education (No. Y202353933).
Disclosure
The authors certify that there is no conflict of interest with any financial organization regarding the material discussed in the manuscript.
References
1. Magalhães N, Carvalho F, Dinis-Oliveira RJ. Human and experimental toxicology of diquat poisoning: toxicokinetics, mechanisms of toxicity, clinical features, and treatment. Hum Exp Toxicol. 2018;37(11):1131–1160. doi:10.1177/0960327118765330
2. Zhou J-N, Lu Y-Q. Lethal diquat poisoning manifests as acute central nervous system injury and circulatory failure: a retrospective cohort study of 50 cases. EClinicalMedicine. 2022;52:101609. doi:10.1016/j.eclinm.2022.101609
3. Ren Y, Guo F, Wang L. Imaging findings and toxicological mechanisms of nervous system injury caused by diquat. Mol Neurobiol. 2024;61(11):9272–9283. doi:10.1007/s12035-024-04172-x
4. Yu G, Wang J, Jian T, et al. Case series: diquat poisoning with acute kidney failure, myocardial damage, and rhabdomyolysis. Front Public Health. 2022;10:991587. doi:10.3389/fpubh.2022.991587
5. Aloise DM, Memon A, Zaldivar A. Diquat herbicide organophosphate poisoning and multi-organ failure: a case report. Cureus. 2022;14(7):e27241. doi:10.7759/cureus.27241
6. Zeng D-H, Chen X-H, Li Y, et al. Clinical and pathological characteristics of acute kidney injury caused by diquat poisoning. Clin Toxicol (Phila). 2023;61(9):705–708. doi:10.1080/15563650.2023.2262113
7. Ling Y, Mao Z, Liu W, et al. Severity indices of diquat poisoning for triage and prognosis in acute diquat poisoning: a multicenter prospective cohort study. Ann Emerg Med. 2025;85:512–520. doi:10.1016/j.annemergmed.2025.02.022
8. Xiao Y, Lin X, Zhou M, et al. Metabolomics analysis of the potential toxicological mechanisms of diquat dibromide herbicide in adult zebrafish (Danio rerio) liver. Fish Physiol Biochem. 2022;48(4):1039–1055. doi:10.1007/s10695-022-01101-4
9. Zhou H-Y, Li T, Lu Y-Q. Baicalin and its nanoliposome ameliorate diquat-induced liver injury by promoting PINK1/Parkin-dependent mitophagy. Hepatobiliary Pancreat Dis Int. 2025;24:527–534. doi:10.1016/j.hbpd.2025.06.008
10. Lai K, Wang J, Lin S, et al. Sensing of mitochondrial DNA by ZBP1 promotes RIPK3-mediated necroptosis and ferroptosis in response to diquat poisoning. Cell Death Differ. 2024;31(5):635–650. doi:10.1038/s41418-024-01279-5
11. Meng N, Sun Y, Dong Y, et al. Prognostic value of plasma diquat concentration in patients with acute oral diquat poisoning: a retrospective study. Front Public Health. 2024;12:1333450. doi:10.3389/fpubh.2024.1333450
12. Zhang Y, Chen X, Du H, Zhao M, Jiang X. Association between initial diquat plasma concentration, severity index and in-hospital mortality in patients with acute diquat poisoning: a retrospective cohort study. Clin Toxicol (Phila). 2024;62(9):557–563. doi:10.1080/15563650.2024.2387649
13. Mao Z, Yu Y, Sun H, et al. Development and validation of a sensitive and high throughput UPLC-MS/MS method for determination of paraquat and diquat in human plasma and urine: application to poisoning cases at emergency departments of hospitals. Forensic Toxicol. 2022;40(1):102–110. doi:10.1007/s11419-021-00603-9
14. Miao C, Fan D. Identification of differentially expressed genes and pathways in diquat and paraquat poisoning using bioinformatics analysis. Toxicol Mech Methods. 2022;32(9):678–685. doi:10.1080/15376516.2022.2063095
15. Cao ZX, Song YQ, Bai WJ, et al. Neutrophil-lymphocyte ratio as an early predictor for patients with acute paraquat poisoning: a retrospective analysis. Medicine (Baltimore). 2019;98(37):e17199. doi:10.1097/MD.0000000000017199
16. Dundar ZD, Ergin M, Koylu R, Ozer R, Cander B, Gunaydin YK. Neutrophil-lymphocyte ratio in patients with pesticide poisoning. J Emerg Med. 2014;47(3):286–293. doi:10.1016/j.jemermed.2014.01.034
17. Zhou D-C, Zhang H, Luo Z-M, Zhu Q-X, Zhou C-F. Prognostic value of hematological parameters in patients with paraquat poisoning. Sci Rep. 2016;6:36235. doi:10.1038/srep36235
18. Daina A, Michielin O, Zoete V. SwissTargetPrediction: updated data and new features for efficient prediction of protein targets of small molecules. Nucleic Acids Res. 2019;47(W1):W357–W364. doi:10.1093/nar/gkz382
19. Yao Z-J, Dong J, Che Y-J, et al. TargetNet: a web service for predicting potential drug-target interaction profiling via multi-target SAR models. J Comput Aided Mol Des. 2016;30(5):413–424. doi:10.1007/s10822-016-9915-2
20. Gallo K, Goede A, Preissner R, Gohlke B-O. SuperPred 3.0: drug classification and target prediction-a machine learning approach. Nucleic Acids Res. 2022;50(W1):W726–W731. doi:10.1093/nar/gkac297
21. Dennis G, Sherman BT, Hosack DA, et al. DAVID: database for annotation, visualization, and integrated discovery. Genome Biol. 2003;4(5):P3. doi:10.1186/gb-2003-4-5-p3
22. Szklarczyk D, Kirsch R, Koutrouli M, et al. The STRING database in 2023: protein-protein association networks and functional enrichment analyses for any sequenced genome of interest. Nucleic Acids Res. 2023;51(D1):D638–D646. doi:10.1093/nar/gkac1000
23. Zhou Y, Zhou B, Pache L, et al. Metascape provides a biologist-oriented resource for the analysis of systems-level datasets. Nat Commun. 2019;10(1):1523. doi:10.1038/s41467-019-09234-6
24. Szeto C, Bloom JI, Sloane H, et al. Impact of HLA-DR antigen binding cleft rigidity on T cell recognition. Int J Mol Sci. 2020;21(19):7081. doi:10.3390/ijms21197081
25. Kar A, Mehrotra S, Chatterjee S. CD38: t cell immuno-metabolic modulator. Cells. 2020;9(7). doi:10.3390/cells9071716
26. Esensten JH, Helou YA, Chopra G, Weiss A, Bluestone JA. CD28 costimulation: from mechanism to therapy. Immunity. 2016;44(5):973–988. doi:10.1016/j.immuni.2016.04.020
27. Cibrián D, Sánchez-Madrid F. CD69: from activation marker to metabolic gatekeeper. Eur J Immunol. 2017;47(6):946–953. doi:10.1002/eji.201646837
28. Gao Y, Guo S, Wang Y, et al. Lymphocyte and its CD4+ and CD8+ subgroup changes after paraquat poisoning. Hum Exp Toxicol. 2019;38(9):1024–1030. doi:10.1177/0960327119851252
29. Russwurm S, Stonans I, Stonane E, et al. Procalcitonin and CGRP-1 mrna expression in various human tissues. Shock. 2001;16(2):109–112. doi:10.1097/00024382-200116020-00004
30. Assicot M, Gendrel D, Carsin H, Raymond J, Guilbaud J, Bohuon C. High serum procalcitonin concentrations in patients with sepsis and infection. Lancet. 1993;341(8844):515–518. doi:10.1016/0140-6736(93)90277-n
31. He C, Liang L, Zhang Y, Wang T, Wang R. Prognosis prediction of procalcitonin within 24 h for acute diquat poisoning. BMC Emerg Med. 2024;24(1):61. doi:10.1186/s12873-024-00975-2
32. Valiante F, Farinati F, Dal Santo P, Germanà B, Di Mario F, Naccarato R. Upper gastrointestinal injury caused by diquat. Gastrointest Endosc. 1992;38(2):204. doi:10.1016/S0016-5107(92)70404-0
33. Tanen DA, Curry SC, Laney RF. Renal failure and corrosive airway and gastrointestinal injury after ingestion of diluted diquat solution. Ann Emerg Med. 1999;34(4 Pt 1):542–545. doi:10.1016/s0196-0644(99)80059-6
34. Tschiedel E, Assert R, Felderhoff-Müser U, et al. Undue elevation of procalcitonin in pediatric paracetamol intoxication is not explained by liver cell injury alone. Ann Hepatol. 2018;17(4):631–637. doi:10.5604/01.3001.0012.0932
35. Nuzzo A, Salem S, Malissin I, et al. Plasma procalcitonin may be an early predictor of liver injury in acetaminophen poisoning: a prospective cohort study. United European Gastroenterol J. 2021;9(5):571–580. doi:10.1002/ueg2.12093
36. Brabenec L, Müller M, Hellenthal KEM, et al. Targeting procalcitonin protects vascular barrier integrity. Am J Respir Crit Care Med. 2022;206(4):488–500. doi:10.1164/rccm.202201-0054OC
37. Wallez Y, Cand F, Cruzalegui F, et al. Src kinase phosphorylates vascular endothelial-cadherin in response to vascular endothelial growth factor: identification of tyrosine 685 as the unique target site. Oncogene. 2007;26(7):1067–1077. doi:10.1038/sj.onc.1209855
38. Xiao K, Garner J, Buckley KM, et al. p120-Catenin regulates clathrin-dependent endocytosis of VE-cadherin. Mol Biol Cell. 2005;16(11):5141–5151. doi:10.1091/mbc.e05-05-0440
39. Cen X-Y, Chen Y, Xu Y-A, Zhong G-Y. Vascular endothelium, a promising target for effectively treating fulminant diquat intoxication? World J Clin Cases. 2024;12(17):2917–2920. doi:10.12998/wjcc.v12.i17.2917
40. Sun J-Y, Du L-J, Shi X-R, et al. An IL-6/STAT3/MR/FGF21 axis mediates heart-liver cross-talk after myocardial infarction. Sci Adv. 2023;9(14):eade4110. doi:10.1126/sciadv.ade4110
41. Zhao Q, Dai H, Jiang H, et al. Activation of the IL-6/STAT3 pathway contributes to the pathogenesis of membranous nephropathy and is a target for Mahuang Fuzi and Shenzhuo Decoction (MFSD) to repair podocyte damage. Biomed Pharmacother. 2024;174:116583. doi:10.1016/j.biopha.2024.116583
42. Ulrich C, Fiedler R, Herberger E, Canim Z, Markau S, Girndt M. Hypervolemia in dialysis patients impairs STAT3 signaling and upregulates miR-142-3p: effects on IL-10 and IL-6. Int J Mol Sci. 2024;25(7):3719. doi:10.3390/ijms25073719
43. Yu Z, Hong X, Zhang X, et al. Global proteomic analyses reveals abnormal immune regulation in patients with new onset ankylosing spondylitis. Front Immunol. 2022;13:838891. doi:10.3389/fimmu.2022.838891
44. Sun S-C. The non-canonical NF-κB pathway in immunity and inflammation. Nat Rev Immunol. 2017;17(9):545–558. doi:10.1038/nri.2017.52
45. Zhang F, Fan X, Bai Y, et al. miR-125b regulates procalcitonin production in monocytes by targeting Stat3. Microbes Infect. 2016;18(2):102–108. doi:10.1016/j.micinf.2015.09.027
 © 2025 The Author(s). This work is published and licensed by Dove Medical Press Limited. The
full terms of this license are available at https://www.dovepress.com/terms
and incorporate the Creative Commons Attribution
- Non Commercial (unported, 4.0) License.
By accessing the work you hereby accept the Terms. Non-commercial uses of the work are permitted
without any further permission from Dove Medical Press Limited, provided the work is properly
attributed. For permission for commercial use of this work, please see paragraphs 4.2 and 5 of our Terms.
© 2025 The Author(s). This work is published and licensed by Dove Medical Press Limited. The
full terms of this license are available at https://www.dovepress.com/terms
and incorporate the Creative Commons Attribution
- Non Commercial (unported, 4.0) License.
By accessing the work you hereby accept the Terms. Non-commercial uses of the work are permitted
without any further permission from Dove Medical Press Limited, provided the work is properly
attributed. For permission for commercial use of this work, please see paragraphs 4.2 and 5 of our Terms.