Back to Journals » International Journal of Chronic Obstructive Pulmonary Disease » Volume 18
Early Diagnosis of High-Risk Chronic Obstructive Pulmonary Disease Based on Quantitative High-Resolution Computed Tomography Measurements
Authors Zhang W ![]() , Zhao Y, Tian Y, Liang X
, Zhao Y, Tian Y, Liang X ![]() , Piao C
, Piao C
Received 19 September 2023
Accepted for publication 15 December 2023
Published 27 December 2023 Volume 2023:18 Pages 3099—3114
DOI https://doi.org/10.2147/COPD.S436803
Checked for plagiarism Yes
Review by Single anonymous peer review
Peer reviewer comments 2
Editor who approved publication: Prof. Dr. Richard Russell
Wenxiu Zhang,1,* Yu Zhao,2,* Yuchi Tian,1 Xiaoyun Liang,1 Chenghao Piao2
1Institute of Research and Clinical Innovations, Neusoft Medical Systems Co, Ltd, Shanghai, People’s Republic of China; 2Radiology Department, Second Affiliated Hospital of Shenyang Medical College, Shenyang, Liaoning, People’s Republic of China
*These authors contributed equally to this work
Correspondence: Chenghao Piao, First Floor, Radiology Department, Second Affiliated Hospital of Shenyang Medical College, No. 64, Qishan West Road, Huanggu District, Shenyang, Liaoning, People’s Republic of China, Tel +0086-18002452977, Email [email protected]
Purpose: Quantitative computed tomography (QCT) techniques, focusing on airway anatomy and emphysema, may help to detect early structural changes of COPD disease. This retrospective study aims to identify high-risk COPD participants by using QCT measurements.
Patients and Methods: We enrolled 140 participants from the Second Affiliated Hospital of Shenyang Medical College who completed inspiratory high-resolution CT scans, pulmonary function tests (PFTs), and clinical characteristics recorded. They were diagnosed Non-COPD by PFT value of FEV1/FVC > 70% and divided into two groups according percentage predicted FEV1 (FEV1%), low-risk COPD group: FEV1% ≥ 95%, high-risk group: 80% < FEV1% < 95%. The QCT measurements were analyzed by the Student’s t-test (or Mann–Whitney U-test) method. Then, feature candidates were identified using the LASSO method. Meanwhile, the correlation between QCT measurements and PFTs was assessed by the Spearman rank correlation test. Furthermore, support vector machine (SVM) was performed to identify high-risk COPD participants. The performance of the models was evaluated in terms of accuracy (ACC), sensitivity (SEN), specificity (SPE), F1-score, and area under the ROC curve (AUC), with p < 0.05 considered statistically significant.
Results: The SVM based on QCT measurements achieved good performance in identifying high-risk COPD patients with 85.71% of ACC, 88.34% of SEN, 84.00% of SPE, 83.33% of F1-score, and 0.93 of AUC. Further, QCT measurements integration of clinical data improved the performance with an ACC of 90.48%. The emphysema index (%LAA− 950) of left lower lung was negatively correlated with PFTs (P < 0.001). The airway anatomy indexes of lumen diameter (LD) were correlated with PFTs.
Conclusion: QCT measurements combined with clinical information could provide an effective tool for an early diagnosis of high-risk COPD. The QCT indexes can be used to assess the pulmonary function status of high-risk COPD.
Keywords: early diagnosis, QCT measurements, COPD, SVM
Introduction
Chronic obstructive pulmonary disease (COPD) is a progressive and irreversible chronic airway disease, characterized by limited airflow and airway diseases, mainly manifested as emphysema and bronchial diseases.1 There are many clinical symptoms of COPD, including persistent cough, wheezing, expectoration, chest tightness, breathing difficulties, etc. In 2020, according to the report of the World Health Organization, COPD was the third leading cause of death in the world, with a global prevalence rate of 10.1%, among which China and India accounted for more than 50%, resulting in a serious economic burden on society. The latest research shows that the incidence rate of COPD in China has been increasing, with nearly 99 million patients over 40 years old, accounting for 13.7% of the population over 40 years old in China.2 However, patients’ symptoms were usually mild in the early stages of COPD, and early effective interventions including quitting smoking, and avoiding air pollution can significantly alleviate symptoms such as cough, chest tightness, and difficulty breathing, thereby improving the patient’ s quality of life.3 Pulmonary rehabilitation strategies such as maintaining airway patency, keeping exercise, and doing respiratory training can improve cardiovascular tolerance and enhance lung function.4 Early diagnosis and treatment of COPD may reduce the incidence of exacerbations of acute COPD, which leads to reduced use of health service resources in the future.5 Therefore, early detection and treatment of COPD are imperative.
The diagnosis of COPD is mainly based on pulmonary function tests (PFTs), but there are still some limitations in detecting changes in lung structure or function in early COPD.6 In particular, abnormal changes may only be appreciable when the proportion of lung tissue destruction is above 30% or the proportion of small airway obstruction is about 75%.7 In contrast, while there might be an absence of airflow obstruction on post-bronchodilator spirometry, there can be significant changes in imaging findings; in fact, it was shown that pathological features of emphysema were identified in patients with early COPD whilst these subjects retain normal spirometry.8 High-resolution computed tomography (HRCT) enables the quantification of abnormal changes in the lung parenchyma, including emphysema and bronchitis and serve as a reliable diagnostic method for potential COPD patients.9 In addition, many similarities between COPD and asthma complicate the pathophysiology, clinical presentation, and therapy. The overlap of the clinical presentation of severe asthma and COPD introduces challenges in clinical practice.10 HRCT could be used to quantify static and dynamic changes in multiple independent airways as small as 1 mm, thus making it possible to study the subtle structure changes in the airway diseases, which is useful in COPD/ asthma phenotyping diagnosis and may raise the diagnosis rate of accuracy.11 HRCT could also help understand relationships between bronchiectasis and emphysema in the overlap of the clinical presentation of COPD and bronchiectasis.12 HRCT has been used to define and classify patients with COPD into two main categories: emphysema-dominated and airway-dominated diseases. Relevant studies revealed that either airway injury or changes in the lung parenchyma in COPD had an impact on airflow restrictions.13 Furthermore, the changes in lung parenchyma impacted lung function more significantly compared with airway injury.14 Therefore, further in-depth research was needed to investigate those patients without airflow limitation but have structural changes in HRCT.
With the rapid development of medical imaging technology, CT quantitative (QCT) analysis has gained increasing importance in evaluating COPD by analyzing the degree of emphysema as well as airway inflammation and remodeling, which has complemented visual CT and has been mostly utilized in research settings.15,16 It was shown that QCT assessment of emphysema, using the density mask technique, correlates quite well with spirometric measurements, pathologic severity of emphysema, and spirometric evaluation with the clinical status of COPD patients.17–20 The density mask was introduced in 1988 and was based on a predefined voxel as a threshold to differentiate between areas of normal attenuation values and areas of low attenuation (LAA).21 Specifically, Gevenois et al reported the strongest pathological correlation with emphysema at both macroscopic and microscopic levels, at −950 HU on 1 mm non-contrast enhanced HRCT.22,23 Recently, relevant research reports have shown that the most commonly used CT threshold is -950HU.24,25 However, Aslan et al found the %LAA−910 method showed significant correlations with forced expiratory volume in one second (FEV1) compared to other densitometric measurements.26 Uthoff et al also calculated emphysema areas by using the percentage of lung volume less than −910 HU.27 For the method of approximating the density mask with the best fit to the emphysematous lesion, we here explored the threshold of −950HU and-910 HU to evaluate emphysema areas. QCT may also estimate the degree of airway lesions directly by using airway measurements, such as airway wall thickness (WT), luminal diameter (LD), and airway wall area percent (WA%).28,29 Accumulating studies have been employing QCT to assess structural changes in airways, such as the identification of smoking-associated airway remodeling, the assessment of airway wall thickness in asthma, and the assessment of lung cancer risk.27,30,31 In a previous COPD study, it was demonstrated that QCT measurements of emphysema and airway diseases were correlated with disease severity in patients with COPD and could support the identification of other lung diseases, such as fibrotic interstitial lung disease, and asthma.32–34 However, further studies are needed to evaluate whether QCT of emphysema and airway disease helps identify early COPD.
FEV1 to forced expiratory vital capacity (FVC) of less than 0.7 is the gold standard to confirm the diagnosis of COPD. However, the diagnosis of early COPD is unclear and controversial because it may start early in life but it takes a long time to manifest clinically.35 Some studies have investigated the participants with high-risk COPD who aged over 18 years old and have clinical respiratory symptoms and explored the potential differences of deformation in COPD with different severity of airflow limitation based on the quantitative CT of lung motion;36 only the QCT of emphysema were considered here and the inclusion criteria were worth pursuing. According to the global initiative for COPD, the decrease in FEV1 is considered to be a predictor of COPD development, which can serve to determine the severity of airflow obstruction.37 Thus, Regan et al defined the high-risk COPD patients as those with FEV1/FVC >70% and a percentage predicted FEV1 (FEV1%) ≥80% and found those people had CT evidence of emphysema or airway thickening.38 In the latest research, Yang et al focused on people who had normal lung function with FEV1/FVC >70% and FEV1% ≥80%, demonstrating that QCT measurements including emphysema and airway parameters have a good differentiation for exploring the abnormal of early COPD development.39 However, the scan of dual-phase CT increased the exposure to radiation dose. In a previous study, the following criteria were employed to define the high-risk group: (i) FEV1/FVC >70%; and (ii) FEV1% <95%.40 Given this, the risk of pre-COPD was defined according to FEV1% predicted value, including high-risk COPD group: FEV1/FVC >70% and 80%<FEV1%<95%, low-risk COPD group: FEV1/FVC>70% and FEV1%≥95%. The objective of our study is to explore the feasibility to identify participants of high-risk COPD at an early stage by combining QCT measurements with clinical information based on inspiratory HRCT.
Materials and Methods
Participants
In this retrospective study, we enrolled the 190 participants from the Second Affiliated Hospital of Shenyang Medical College from June 2022 to January 2023, underwent inspiratory HRCT scans and PFTs according to the American Thoracic Society (ATS) guidelines. PFTs included forced expiratory volume in one second (FEV1), forced vital capacity (FVC), FEV1/FVC, and FEV1% post inhalation of 250 µg ipratropium bromide or albuterol. These participants with normal lung function of FEV1/FVC>70% were divided into two groups by the value of FEV1%, low-risk COPD: FEV1%≥95%, high-risk COPD: 80% <FEV1% <95%. Written informed consent was obtained from all participants.
The inclusion criteria were: 1) aged between 45 and 80 years old; 2) had a smoking history or exposure to dust or chemicals; 3) had respiratory symptoms (cough, and/or expectoration, and/or chest tightness, and/or shortness of breath, and/or wheezing, and/or dyspnea); Therein the degree of dyspnea evaluated based on the modified British medical research council (mMRC) scale.41 4) no previous thoracic operation including pulmonary resection, thoracoplasty, and bronchoscopic intervention therapy.
Exclusion criteria: 1) poor image quality (eg severe artifacts) that is unable to carry out QCT analysis; 2) The QCT measurements calculated by the commercial scientific software have missing values; 3) Obvious mass lesions in the lungs, large infectious lesions, pulmonary interstitial fibrosis, chest congenital malformations, pulmonary tuberculosis or bronchiectasis, etc.; 4) pleural effusion; 5) participating in double-blind drug clinical trials. Figure 1 demonstrates a flowchart detailing participant selection and 140 participants were included in the current study according to the inclusion and exclusion criteria.
 |
Figure 1 Study flow diagram. |
Computed Tomography Scan
A unified CT scanning protocol was used to ensure the accuracy and reliability of the CT image. These operating specifications include but are not limited to the determination of scanning range and parameters, the selection of scanning methods and parameters, and the same reconstruction method. Specifically, CT scans were performed on a 512‑slice scanner (NeuViz Epoch, Neusoft medical systems, Shenyang, China) in a craniocaudal direction with breath‑hold from the lung apices to lateral costophrenic sulci, with 1 mm reconstructed slice thickness, 120 kV, and 144 mA at a collimation of 512×0.4 mm, and pitch of 0.5. Patients with breathing difficulties received guidance and consultation before the scan, and all scans were performed after breath‑hold practice.
QCT Measurements
The NeuLungCARE software (Neusoft Medical Systems Co. Ltd, Shenyang, Liaoning, China), a commercial scientific software, was employed to segment the airway tree and lung lobes on inspiratory CT images in an automated way (Figure 2), thus quantifying emphysema and airways lesions.
 |
Figure 2 Labeled lung lobe and airway tree. Notes: (a) Lung lobe: right upper lobe (RUL) labeled dark blue, right middle lobe (RML) labeled cyan, and right lower lobe (RLL) labeled brown, as well as left upper lobe (LUL) labeled purple and left lower lobe (LLL) labeled green. (b) Airway tree: the trachea is assigned to generation 0 labeled white color; right main bronchus and left main bronchus to generation 1 labeled red color; lobe bronchi to generation 2 labeled yellow color; segmental bronchi to generation 3 labeled light blue and sub-segmental bronchi labeled green. |
The emphysema measurements were acquired: the percentage low attenuation area with attenuation less than −950 HU (%LAA−950) and −910HU (%LAA−910) for the whole lung as well as for each lobe separately, including right upper lobe (RUL), right middle lobe (RML), and right lower lobe (RLL), as well as left upper lobe (LUL) and left lower lobe (LLL) in Figure 2a. %LAA−950 and %LAA−910 have been pathologically validated as a measure of emphysema.42,43 As seen in Figure 3, one density mask (−950 to −1024 HU) was applied to calculate the value of % LAA−950 and the other density mask (−910 to −1024 HU) was applied to calculate the value of % LAA−910 by using the NeuLungCARE workstation, the example of the emphysema distribution in low-risk and high-risk COPD participant shown in Figure 3a and b, respectively; CT attenuation at the 15th percentile of the lung CT histogram (Per 15), was also calculated for the evaluation of emphysema.44
 |
Figure 3 Quantitative CT of emphysema. Notes: lung voxels ≤ −950 HU in CT value are red color-coded; lung voxels> −950 HU and 910HU in CT value are yellow color-coded; lung voxels> −910 HU in CT value are green color-coded; (a) A low-risk COPD participant with mild emphysema. (b) A high-risk COPD participant with moderate emphysema. |
Airways were also assessed with NeuLungCARE software, providing the following parameters: airway wall area percentage (%WA, %WA = wall area/total bronchial cross-sectional area × 100), wall thickness (WT), lumen diameter (LD), and the square root of the wall area of a theoretical airway with an internal perimeter of 10 mm (Pi10). WA% is a standard computed tomographic (CT) measure of airway morphology presented airway remodeling process;45,46 the Pi 10 was calculated by plotting the internal perimeters of all segmental and distal airways against the square root of their wall areas, which can overcome the problem of variable bronchus sizes and anatomical in homogeneities.47
The airway length (reported in mm) was measured as the distance between the branching point of the parent and child branches by placing a smoothed centerline through the lumen. We calculate the WT and LD every 2 mm for each airway. For an airway with a length of 10mm, we would measure the WT and LD five times and analyze the maximal, minimal, and mean values of WT and LD as the quantitative values of this airway.
The color-coded rendering of the labeled bronchial tree was also visually inspected and the colors should correspond to the example given in Figure 2b. From the trachea bronchi to the sub-segmental bronchi, the generation number was increased by one after each branching (bifurcation). Finally, WA% and Pi10 from 0th to 4th generation bronchi, the mean WT, maximal WT (min WT), minimal WT (max WT), and LD from 0th to 4th generation bronchi were quantified.
Statistical Methods
Statistical analyses were performed using IBM SPSS (Statistical Package for the Social Sciences) Statistics Software (version 27.0, SPSS Inc. Chicago, IL, USA). The normality of QCT measurements was tested with the Shapiro–Wilk test.48 Data are presented as means ± (standard deviation, SD) or median (interquartile range, IQR) for continuous variables according to their distribution type and as frequency (%) for categorical variables. Comparisons of subjects’ characteristics were performed using t-test, or Wilcoxon as appropriate.49 The correlations between QCT measurements and FEV1, FVC, and FEV1/FVC were assessed by the Spearman rank correlation test, with P < 0.05 considered as statistically significant.
Construction of High-Risk COPD Prediction Model
After variance analysis, the least absolute shrinkage and selection operator (LASSO) model was used to further characterize the candidate features, which represents a regression analysis algorithm that applies regularization for variable selection.50 The optimal regularization coefficient lambda of the LASSO method was determined through ten-fold cross-validation, where the final feature candidates were selected based on their minimum average mean square error (MSE).
In a review study, machine learning has made great progress to better tackle COPD.51,52 The SVM classifier has been used for COPD identification and severity classification in previous studies.53 Thus, the SVM classifier was also performed in the construction of a high-risk COPD prediction model. Since the dimensions of variables were inconsistent and the range of values was large, to avoid tedious calculation and ignore small numerical data, SVM was applied to normalize the data using Z-score before modeling. Firstly, the classification between low-risk COPD and high-risk COPD is based on QCT measurements. Secondly, clinical data that were significantly different between the two groups were also added to improve the accuracy of the model. In detail, the subjects were divided into training sets (n = 98) and test sets (n = 42) in a ratio of 7:3. The penalty and kernel parameters were determined by using grid search and 10-fold cross-validation and four kernel function models of SVM, ie Linear, Poly, Sigmoid, and radial basis functions (RBF), are constructed. All analyses were performed using the “Scikit-learn” package in Python (https://scikit-learn.org/stable/index.html).
Results
Clinical Characteristics of Study Groups
Basic clinical information and PFTs of the low-risk COPD group and high-risk COPD group are summarized in Table 1. There were significant statistical differences in sex, dyspnea, persistent cough, FEV1, FVC, and FEV1/FVC between the two groups (p < 0.001).
 |
Table 1 Basic Clinical Information Between Low-Risk COPD and High-Risk COPD Groups |
QCT Measurements Between Study Groups
As shown in Table 2, all measurements evaluated the severity of emphysema including perc15, %LAA−910, and %LAA−950 showed significant statistical differences in two groups (P < 0.001). The min LD in the 0th-4th generations airway showed significant differences between the two groups (P < 0.05). For types of %WA, mean LD, and max LD, all of them had significant differences within the 0th-3th generations airway between the two groups, of which p values were all lower than 0.01.
 |
Table 2 Comparison of QCT Measurements Between Low-Risk COPD Group and High-Risk COPD Group |
The Selection of Feature Candidates Based on LASSO Method
Figure 4 shows the process of feature selection. The optimal Lambda for the classifier based on QCT measurements and clinical information was determined as 0.009, and the MSE were smallest in Figure 4a, and the correlation coefficient of some features became 0 in Figure 4b. Ten QCT values were selected as shown in Table 3, which included %LAA−950-LLL, %LAA−950-RML, max LD-0th-generation, min LD-0th-generation, mean LD-1th-generation, min LD-1th-generation, %WA-2th-generation, max LD-2th-generation, min LD-3th-generation, and min LD-4th-generation, and the feature of %LAA−950-LLL showed the highest absolute value of weight (0.183), followed by min LD-0th-generation (−0.123), min LD 1th-generation (0.122) and max LD 0th-generation (0.098). In addition, three clinical information (sex, dyspnea, and persistent cough) were selected as well, with weights of 0.076, 0.106, and 0.096 respectively, and they all showed significant value to predict high-risk COPD patients.
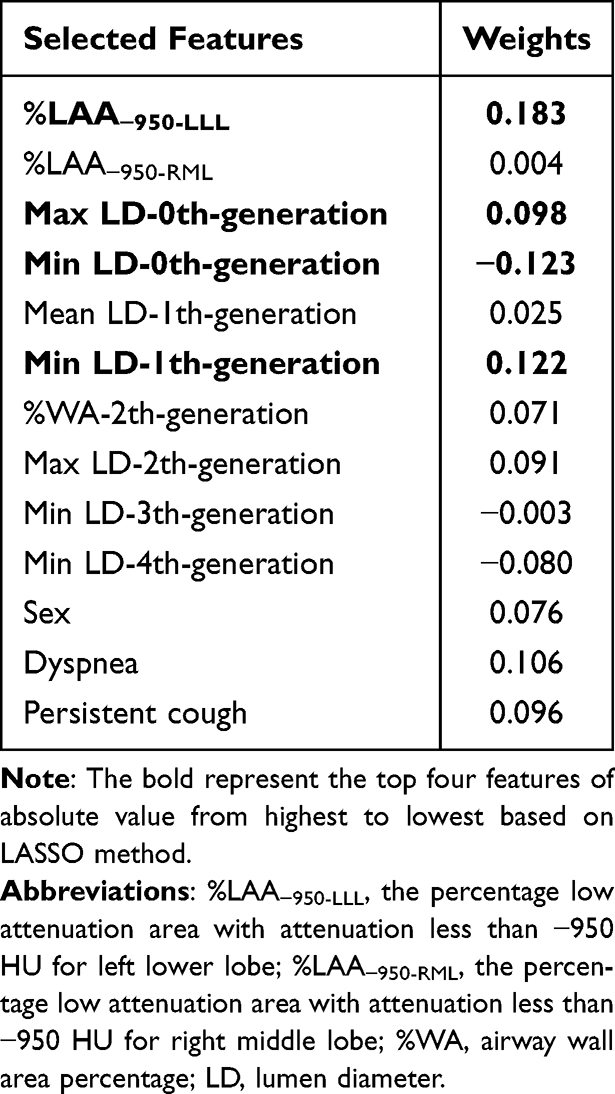 |
Table 3 The Weights of Selected Features Based on LASSO Method |
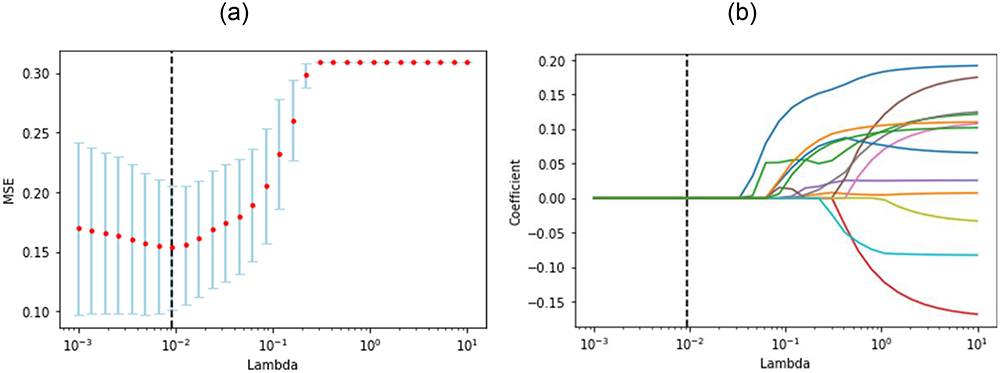 |
Figure 4 Screening candidate features for distinguishing between low-risk COPD and high-risk COPD by the LASSO algorithm. The MSE plot helps find the best λ, and the λ-coefficient plot shows how coefficients change with λ to select relevant features. This process aims to improve model performance and interpretability by choosing the right feature subset. (a) MSE values under different lambda. The lambda was determined as 0.009 according to the principle of the minimum of the MSE (0.016). (b) The curve of features selection was displayed and the feature with a correlation coefficient of 0 was eliminated. |
Performance of Prediction Model Between Study Groups
To fully verify the effectiveness of the SVM classifier, four classical kernel functions, ie Linear, RBF, Poly, and Sigmoid, were tested with QCT measurements. We then chose the kernel function with the best performance for building the classifier. Table 4 shows that the SVM classifier with linear kernel function obtained the best overall performance, with the highest ACC (85.71%), SEN (88.34%), SPE (84.00%), F1-score (83.33%), and AUC (0.93) in the testing dataset. Figure 5a shows the ROC curves corresponding to each kernel function, in which the classifier with linear kernel function also outperformed the others. Moreover, the QCT measurements were combined with clinical information to predict high-risk COPD using the SVM classifier with a linear kernel function shown in Table 4. When clinical information was taken into consideration, the performance of the prediction model was greatly improved, especially the value of SPE was increased by 8.00%, which was demonstrated by the increased AUC (0.96 vs 0.93 for QCT measurements combined with clinical information and QCT measurements only, respectively) as shown in Figure 5b.
 |
Table 4 The Evaluation Matrices for Low-Risk COPD and High-Risk COPD Classification Using Different Classifiers in the Testing Dataset |
 |
Figure 5 The ROC curves of the SVM model. (a) The comparison of ROC curves based on QCT measurements with different kernel function. The green line represents the model that uses the Linear kernel, the yellow line corresponds to the RBF kernel, the blue line represents the Sigmoid kernel, and the purple line is for the Poly kernel. (b) The comparison of ROC curves with linear kernel function using different feature sets. The red line shows the classification results using only QCT parameters, while the yellow line represents the combined classification results using QCT and clinical information. |
Key QCT Measurements Distribution Analysis
Based on the weight coefficients in Table 3, we selected the top four QCT measurements for violin graph analysis, which included %LAA−950-LLL (weight=0.183, p < 0.001), min LD-0th-generation (weight=−0.123, p=0.001), min LD-1th-generation (weight=0.122, p < 0.001) and max LD-0th-generation (weight=0.098, p < 0.001). Figure 6a shows that, in the low-risk COPD group, the value of %LAA−950-LLL was mainly distributed between 4 and 8, while in the high-risk group, the value was mainly distributed between 8 and 17 and the distribution of feature values was more uniform than that in the low-risk group. As shown in Figure 6b, the feature of min LD-0th-generation in the low-risk group mainly distributed around 13, while in the high-risk group mainly concentrated around 14. Concerning max LD-0th-generation shown in Figure 6c, the feature value distribution of 25% to 75% quantiles in the low-risk group lay between 14 and 16, while those in the high-risk group were distributed in the range of 16–20. Regarding min LD-1th-generation shown in Figure 6d, the median distribution of feature values in the low-risk group was 9, with 50% of the feature values lying between 8 and 10. Whereas the median distribution of feature values in the high-risk group was 11, with almost half of the data lying between 10 and 12.
 |
Figure 6 The violin plots of key QCT measurements. (a) The distribution of %LAA−950-LLL in Low-risk group and High-risk group; (b) the distribution of min LD-0th-generation in Low-risk group and High-risk group; (c) the distribution of max LD-0th-generation in Low-risk group and High-risk group; (d) the distribution of min LD-1th-generation in Low-risk group and High-risk group. |
Correlations Between Key QCT Measurements and PFTs
The correlations between %LAA−950-LLL (weight=0.183), min LD-0th-generation (weight=−0.123), min LD-1th-generation (weight=0.122), max LD-0th-generation (weight=0.098) and PFTs were explored, with the results shown in Table 5. For emphysema measurements, the %LAA−950-LLL showed significant correlations with the FEV1, FVC, and FEV1/FVC (R = - 0.627, R = - 0.390, R = - 0.789 respectively, P < 0.001). For airway measurements, the max LD-0th-generation showed a negative correlation with FEV1/FVC (R = −0.198, P < 0.050), whereas no correlations with FEV1 (R = −0.156, P = 0.068) and FVC (R = −0.164, P = 0.055) were identified. The min LD-1th-generation showed significant correlations with FEV1, FVC, and FEV1/FVC (P < 0.050), but there were no significant correlations between min LD-0th-generation and FEV1, FVC, FEV1/FVC with all p values greater than 0.05.
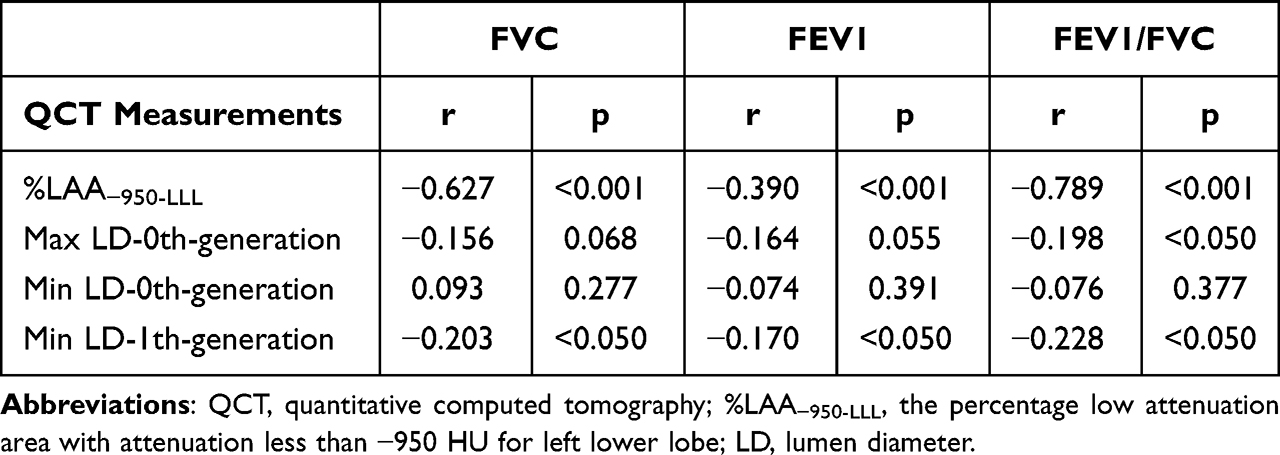 |
Table 5 Correlations Between QCT Measurements and PFTs |
Discussion
COPD is a major global health concern, leading to significant morbidity and mortality worldwide. Despite its high prevalence, a considerable number of individuals with COPD remain undiagnosed or are diagnosed at later stages of the disease, limiting the effectiveness of treatment and management strategies. Early identification of individuals at high risk for COPD is crucial for implementing preventive measures, facilitating early diagnosis, and providing timely and appropriate therapeutic interventions.
This is the first study to automatically identify the high-risk COPD participants based on QCT measurements, in which all participants in our study had no airflow obstruction (FEV1/FVC>70% post-bronchodilation), whereas precursor conditions were having respiratory symptoms (eg, cough and dyspnea) and structural lung lesions (eg, emphysema) and physiological abnormalities (including low-normal FEV1). According to the 2023 Global Initiative for Chronic Obstructive Lung Disease, those participants may be at risk of COPD over time.54
In this study, we explored the feasibility to identify high-risk COPD based on precursor conditions. A machine learning model was developed to enable early diagnosis of high-risk COPD by combining QCT measurements with clinical information. This model exhibited excellent performance, achieving high accuracy (90.48%), sensitivity (88.24%), specificity (92.00%), F1-score (88.24%), and area under the curve (AUC) value of 0.96, which showed potential for the prevention, early diagnosis, and timely and appropriate therapeutic intervention of the disease. The features selected for model building included 10 QCT features and 3 clinical information. In the study, these features were statistically analyzed, and the possible explanations of these features causing high-risk COPD were also given.
This research found that, for high-risk COPD with 80% < FEV1 < 95%, the emphysema measurement of %LAA−950-LLL was higher than low-risk COPD with FEV1%≥95% (Figure 6a). Meanwhile, %LAA−950-LLL was selected as one of the features to identify high-risk COPD by using the LASSO method (Table 3). This finding was consistent with a previous study, in which %LAA−950 was validated using histology and most commonly recommended for quantitative CT evaluation of emphysema.55,56 Furthermore, the value of %LAA−950 proved to be significantly associated with FEV1 and dyspnea, which can be used as measures of COPD disease severity.33 In addition, the severity of emphysema of COPD varies in different lung lobes. Our results also demonstrated that %LAA−950 in specific regions of the left lower lobe (LLL) was correlated with PFTs, which might provide useful biological markers for the differential diagnosis of high-risk COPD in pre-COPD stages.
This study also found that the airway structure of high-risk COPD was changed with increased LD and WT than low-risk COPD (Table 2). The airway measurements of max LD-0th-generation, min LD-0th-generation, and min LD-1th-generation were valuable than other measurements in our model (Table 3). Therefore, the 0th-1th generation airway may produce more luminal mucus, leading to increased LD in CT images. COPD has been shown to cause chronic inflammation in the airways that is manifested primarily as hypersecretion of mucus, stenosis of the smaller airways, and the establishment of pulmonary emphysema in the pathophysiology.57 Once mucous clearance is impaired, a large amount of waste accumulates on the airway wall and it leads to airway inflammation and infection. Mucus-producing glands are mainly distributed in large airways, and symptoms of cough and sputum were predominately associated with mucus production in the large airways.58 A previous study demonstrated that bronchoscopy-identified luminal mucus in large airways was associated with compromised lung function and worse health-related quality of life,59 this justified why our study focused on 0th-4th generation large airways rather than small ones. In addition, a cytological study explained that airway obstruction, increased wall thickness, or air trapping was significantly associated with increased fibrocytes in the bronchial tissue of COPD.60 Therefore, this suggests that histopathology including inflammation, fibrosis, narrowing, dilatation, and obliteration of bronchi may be the future directions to detect pre-COPD.
Furthermore, 3 clinical information sets (sex, dyspnea, and persistent cough) were selected as relevant features to identify high-risk COPD (Table 3), with which the classification results were improved (Table 4 and Figure 5b). As for the sex factor, the sex ratio was skewed towards males in high-risk COPD in our study, which is likely because males may be predominantly affected in terms of COPD susceptibility, prognosis, symptoms, exacerbation risk, severity, comorbidities (including lung, systemic, and psychiatric), hospitalization, and death.61 Alternative factors such as living areas, genetic background, air pollution, and their differential effects on women and men as well as hormonal influences should also be considered.62 Meanwhile, dyspnea was a subjective sensation, and everyone may perceive and express it differently, and thus there was a certain degree of subjectivity. At the same time, dyspnea can also be caused by various factors, including physical and psychological factors, which made the classification and diagnosis of dyspnea more complex. For COPD patients, the dyspnea mainly caused by chronic bronchitis and emphysema. Furthermore, factors such as mucus obstruction and alveolar expansion may also cause dyspnea. On the other hand, smoking is considered to be one of the major factors affecting airway remodeling before the development of apparent COPD, which can lead to structural changes in airways as well.31 However, the participants of high-risk COPD had little smoking in our study, and therefore non-smoking-related risk factors including air pollution, occupational exposures, environmental tobacco smoke, infectious diseases, and low socioeconomic status may be the dominant factors for increasing the risk of COPD.63,64
While our study has yielded interesting findings, we acknowledge that a few potential limitations may affect the broader applicability of our findings. Firstly, this study was conducted at a single center using the limited number of patients, which may limit the generalization and applicability to other populations or locations. Further multi-center studies with more participants enrolled are needed to confirm the results of this study. Secondly, our research primarily utilized LAA−950 and certain airway CT quantitative features to assess the status of COPD patients. However, other studies, such as the research conducted by Moslemi et al, emphasized the importance of additional features for evaluating the severity of COPD patients, including Low Attenuation Cluster (LAC) and Total Airway Count (TAC).65 We plan to further explore the potential value of LAC and TAC features contributed to develop high-risk COPD. Thirdly, our study focused exclusively on inspiratory CT images, which has some advantages including reduced respiratory movement artifacts and acquisition time, suitable for physical examination scenarios comparing with inspiratory and expiratory CT. While the additional features were ignored for evaluating the severity of COPD patients including airway trapping of LAA−856 by expiratory CT and Jacobian feature by respiratory-expiratory CT registration. A previous study demonstrated that small airway dysfunction occurred in patients with all stages of COPD, even in high-risk smoking groups who have not yet met the diagnostic criteria for COPD.66 However, small airways cannot be visualized by CT due to the limited resolution based on inspiratory CT. In future work, we intend to explore the potential contributions of these additional features to provide a more comprehensive assessment of early COPD patient based on biphasic CT.
Conclusion
In this study, we explored the feasibility to detect high-risk COPD at an early stage by combining QCT measurements and clinical information. Our combined model showed good performance in the early diagnosis of high-risk COPD. In addition, our results demonstrated that the emphysema and airway anatomy indexes were significantly correlated with pulmonary function status, indicating the potential of these indexes in detecting early high-risk COPD. Furthermore, future studies may be conducted to explore other potential factors contributing to COPD, such as genetic and environmental factors, while considering larger and multi-center investigations to validate our findings. We believe that this study offers a feasible approach to detect early COPD using inspiratory HRCT only, therefore decreasing rates of sickness, in turn reducing health care costs.
Ethics Approval and Informed Consent
The studies involving human participants were reviewed and approved by the Ethical Committee of Second Affiliated Hospital of Shenyang Medical College. This study was conducted in accordance with the Declaration of Helsinki and all participants provided informed consent before enrollment.
Acknowledgments
We would like to thank all the participants and all the research team members in this study.
Author Contributions
All authors made substantial contributions to the conception and design, acquisition of data, or analysis and interpretation of data; took part in drafting the article or revising it critically for important intellectual content; agreed to submit to the current journal; gave final approval of the version to be published; and agree to be accountable for all aspects of the work.
Disclosure
All authors report no conflicts of interest in this work.
References
1. Tanabe N, Sakamoto R, Kozawa S, et al. Deep learning-based reconstruction of chest ultra-high-resolution computed tomography and quantitative evaluations of smaller airways. Respir Investig. 2022;60(1):167–170. doi:10.1016/j.resinv.2021.10.004
2. Park JE, Zhang L, Ho YF, et al. Modeling the Health and Economic Burden of Chronic Obstructive Pulmonary Disease in China From 2020 to 2039: a Simulation Study. Value Health Reg Issues. 2022;32:8–16. doi:10.1016/j.vhri.2022.06.002
3. Chen H, Liu X, Gao X, et al. Epidemiological evidence relating risk factors to chronic obstructive pulmonary disease in China: a systematic review and meta-analysis. PLoS One. 2021;16(12):e0261692. doi:10.1371/journal.pone.0261692
4. Shi G, Chen C. Home-based versus outpatient pulmonary rehabilitation program for patients with chronic obstructive pulmonary disease: a protocol for systematic review and meta-analysis. Medicine (Baltimore). 2021;100(21):e26099. doi:10.1097/MD.0000000000026099
5. Du M, Hu H, Zhang L, et al. China county based COPD screening and cost-effectiveness analysis. Ann Palliat Med. 2021;10(4):4652–4660. doi:10.21037/apm-21-812
6. Duffy SP, Criner GJ. Chronic Obstructive Pulmonary Disease: evaluation and Management. Med Clin North Am. 2019;103(3):453–461. doi:10.1016/j.mcna.2018.12.005
7. Gove K, Wilkinson T, Jack S, Ostridge K, Thompson B, Conway J. Systematic review of evidence for relationships between physiological and CT indices of small airways and clinical outcomes in COPD. Respir Med. 2018;139:117–125. doi:10.1016/j.rmed.2018.05.005
8. Hoffman EA, Lynch DA, Barr RG, van Beek EJ, Parraga G. IWPFI Investigators. Pulmonary CT and MRI phenotypes that help explain chronic pulmonary obstruction disease pathophysiology and outcomes. J Magn Reson Imaging. 2016;43(3):544–557. doi:10.1002/jmri.25010
9. Zhu D, Qiao C, Dai H, et al. Diagnostic efficacy of visual subtypes and low attenuation area based on HRCT in the diagnosis of COPD. BMC Pulm Med. 2022;22(1):81. doi:10.1186/s12890-022-01875-6
10. Obojski A, Patyk M, Zaleska-Dorobisz U. Similarities in Quantitative Computed Tomography Imaging of the Lung in Severe Asthma with Persistent Airflow Limitation and Chronic Obstructive Pulmonary Disease. J Clin Med. 2021;10(21):5058. doi:10.3390/jcm10215058
11. Xie M, Wang W, Dou S, et al. Quantitative computed tomography measurements of emphysema for diagnosing asthma-chronic obstructive pulmonary disease overlap syndrome. Int J Chron Obstruct Pulmon Dis. 2016;11:953–961. doi:10.2147/COPD.S104484
12. Dou S, Zheng C, Cui L, et al. High prevalence of bronchiectasis in emphysema-predominant COPD patients. Int J Chron Obstruct Pulmon Dis. 2018;13:2041–2047. doi:10.2147/COPD.S163243
13. Koo HJ, Lee SM, Seo JB, et al. Prediction of Pulmonary Function in Patients with Chronic Obstructive Pulmonary Disease: correlation with Quantitative CT Parameters. Korean J Radiol. 2019;20(4):683–692. doi:10.3348/kjr.2018.0391
14. Tho NV, Ryujin Y, Ogawa E, et al. Relative contributions of emphysema and airway remodelling to airflow limitation in COPD: consistent results from two cohorts. Respirology. 2015;20(4):594–601. doi:10.1111/resp.12505
15. Fernandes L, Fernandes Y, Mesquita AM. Quantitative computed tomography imaging in chronic obstructive pulmonary disease. Lung India. 2016;33(6):646–652. doi:10.4103/0970-2113.192880
16. Amaza IP, O’Shea AMJ, Fortis S, Comellas AP. Discordant Quantitative and Visual CT Assessments in the Diagnosis of Emphysema. Int J Chron Obstruct Pulmon Dis. 2021;16:1231–1242. doi:10.2147/COPD.S284477
17. Hartley RA, Barker BL, Newby C, et al. Relationship between lung function and quantitative computed tomographic parameters of airway remodeling, air trapping, and emphysema in patients with asthma and chronic obstructive pulmonary disease: a single-center study. J Allergy Clin Immunol. 2016;137(5):1413–1422.e12. doi:10.1016/j.jaci.2016.02.001
18. Lv R, Xie M, Jin H, et al. A Preliminary Study on the Relationship Between High-Resolution Computed Tomography and Pulmonary Function in People at Risk of Developing Chronic Obstructive Pulmonary Disease. Front Med Lausanne. 2022;9:855640. doi:10.3389/fmed.2022.855640
19. Wang Y, Chai L, Chen Y, et al. Quantitative CT parameters correlate with lung function in chronic obstructive pulmonary disease: a systematic review and meta-analysis. Front Surg. 2023;9:1066031. doi:10.3389/fsurg.2022.1066031
20. Ostridge K, Williams NP, Kim V, et al. Relationship of CT-quantified emphysema, small airways disease and bronchial wall dimensions with physiological, inflammatory and infective measures in COPD. Respir Res. 2018;19(1):31. doi:10.1186/s12931-018-0734-y
21. Müller NL, Staples CA, Miller RR, Abboud RT. “Density mask”. An objective method to quantitate emphysema using computed tomography. Chest. 1988;94(4):782–787. doi:10.1378/chest.94.4.782
22. Gevenois PA, de Maertelaer V, De Vuyst P, Zanen J, Yernault JC. Comparison of computed density and macroscopic morphometry in pulmonary emphysema. Am J Respir Crit Care Med. 1995;152(2):653–657. doi:10.1164/ajrccm.152.2.7633722
23. Gevenois PA, De Vuyst P, de Maertelaer V, et al. Comparison of computed density and microscopic morphometry in pulmonary emphysema. Am J Respir Crit Care Med. 1996;154(1):187–192. doi:10.1164/ajrccm.154.1.8680679
24. Okajima Y, Come CE, Nardelli P, et al. Luminal Plugging on Chest CT Scan: association With Lung Function, Quality of Life, and COPD Clinical Phenotypes. Chest. 2020;158(1):121–130. doi:10.1016/j.chest.2019.12.046
25. Wang M, Aaron CP, Madrigano J, et al. Association Between Long-term Exposure to Ambient Air Pollution and Change in Quantitatively Assessed Emphysema and Lung Function. JAMA. 2019;322(6):546–556. doi:10.1001/jama.2019.10255
26. Aslan E, Kaya F, Özgül E, Balcı A, Demirel E, Günay E. Quantitative computed tomography analysis of emphysema severity and distribution in chronic obstructive lung disease, correlation with clinical findings. Kronik obstrüktif akciğer hastalığında bilgisayarlı tomografide amfizem miktarı ve dağılımının kantitatif yöntemlerle değerlendirilmesi ve klinik bulguları ile korelasyonu. Tuberk Toraks. 2021;69(3):338–348. doi:10.5578/tt.20219706
27. Uthoff JM, Mott SL, Larson J, et al. Computed Tomography Features of Lung Structure Have Utility for Differentiating Malignant and Benign Pulmonary Nodules. Chronic Obstr Pulm Dis. 2022;9(2):154–164. doi:10.15326/jcopdf.2021.0271
28. Nambu A, Zach J, Schroeder J, et al. Quantitative computed tomography measurements to evaluate airway disease in chronic obstructive pulmonary disease: relationship to physiological measurements, clinical index and visual assessment of airway disease. Eur J Radiol. 2016;85(11):2144–2151. doi:10.1016/j.ejrad.2016.09.010
29. Dudurych I, Muiser S, McVeigh N, et al. Bronchial wall parameters on CT in healthy never-smoking, smoking, COPD, and asthma populations: a systematic review and meta-analysis. Eur Radiol. 2022;32(8):5308–5318. doi:10.1007/s00330-022-08600-1
30. Chae KJ, Jin GY, Choi J, et al. Generation-based study of airway remodeling in smokers with normal-looking CT with normalization to control inter-subject variability. Eur J Radiol. 2021;138:109657. doi:10.1016/j.ejrad.2021.109657
31. Patyk M, Obojski A, Sokołowska-Dąbek D, Parkitna-Patyk M, Zaleska-Dorobisz U. Airway wall thickness and airflow limitations in asthma assessed in quantitative computed tomography. Ther Adv Respir Dis. 2020;14:1753466619898598. doi:10.1177/1753466619898598
32. Kumar I, Verma A, Jain A, Agarwal SK. Performance of quantitative CT parameters in assessment of disease severity in COPD: a prospective study. Indian J Radiol Imaging. 2018;28(1):99–106. doi:10.4103/ijri.IJRI_296_17
33. Castillo-Saldana D, Hague CJ, Coxson HO, Ryerson CJ. Using Quantitative Computed Tomographic Imaging to Understand Chronic Obstructive Pulmonary Disease and Fibrotic Interstitial Lung Disease: state of the Art and Future Directions. J Thorac Imaging. 2020;35(4):246–254. doi:10.1097/RTI.0000000000000440
34. Choi S, Haghighi B, Choi J, et al. Differentiation of quantitative CT imaging phenotypes in asthma versus COPD. BMJ Open Respir Res. 2017;4(1):e000252. doi:10.1136/bmjresp-2017-000252
35. Yang W, Li F, Li C, Meng J, Wang Y. Focus on Early COPD: definition and Early Lung Development. Int J Chron Obstruct Pulmon Dis. 2021;16:3217–3228. doi:10.2147/COPD.S338359
36. Xu Y, Liang T, Ma Y, et al. Strain Analysis in Patients at High-Risk for COPD Using Four-Dimensional Dynamic-Ventilation CT. Int J Chron Obstruct Pulmon Dis. 2022;17:1121–1130. doi:10.2147/COPD.S360770
37. Agustí A, Celli BR, Criner GJ, et al. Global Initiative for Chronic Obstructive Lung Disease 2023 Report: GOLD Executive Summary. Eur Respir J. 2023;61(4):2300239. doi:10.1183/13993003.00239-2023
38. Regan EA, Lynch DA, Curran-Everett D, et al. Clinical and Radiologic Disease in Smokers With Normal Spirometry. JAMA Intern Med. 2015;175(9):1539–1549. doi:10.1001/jamainternmed.2015.2735
39. Yang Y, Ge H, Lu J, et al. Structural features on quantitative chest computed tomography of patients with maximal mid-expiratory flow impairment in a normal lung function population. BMC Pulm Med. 2023;23(1):86. doi:10.1186/s12890-023-02380-0
40. Chen S, Wang C, Li B, et al. Risk factors for FEV1 decline in mild COPD and high-risk populations. Int J Chron Obstruct Pulmon Dis. 2017;12:435–442. doi:10.2147/COPD.S118106
41. American Thoracic Society (ATS). Surveillance for respiratory hazards in the occupational setting. Am Rev Respir Dis. 1982;126(5):952–956.
42. Nambu A, Zach J, Schroeder J, et al. Relationships between diffusing capacity for carbon monoxide (DLCO), and quantitative computed tomography measurements and visual assessment for chronic obstructive pulmonary disease. Eur J Radiol. 2015;84(5):980–985. doi:10.1016/j.ejrad.2015.01.010
43. Weber J, Reeves AP, Doucette JT, et al. Quantitative CT Evidence of Airway Inflammation in WTC Workers and Volunteers with Low FVC Spirometric Pattern. Lung. 2020;198(3):555–563. doi:10.1007/s00408-020-00350-5
44. Song L, Leppig JA, Hubner RH, et al. Quantitative CT Analysis in Patients with Pulmonary Emphysema: do Calculated Differences Between Full Inspiration and Expiration Correlate with Lung Function? Int J Chron Obstruct Pulmon Dis. 2020;15:1877–1886. doi:10.2147/COPD.S253602
45. Kim V, Desai P, Newell JD, et al. Airway wall thickness is increased in COPD patients with bronchodilator responsiveness. Respir Res. 2014;15(1):84. doi:10.1186/s12931-014-0084-3
46. Washko GR, Diaz AA, Kim V, et al. Computed tomographic measures of airway morphology in smokers and never-smoking normals. J Appl Physiol. 2014;116(6):668–673. doi:10.1152/japplphysiol.00004.2013
47. Bhatt SP, Bodduluri S, Kizhakke Puliyakote AS, et al. Structural airway imaging metrics are differentially associated with persistent chronic bronchitis. Thorax. 2021;76(4):343–349. doi:10.1136/thoraxjnl-2020-215853
48. Konietzke P, Wielpütz MO, Wagner WL, et al. Quantitative CT detects progression in COPD patients with severe emphysema in a 3-month interval. Eur Radiol. 2020;30(5):2502–2512. doi:10.1007/s00330-019-06577-y
49. Diaz AA, Hardin ME, Come CE, et al. Childhood-onset asthma in smokers. association between CT measures of airway size, lung function, and chronic airflow obstruction. Ann Am Thorac Soc. 2014;11(9):1371–1378. doi:10.1513/AnnalsATS.201403-095OC
50. Zhang Y, Xia R, Lv M, et al. Machine-Learning Algorithm-Based Prediction of Diagnostic Gene Biomarkers Related to Immune Infiltration in Patients With Chronic Obstructive Pulmonary Disease. Front Immunol. 2022;13:740513. doi:10.3389/fimmu.2022.740513
51. Mekov E, Miravitlles M, Petkov R. Artificial intelligence and machine learning in respiratory medicine. Expert Rev Respir Med. 2020;14(6):559–564. doi:10.1080/17476348.2020.1743181
52. Hussain A, Choi HE, Kim HJ, Aich S, Saqlain M, Kim HC. Forecast the Exacerbation in Patients of Chronic Obstructive Pulmonary Disease with Clinical Indicators Using Machine Learning Techniques. Diagnostics (Basel). 2021;11(5):829. doi:10.3390/diagnostics11050829
53. Li Z, Liu L, Zhang Z, et al. A Novel CT-Based Radiomics Features Analysis for Identification and Severity Staging of COPD. Acad Radiol. 2022;29(5):663–673. doi:10.1016/j.acra.2022.01.004
54. Global Initiative for Chronic Obstructive Lung Disease. Global strategy for the diagnosis, management, and prevention of chronic obstructive pulmonary disease, 2023. Available from: www.goldcopd.org.
55. Madani A, Zanen J, de Maertelaer V, Gevenois PA. Pulmonary emphysema: objective quantification at multi-detector row CT--comparison with macroscopic and microscopic morphometry. Radiology. 2006;238(3):1036–1043. doi:10.1148/radiol.2382042196
56. Nambu A, Zach J, Kim SS, et al. Significance of Low-Attenuation Cluster Analysis on Quantitative CT in the Evaluation of Chronic Obstructive Pulmonary Disease. Korean J Radiol. 2018;19(1):139–146. doi:10.3348/kjr.2018.19.1.139
57. Angelis N, Porpodis K, Zarogoulidis P, et al. Airway inflammation in chronic obstructive pulmonary disease. J Thorac Dis. 2014;6 Suppl 1(Suppl 1):S167–S172. doi:10.3978/j.issn.2072-1439.2014.03.07
58. Fahy JV, Dickey BF. Airway mucus function and dysfunction. N Engl J Med. 2010;363(23):2233–2247. doi:10.1056/NEJMra0910061
59. Yang C, Zeng HH, Du YJ, Huang J, Zhang QY, Lin K. Correlation of Luminal Mucus Score in Large Airways with Lung Function and Quality of Life in Severe Acute Exacerbation of COPD: a Cross-Sectional Study. Int J Chron Obstruct Pulmon Dis. 2021;16:1449–1459. doi:10.2147/COPD.S311659
60. Dupin I, Thumerel M, Maurat E, et al. Fibrocyte accumulation in the airway walls of COPD patients. Eur Respir J. 2019;54(3):1802173. doi:10.1183/13993003.02173-2018
61. DeMeo DL. Sex and Gender Omic Biomarkers in Men and Women With COPD: considerations for Precision Medicine. Chest. 2021;160(1):104–113. doi:10.1016/j.chest.2021.03.024
62. Ntritsos G, Franek J, Belbasis L, et al. Gender-specific estimates of COPD prevalence: a systematic review and meta-analysis. Int J Chron Obstruct Pulmon Dis. 2018;13:1507–1514. doi:10.2147/COPD.S146390
63. Yang IA, Jenkins CR, Salvi SS. Chronic obstructive pulmonary disease in never-smokers: risk factors, pathogenesis, and implications for prevention and treatment. Lancet Respir Med. 2022;10(5):497–511. doi:10.1016/S2213-2600(21)00506-3
64. Vila M, Faner R, Agustí A. Beyond the COPD-tobacco binomium: new opportunities for the prevention and early treatment of the disease. Más alla del binomio EPOC-tabaco: nuevas oportunidades para la prevención y tratamiento precoz de la enfermedad. Med Clin. 2022;159(1):33–39. doi:10.1016/j.medcli.2022.01.021
65. Moslemi A, Makimoto K, Tan WC, et al. Quantitative CT lung imaging and machine learning improves prediction of emergency room visits and hospitalizations in COPD. Acad. Radiol. 2023;30(4):707–716. doi:10.1016/j.acra.2022.05.009
66. Crisafulli E, Pisi R, Aiello M, et al. Prevalence of Small-Airway Dysfunction among COPD Patients with Different GOLD Stages and Its Role in the Impact of Disease. Respiration. 2017;93(1):32–41. doi:10.1159/000452479
 © 2023 The Author(s). This work is published and licensed by Dove Medical Press Limited. The
full terms of this license are available at https://www.dovepress.com/terms
and incorporate the Creative Commons Attribution
- Non Commercial (unported, 3.0) License.
By accessing the work you hereby accept the Terms. Non-commercial uses of the work are permitted
without any further permission from Dove Medical Press Limited, provided the work is properly
attributed. For permission for commercial use of this work, please see paragraphs 4.2 and 5 of our Terms.
© 2023 The Author(s). This work is published and licensed by Dove Medical Press Limited. The
full terms of this license are available at https://www.dovepress.com/terms
and incorporate the Creative Commons Attribution
- Non Commercial (unported, 3.0) License.
By accessing the work you hereby accept the Terms. Non-commercial uses of the work are permitted
without any further permission from Dove Medical Press Limited, provided the work is properly
attributed. For permission for commercial use of this work, please see paragraphs 4.2 and 5 of our Terms.
Recommended articles
From COPD to Lung Cancer: Mechanisms Linking, Diagnosis, Treatment, and Prognosis

Qi C, Sun SW, Xiong XZ
International Journal of Chronic Obstructive Pulmonary Disease 2022, 17:2603-2621
Published Date: 17 October 2022