Back to Journals » Pharmacogenomics and Personalized Medicine » Volume 14
DZIP1 Expression as a Prognostic Marker in Gastric Cancer: A Bioinformatics-Based Analysis
Authors Liu YJ ![]() , Li JP
, Li JP ![]() , Zeng SH, Han M
, Zeng SH, Han M ![]() , Liu SL, Zou X
, Liu SL, Zou X
Received 22 June 2021
Accepted for publication 30 August 2021
Published 16 September 2021 Volume 2021:14 Pages 1151—1168
DOI https://doi.org/10.2147/PGPM.S325701
Checked for plagiarism Yes
Review by Single anonymous peer review
Peer reviewer comments 2
Editor who approved publication: Dr Martin H Bluth
Yuan-Jie Liu,1,2,* Jie-Pin Li,1– 3,* Shu-Hong Zeng,1,2 Mei Han,1 Shen-Lin Liu,1,2 Xi Zou1
1Department of Oncology, Affiliated Hospital of Nanjing University of Chinese Medicine, Jiangsu Province Hospital of Chinese Medicine, Nanjing, Jiangsu, 210029, People’s Republic of China; 2Department of No. 1 Clinical Medical College, Nanjing University of Chinese Medicine, Nanjing, Jiangsu, 210023, People’s Republic of China; 3Department of Oncology, Zhangjiagang TCM Hospital Affiliated to Nanjing University of Chinese Medicine, Zhangjiagang, Jiangsu, 215600, People’s Republic of China
*These authors contributed equally to this work
Correspondence: Xi Zou; Shen-lin Liu Email [email protected]; [email protected]
Purpose: Gastric cancer (GC) is a common type of cancer worldwide. It can relapse and metastasize even after standard treatment; therefore, it has a poor prognosis. Moreover, sensitive biomarkers for prognosis prediction in GC are lacking. In this study, using a bioinformatics approach, we aimed to examine the value of DAZ Interacting Protein 1 (DZIP1) as a prognostic predictor and therapeutic target in GC.
Methods: We explored the clinical relevance, function, and molecular role of DZIP1 in GC using MethSurv, cBioPortal, TIMER, Gene Expression Profiling Interactive Analysis, IMEx, ONCOMINE, MEXPRESS, and EWAS Atlas databases. The GSE118919 dataset was used to plot receiver operating characteristic curves. Using The Cancer Genome Atlas, we developed a Cox regression model and assessed the clinical significance of DZIPs. In addition, we used the “xCELL” algorithm to make reliable immune infiltration estimations. Western blot and immunohistochemistry were used to examine protein expression. The results were visualized with the ‘ggplot2ʹ and “circlize” packages.
Results: In GC patients, DZIP1 was over-expressed at both the mRNA and protein levels. High levels of DZIP1 were found to be associated with poor survival in patients with GC. Our results indicated that DZIP1 could be involved in multiple cancer-related pathways such as the PI3K-Akt signaling pathway, WNT signaling pathway, and RAS signaling pathway, and its expression was correlated with the infiltration of activated myeloid dendritic cells, naive CD4+ T cells, and naive CD8+ T cells. Furthermore, we found that mutations in DZIP1 were correlated with a good prognosis in GC patients. Finally, we demonstrated a correlation between hypomethylation of the DZIP1 gene promoter and a poor prognosis in GC.
Conclusion: This study is the first to demonstrate a significant correlation between high levels of DZIP1 and a poor prognosis in GC patients. Our results clarify multiple potential mechanisms that could contribute to this correlation and may thus provide novel insights into the clinical diagnosis and treatment of GC.
Keywords: gastric cancer, expression, DZIP, methylation, mutation, epithelial–mesenchymal transition, immune infiltration
Graphical Abstract:

Introduction
Gastric cancer (GC) is a common malignancy worldwide and it is associated with a high mortality.1 In 2020, there were 9.96 million cancer-related deaths worldwide, including 770,000 cases of GC, making it the fourth largest contributor to cancer-related death. Owing to population aging, it is expected that by 2040, the global cancer burden will be 50% higher than that in 2020.2–4 Despite great progress in surgery, radiotherapy, and chemotherapy for GC, the 5-year overall survival (OS) rate in cases of advanced GC remains lower than 30% owing to a lack of sensitive and specific biomarkers. Therefore, the identification of new sensitive biomarkers is critical for prognostication and individualized treatment in GC.
In 2004, Moore identified and characterized DAZ Interacting Protein (DZIP) genes as protein-coding genes that encode at least three different protein isoforms containing a C2H2 zinc-finger domain.5 Sequence analysis of the human DZIP gene indicated that it is novel. DZIP1 and DZIP-like (DZIP2) were originally identified for their role in the Hedgehog signaling pathway and later for their role in ciliogenesis.6,7 It was also found that the DZIP1 protein is a component of different ribonucleoprotein particles involved in translating polysomes and RNA granules in HeLa cells6 and that DZIP1-associated mRNAs constitute genetic networks that regulate the cell cycle and gene expression.8 According to the current literature, DZIP3 drives tumor progression mainly by regulating the cell cycle, and its precise mechanism of action — especially in cell reprogramming and the maintenance of stem cell and cancer cell pluripotency — remains elusive.9,10
Therefore, in order to guide subsequent experimental validation and targeted drug development, we explored the potential biological functions of DZIP1 and its prognostic value in GC by comprehensively analyzing DZIP expression in GC patients using bioinformatics analysis.
Materials and Methods
Cell Culture
We obtained AGS (moderately differentiated GC cells), HGC-27 (undifferentiated GC cells), and GES-1 (healthy human gastric epithelial cells) from the Chinese Academy of Sciences (Shanghai, China) and MKN-74 (well-differentiated GC cells) and MKN-45 (poorly differentiated GC cells) from the Japanese Collection of Research Bioresources Cell Bank. GC cells were cultured in RPMI-1640 medium (Gibco, USA. Lot: 8121248) containing 10% fetal bovine serum (FBS) (Gibco, USA, Lot: 42F1376K) and GES-1 cells were cultured in DMEM (Gibco, USA, Lot: 8121032) containing 10% FBS. All cells were incubated at 37°C in air containing 5% CO2.
Expression Analysis
The transcriptome level analysis of DZIPs was conducted using public databases. The ONCOMINE (www.oncomine.org) and TIMER (http://timer.cistrome.org) databases were first used to assess the transcriptomic expression of DZIPs in tumors versus normal tissue.11,12 We obtained the GSE118916,13 GSE13861,14 and GSE29297215 datasets from the Gene Expression Omnibus (GEO) database and examined the differences in DZIP expression between tumors and normal tissue.
The protein level analysis of DZIPs was performed using cell lines and clinical specimens. Western blot was performed as described in a recent study.16 Target/β-actin bands were identified with a gel image processing system (ChemiDoc XRS+). Subsequently, relative protein levels were calculated. The experimental details are provided in Supplementary Material 1.
Cancerous and paracancerous tissues from 15 patients with GC were acquired from the Jiangsu Province Hospital of Chinese Medicine. All participants provided written informed consent. None of the patients had undergone any treatment, including chemotherapy, radiotherapy, and biological agent-based antitumor treatment, prior to surgery. Staging and grading for each tumor were performed based on the TNM system proposed by the American Joint Committee on Cancer (AJCC).17 The study protocol was approved by the ethics committee of the Jiangsu Province Hospital of Chinese Medicine, and clinicians and patients provided informed consent for the use of the tissue for research (2019NL-166-02). This study conformed to the principles outlined in the Declaration of Helsinki (World Medical Association Declaration of Helsinki). The protocol for immunohistochemistry (IHC) was the same as that used previously.18 The experimental details are provided in Supplementary Material 1. Images were obtained using a NIKON Eclipse Ni-E microscope (NIKON, Japan) (original magnification, ×400). The H-SCORE (range 0–300, higher scores indicating stronger positive staining) was calculated as described previously.19
All experimental data are reported as means ± SD, and all experiments were conducted at least thrice. Between-group comparisons were performed using a t-test, and comparisons across multiple groups were performed using one-way analysis of variance (ANOVA). All experimental data analyses were performed using SPSS 26.0 (SPSS Inc., USA) and results were illustrated using GraphPad Prism 8.0 (GraphPad Software, Inc., USA). **P<0.01 and *P < 0.05 were considered statistically significant.
Survival Curve Analysis
We analyzed OS and disease-free survival (DFS) in GC based on DZIP gene expression using The Cancer Genome Atlas-Stomach Adenocarcinoma (TCGA-STAD) data and Gene Expression Profiling Interactive Analysis (GEPIA).20 Using “median” as the group cut-off, we constructed Kaplan–Meier curves. We used the GSE14210, GSE15459, GSE22377, GSE29272, GSE51105, and GSE62254 datasets to pool GC cases and then used the Kaplan–Meier plotter to perform OS and post-progression survival (PPS) analyses.21 The best cutoff was selected automatically, and the Log rank test was performed.
Cox Model Establishment and the Analysis of Clinical Value
Raw RNA sequencing data and corresponding data on DZIP expression and clinical characteristics were obtained from TCGA (https://portal.gdc.cancer.gov/) in January 2020.22 We performed univariate and multivariate Cox regression analysis to identify which DZIPs were independent predictors of prognosis. Forest plots constructed using the “forestplot” R package were used to obtain P-values, hazard ratios (HRs), and 95% confidence intervals (CIs) for each variable.
On the UALCAN analysis page,23 the TCGA dataset was set to stomach adenocarcinoma for DZIP expression analysis. We analyzed DZIP expression based on T/N/M stage, AJCC stage, age, and sex. P < 0.05 indicated statistically significant findings.
Subsequently, differences in survival between patients with high vs low DZIP1 expression were evaluated using Kaplan–Meier survival curve analysis. Time-dependent receiver operating characteristic (ROC) curve analysis was used to compare the predictive accuracy of DZIP1 expression levels. P-values, HRs, and 95% CIs for the survival curves were obtained using Log rank tests and univariate Cox proportional hazards regression.
Genetic Mutation Analysis
The cBioPortal database was used to identify the frequency, types, and locations of DZIP mutations, as well as their clinical significance.24 In addition, the mutation module of the TIMER database was used to determine whether the DZIP mutations would impact the expression levels of the corresponding genes. Log rank tests and one-way ANOVA were performed for all genetic mutation analyses.
Functional Enrichment Analysis
We identified the genes interacting with DZIP1 using the IMEx database and built a protein–protein interaction network (PPI) using the NetworkAnalyst tool.25,26 Then, we imported DZIP1 and its co-expressed genes into the Enrichr database.27 We performed gene set enrichment analysis (GSEA) using Broad Institute GSEA software 3.0.28 We obtained the geneset “subset of GO” from the Molecular Signatures Databases (http://www.gsea-msigdb.org/gsea/msigdb/index.jsp) and performed gene ontology (GO) analysis. A normal P-value < 0.05 was used as an indicator of statistical significance. The correlation between DZIP1 expression and that of six epithelial–mesenchymal transition (EMT)-related genes was examined using TIMER data and the “circlize” package.
Immune Cell Infiltration Analysis
To make reliable immune infiltration estimations, we utilized xCELL, an R package that can be used to evaluate 64 cell types. All the results from the above analyses were processed using the ‘ggplot2ʹ and “pheatmap” packages. Based on median DZIP1 levels, GC patients were categorized into the following groups: Patients with high DZIP1 expression and patients with low DZIP1 expression. Subsequently, differential analysis was used to identify the immune cells showing differential abundance between the two groups. Using the same method, we also examined whether DZIP1 mutations (wild-type DZIP1 gene vs mutant DZIP1 gene) affect the infiltration of multiple types of immune cells into tumors.
DNA Methylation Analysis
DZIP1 methylation was analyzed using MEXPRESS data corresponding to TCGA-STAD cohorts.29 Pearson correlation analyses were used to assess the association between DNA methylation and DZIP1 expression. Correlation coefficients (R) and Benjamini–Hochberg-adjusted P-values for different methylation sites were obtained. The MethSurv tool was used to visualize DZIP1 methylation and the Kaplan–Meier-based correlation between DZIP1 hyper/hypomethylation and OS.30
We further analyzed the relationship between DZIP1 promoter methylation and DZIP1 expression using TCGA-STAD data and plotted survival curves (OS, progression-free interval, and disease-free interval). In addition, enrichment analyses for the different DZIP1 methylation probes were conducted using the EWAS Atlas.31
Results
Expression Levels of DZIPs in GC
The study flow is shown in Figure 1. As indicated in Figure 2A, we first compared the expression levels of DZIPs in 20 types of cancers with those in healthy tissues using the ONCOMINE web resource. Furthermore, we assessed the expression levels of DZIPs in diverse types of tumors using the TCGA-STAD. As shown in Figure 2B, DZIP1L and DZIP3 were highly expressed in GC. The mRNA expression levels of DZIP1 showed no significant difference between normal and GC tissues.
 |
Figure 1 Process flow of the study. |
 |
Figure 2 Expression levels of DZIPs in gastric cancer (GC) based on The Cancer Genome Atlas (TCGA)-STAD data. (A and B) Differences in DZIP expression between different types of human cancers. (C–E) mRNA levels of DZIPs in GC, examined using public datasets from Gene Expression Omnibus (GSE118916, GSE13861, and GSE292972). (F) Differential expression of DZIPs in normal gastric epithelial cells and GC cells. (G) Protein expression of DZIPs, examined using immunohistochemistry, in 15 pairs of GC tissue and adjacent normal tissue. *P < 0.05, **P < 0.01, ***P < 0.001. Abbreviation: NS, no significance. |
As shown in Figure 2C–E, GSE118916 and GSE29272 data indicated that DZIP1 expression was significantly higher in GC than in adjacent tissues. According to GSE13861, DZIP1L expression was significantly different between GC and adjacent tissues. Finally, GSE13861 and GSE29272 demonstrated that DZIP3 was more highly expressed in adjacent tissues than in GC.
DZIP expression was then examined in healthy gastric epithelial cells and GC cells at different degrees of differentiation using Western blot. The expression of DZIPs in HGC-27, AGS, and MKN-45 cells was remarkably different from that in GES-1 cells (Figure 2F). Although DZIP1 and DZIP1L expression in MKN-74 cells showed no significant difference, DZIP3 expression in these cells was remarkably different from that in GES-1 cells (P < 0.05).
Next, DZIP levels were assessed in 15 pairs of GC tumor tissue and paracancerous tissue samples using IHC. In GC and paracancerous tissues, respectively, the mean H-SCORE was 85.97 and 8.65 for DZIP1; 70.35 and 61.25 for DZIP1L; and 82.59 and 8.43 for DZIP3. DZIP1 levels in tumor tissue were significantly higher than those in paracancerous tissue (P < 0.01) (Figure 2G).
Association of DZIP Expression with Clinicopathological Features in Patients with GC
Using TCGA data, we examined the correlations between the expression of DZIPs and clinicopathological characteristics such as T/N/M stage, AJCC stage, age, and sex (Figure 3A–F) in patients with GC. We found a relationship between DZIP1 mRNA levels and T stage, but no significant association with the other clinicopathological factors was observed.
 |
Figure 3 Association of DZIP expression with clinicopathological features in gastric cancer (GC). (A–F) Association of DZIP mRNA levels with T stage (tumor stage), N stage (nodal stage), M stage (metastatic stage), American Joint Committee on Cancer (AJCC) stage, age, and sex in GC patients. Kaplan–Meier survival curves comparing the high and low expression of DZIP1 in three probe sets from the Kaplan–Meier plotter database and Gene Expression Profiling Interactive Analysis (GEPIA) database. (G, K, O) Overall survival (OS), examined using the GEPIA database (n=384). (H, L, P) Disease-free survival (DFS), examined using the GEPIA database (n=384). (I, M, Q) OS, examined using the Kaplan–Meier plotter database (n=875). (J, N, R) Post-progression survival (PPS), examined using the Kaplan–Meier plotter database (n=498). *P < 0.05, ***P < 0.001. Abbreviation: NS, no significance. |
To evaluate the association of DZIP expression levels with survival in patients with GC, we used the Kaplan–Meier plotter and GEPIA database. Interestingly, DZIP1 gene expression showed a significant negative correlation with patient survival (GEPIA: OS, P = 0.0041; DFS, P = 0.0046; KM plot: OS, P = 1.1e-12; PPS, P = 1.3e-10) (Figure 3G–J). However, although DZIP1L expression showed no association with DFS (P =0.063) (Figure 3L), it showed a negative correlation with OS and PPS (GEPIA: OS, P = 0.019; KM plot: OS, P = 0.011; PPS, P = 0.00026) (Figure 3K–N). Finally, although DZIP3 expression showed no relationship with OS (P > 0.05) (Figure 3O, Q), it showed a negative association with DFS and PPS (GEPIA DFS, P = 0.041; KM plot: PPS, P = 4.7e-06) (Figure 3P, R).
Prognostic Value of DZIP Expression in GC
TCGA-STAD-based univariate analysis demonstrated that DZIP1 overexpression (P = 0.01113), age (P < 0.00052), grade (P < 0.001), N classification (P = 0.00099), and M classification (P < 0.00470) all showed a strong relationship with poor OS (Figure 4A). Further, using multivariate analysis, DZIP1 overexpression (P < 0.01113), age (P < 0.00928), T classification (P < 0.00861), N classification (0.00009), and M classification (0.00407) were all found to independently predict poor OS in GC (Figure 4B).
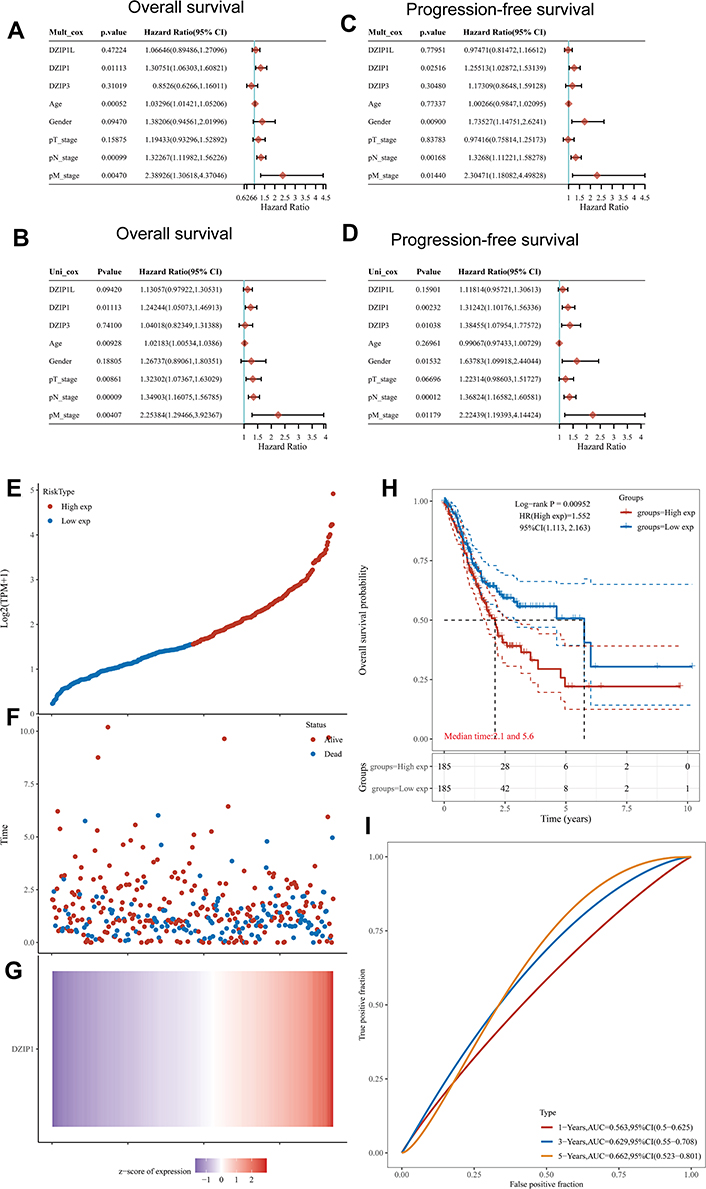 |
Figure 4 Univariate and multivariate Cox regression analysis of the relationship between DZIP expression and clinicopathological factors related to gastric cancer (GC) prognosis (hazard ratios and P-values are provided). (A) Univariate forest plot illustrating the relationship between DZIP expression and clinicopathological factors related to the overall survival (OS) in GC. (B) Multivariate forest plot illustrating the relationship between DZIP expression and clinicopathological factors related to OS in GC. (C) Univariate forest plot illustrating the relationship between DZIP expression and clinicopathological factors related to progression-free survival (PFS) in GC. (D) Multivariate forest plot illustrating the relationship between DZIP expression and clinicopathological factors related to PFS in GC. (E) Curve of risk scores. Patients were divided into low- and high-risk groups according to the median DZIP1 expression. (F) Relationship between survival status and survival duration (years). (G) Heatmap of DZIP1 expression in low- and high-risk groups. The horizontal coordinates in (E, F, and G) all represent samples, and the samples are ordered consistently. (H) Kaplan–Meier survival analysis based on DZIP1 expression. (I) Time-dependent receiver operating characteristic (ROC) curve analysis of DZIP1 gene expression. |
DZIP1 overexpression (P = 0.02516), sex (P = 0.00900), N classification (P = 0.00168), and M classification (P < 0.01440) were all found to show a strong relationship with poor progression-free survival (PFS) (Figure 4C). According to the multivariate analyses, DZIP1 overexpression (P = 0.00232), DZIP3 overexpression (P = 0.01038), sex (P = 0.01532), N classification (0.00012), and M classification (0.01179) could independently predict poor PFS (Figure 4D).
Therefore, we analyzed the prognostic significance of DZIP1 in patients with high vs low DZIP1 levels (low risk vs high risk) (Figure 4E). The duration of survival was found to be longer in the low-risk group (P < 0.05) (Figure 4F, H). Figure 4G shows the z-score heat map of DZIP1 gene expression. The areas under the ROC curves for the value of DZIP1 expression in predicting 1-, 3-, and 5-year OS in patients with GC were 0.563, 0.629, and 0.662, respectively (Figure 4I).
Taken together, the results suggested that DZIP1 expression levels could be closely related to prognosis in patients with GC.
Genetic Mutations in DZIPs and Their Associations with OS
In total, 1213 samples from TCGA datasets across three studies were included to detect the mutation frequency in GC. As shown in Figure 5A, the mutation rate for DZIPs was approximately 9%. The sites and types of mutations are shown in Figure 5B, and the respective frequency and types of alterations in DZIPs in GC are shown in Figure 5C. A violin plot showed that mutated DZIP1 was less common than wild-type DZIP1 (P = 0.0088) (Figure 5D). Furthermore, Kaplan–Meier analysis showed that mutations in DZIP1 were associated with a longer OS (P = 2.968e-3) in GC patients (Figure 5E). These results implied that a genetic mutation in DZIP1 was associated with a good prognosis in GC patients.
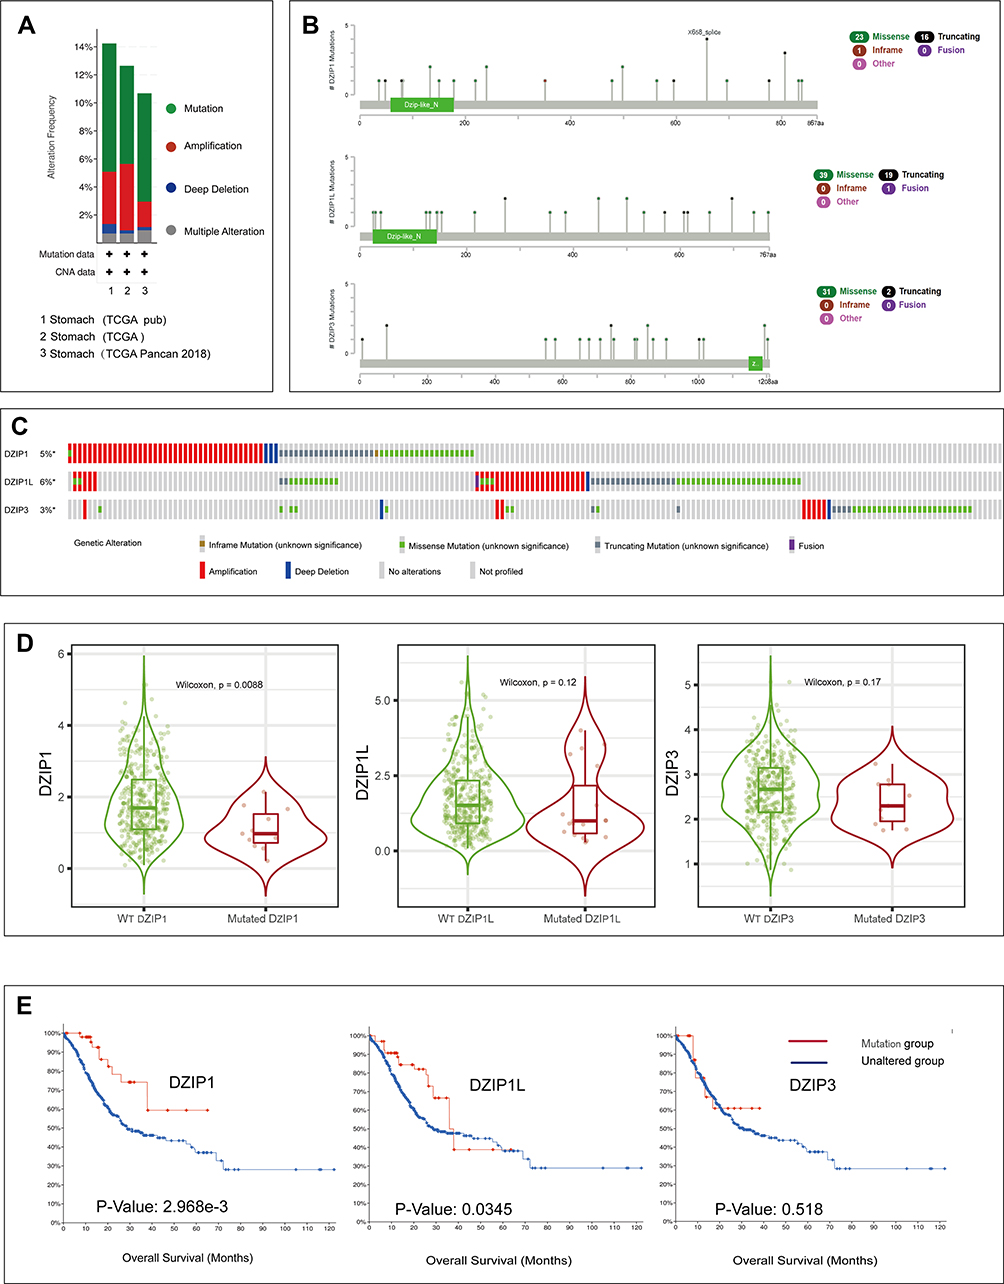 |
Figure 5 Genetic alterations in DZIPs and their association with overall survival (OS) in gastric cancer (GC) patients (cBioPortal, n=1213). (A) Frequencies of DZIP mutations and copy number alterations (CNA) in the three datasets. (B) Mutation site profiles of the DZIP genes. (C) OncoPrint visual summary of alterations in DZIPs in GC. (D) Expression levels of wild-type and mutant DZIP genes. (E) Kaplan–Meier plots comparing OS in cases with and without DZIP gene mutations. |
Functional Enrichment Analysis for DZIP1
The proteins interacting with DZIP1 were searched for using the IMEx database (Figure 6A). Then, we obtained 167 differentially expressed genes (DEGs) between the DZIP1 high vs low expression groups and constructed a PPI based on these (Figure 6B and C). Further enrichment analysis suggested that DZIP1 may be associated with “extracellular matrix organization”, “endoplasmic reticulum lumen”, “collagen binding”, “integrin binding”, “ECM–receptor interaction”, “focal adhesion”, and “PI3K-Akt signaling pathway” (Figure 6D–G). DZIP1 was also found to be involved in “immune response”, “cell activation”, “cell growth”, “WNT signaling pathway”, and “RAS signaling pathway” according to GSEA (Figure 6H). Finally, on examining the association between the levels of DZIP1 and six EMT-related factors using the correlation analysis module of the TIMER database, we found that DZIP1 expression showed a positive correlation with TGFB1 (R = 0.596), CDH2 (R = 0.641), MMP2 (R = 0.653), MMP9 (R = 0.16), and VIM (R = 0.708) expression and a negative correlation with CDH1 expression (R = −0.216) (Figure 6I).
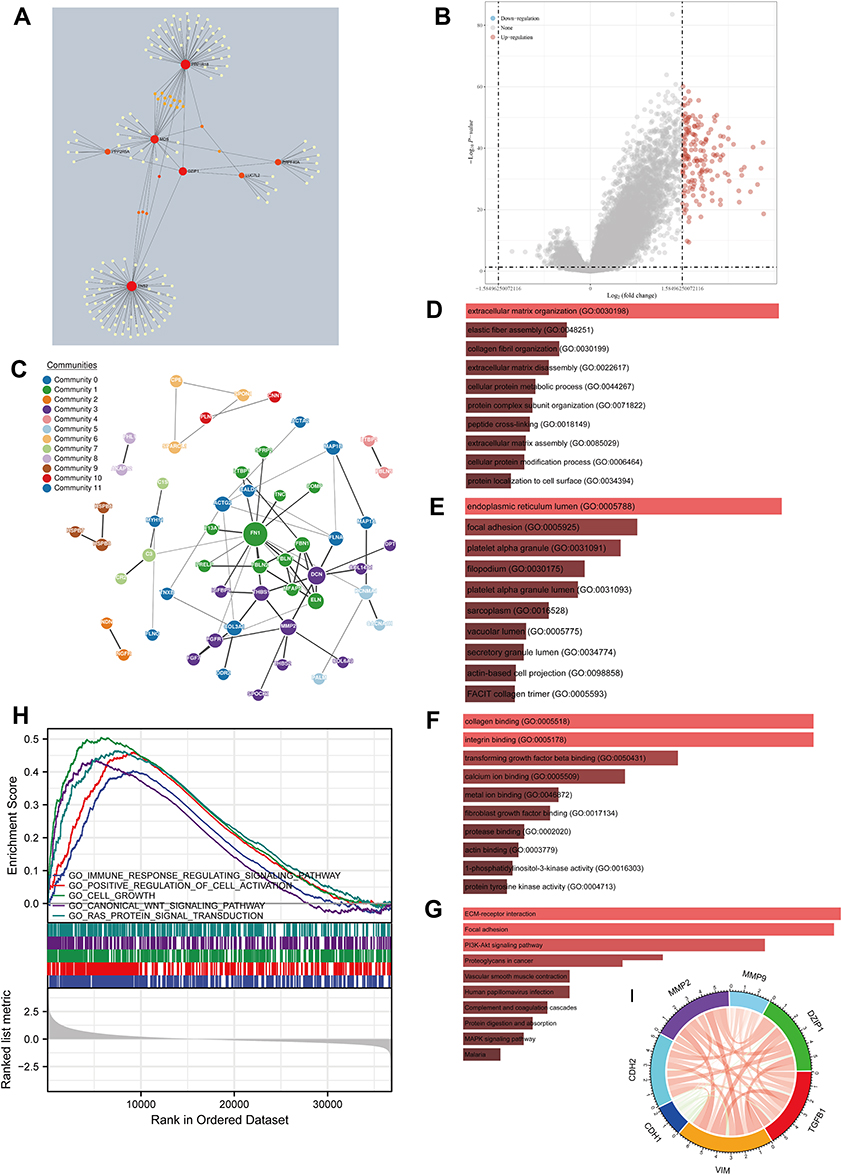 |
Figure 6 Gene network and enrichment analysis for DZIP1. (A) Network of DZIP1 and related neighboring genes, identified based on the IMEx protein interaction database. (B) Volcano map of differentially expressed genes (DEGs) observed after changes in DZIP1 expression. Red dots represent upregulated genes, and blue dots represent downregulated genes. The abscissa indicates variations in gene expression between different samples (log2 fold change), and the ordinate indicates the significance of the differences (−log10 padj). (C) Network of DZIP1 and genes showing a positive correlation with its expression (GeNets database). (D–F) Functional enrichment analysis of genes upregulated after increases in DZIP1 expression. (D) Biological Processes (BP), (E) Cellular Components (CC), (F) Molecular Functions (MF), (G) Kyoto Encyclopedia of Genes and Genomes (KEGG).(H) Gene set enrichment analysis for DZIP1. (I) Relationship between the expression of DZIP1 and that of six EMT-related factors. Red lines represent a positive correlation and blue lines represent a negative correlation. |
Differences Between the Functions of Mutant and Wild-Type DZIP1
Our previous results suggested that DZIP1 mutations were associated with a good prognosis in GC. To explore the potential mechanism underlying this link, we divided patients from TCGA-STAD cohorts into two groups according to whether they showed DZIP1 mutations. The DEGs (Figure 7A) were subjected to enrichment analysis. The results revealed enrichment for multiple tumor-associated pathways, including ‘cell–cell adhesion via plasma-membrane adhesion molecules’, “regulation of cell motility”, “platelet alpha granule”, “chemokine activity”, ‘cell adhesion molecules’, and “PI3K-Akt signaling pathway” (Figure 7B–E). Subsequently, on examining the effect of DZIP1 mutations on six EMT-related factors, we found that the expression of VIM, MMP2, and MMP9 was significantly elevated in the DZIP1 wild-type cohort, whereas the expression of CDH1 showed the opposite trend (Figure 7F).
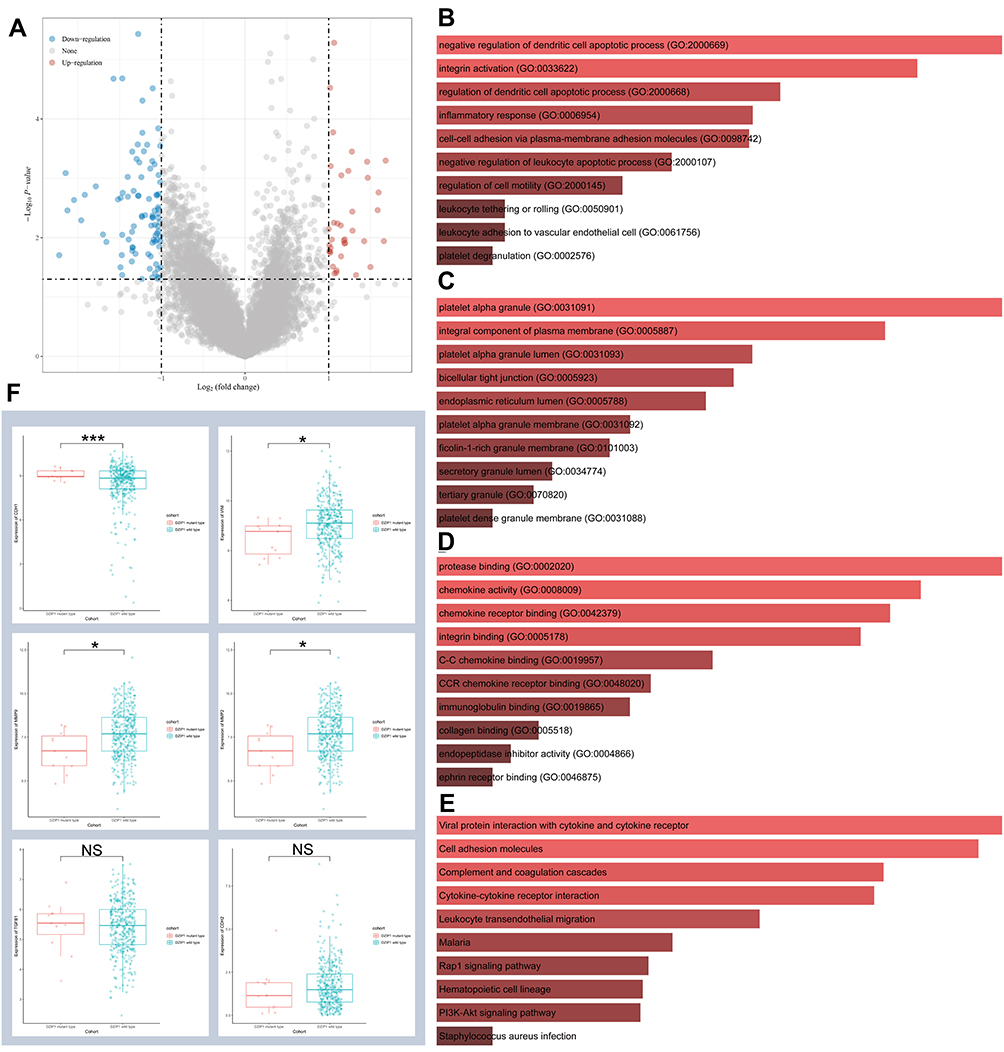 |
Figure 7 Functional enrichment analysis of DZIP1 wild-type and mutant genes. (A) Volcano map of differentially expressed genes (DEGs) across the DZIP1 wild-type and mutant cohorts. Red dots represent upregulated genes, and blue dots represent downregulated genes. The abscissa indicates variations in gene expression between different samples (log2 fold change), and the ordinate indicates the significance of the differences (−log10 padj). (B–E) Functional enrichment analysis of genes upregulated in the DZIP1 wild-type and mutant cohorts. (B) Biological Processes (BP), (C) Cellular Components (CC), (D) Molecular Functions (MF), (E) Kyoto Encyclopedia of Genes and Genomes (KEGG). (F) Relationship between the expression of the DZIP1 wild-type and mutant genes and that of six EMT-related factors. Red lines represent a positive correlation and blue lines represent a negative correlation. *P < 0.05, ***P < 0.001. Abbreviation: NS, no significance. |
Effect of DZIP1 Expression on the Immune Activity in the Tumor Microenvironment
DZIP1 levels were found to be correlated with infiltration by sixteen types of tumor-infiltrating cells, including activated myeloid dendritic cells, naive CD4+ T cells, naive CD8+ T cells, common lymphoid progenitors, myeloid dendritic cells, endothelial cells, eosinophils, granulocyte−monocyte progenitors, hematopoietic stem cells, monocytes, naïve B cells, plasma B cells, gamma delta T cells, CD4+ Th1 T cells, and CD4+ Th2 T cells (Figure 8A). We also found differences in the infiltration abundance of activated myeloid dendritic cells, naive CD4+ T cells, common lymphoid progenitors, endothelial cells, and hematopoietic stem cells between individuals with DZIP1 mutant and wild-type genes (Figure 8B).
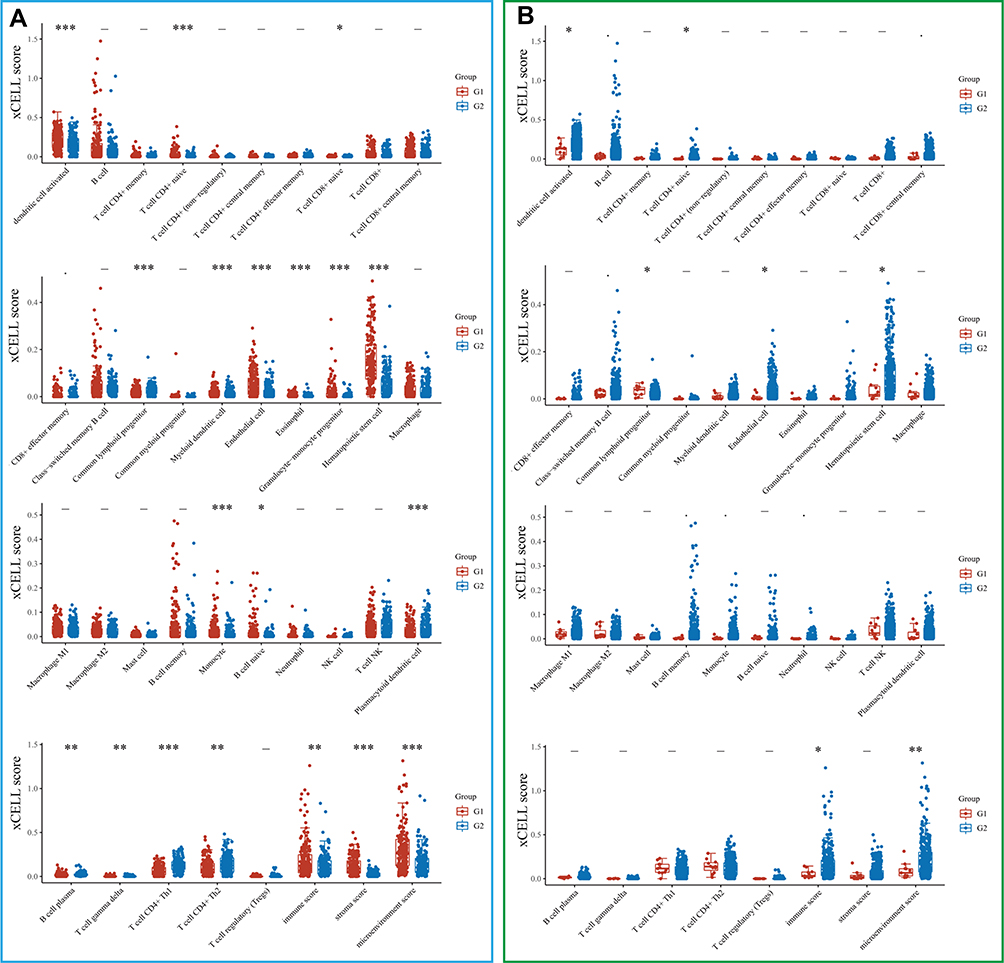 |
Figure 8 Correlation between DZIP1 expression/mutations and the infiltration of immune cells (horizontal axis represents the type of immune cells, and the vertical axis represents the distribution of the immune score [xCELL score] in different groups, which are represented by different colors). (A) Red and blue represent the groups with high and low expression of DZIP1, respectively (G1: high expression; G2: low expression). (B) Red and blue represent the DZIP1 mutant and wild-type groups, respectively. The upper left corner shows the method used for obtaining P-values and asterisks represent the levels of significance (G1: DZIP1 mutant; G2: DZIP1 wild-type). *P < 0.05, **P < 0.01, ***P < 0.001. |
Correlation Between the Expression of DZIP1 and Common Immune Checkpoints (ICPs)
To assess how DZIP1 expression affects the response to immunotherapy, we examined the association between DZIP1 levels and those of common ICPs. Examination of CD274, CTLA4, HAVCR2, LAG3, PDCD1, PDCD1LG2, TIGIT, and SIGEC15 levels demonstrated a high expression of ICPs in the high DZIP1 expression group (Figure 9A). TIMER-based analyses also showed a positive correlation between DZIP1 expression and that of CTLA4, TIGIT, HAVCR2, PDCD1, and PDCD1LG2 (Figure 9B). These elevated levels of ICPs suggested that patients with high DZIP1 expression may show an improved response to immunotherapy.
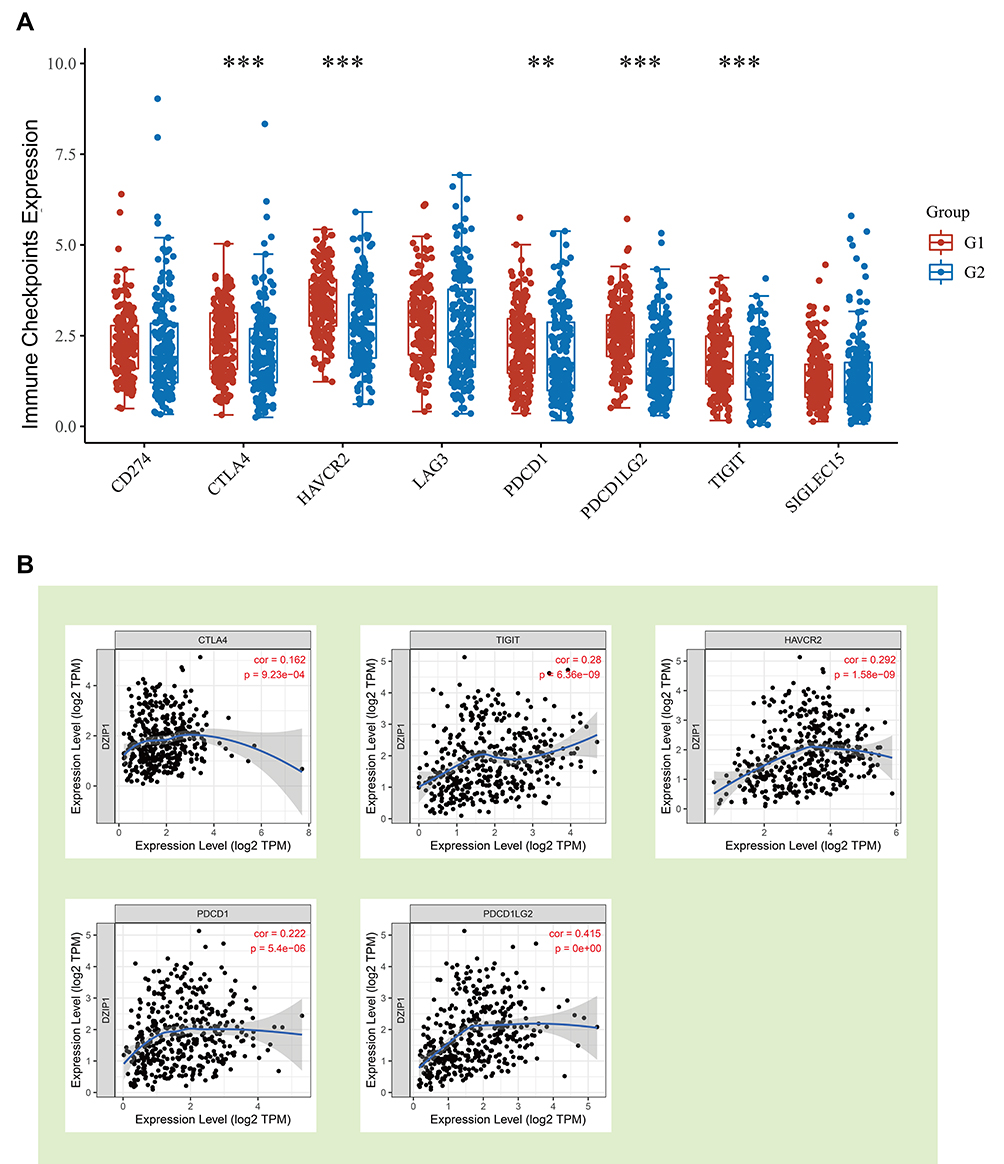 |
Figure 9 Relationship between the expression levels of DZIP1 and common immune checkpoint (ICPs). (A) Red and blue represent the groups with high and low expression of DZIP1, respectively. (B) Spearman correlation coefficients for the relationship between the expression levels of DZIP1 and five ICPs. **P < 0.01, ***P < 0.001. |
DZIP1 DNA Methylation Analysis
Methylation is an important epigenetic modification; thus, we next investigated whether DZIP1 expression was related to DZIP1 DNA methylation in GC. Methylation at sites identified by the following probes showed a negative correlation with DZIP1 gene expression: cg05845403, cg21627412, cg08386091, cg15792252, cg04101379, cg19722851, cg05505803, cg02788400, cg26886381, cg00756058, cg18206952, cg24107021, cg11337289, and cg22991101 (Figure 10A). Survival analysis indicated that hypomethylation at cg02788440, cg04101379, cg05505803, cg05845403, cg08386091, cg09375033, cg11337289, cg15792252, cg17922851, cg18206952, cg19872537, cg22991101, cg24107021, and cg26886381 in the DZIP1 promoter was correlated with a poor prognosis (Figure 10B–O). These results were consistent with those of our previous survival analysis.
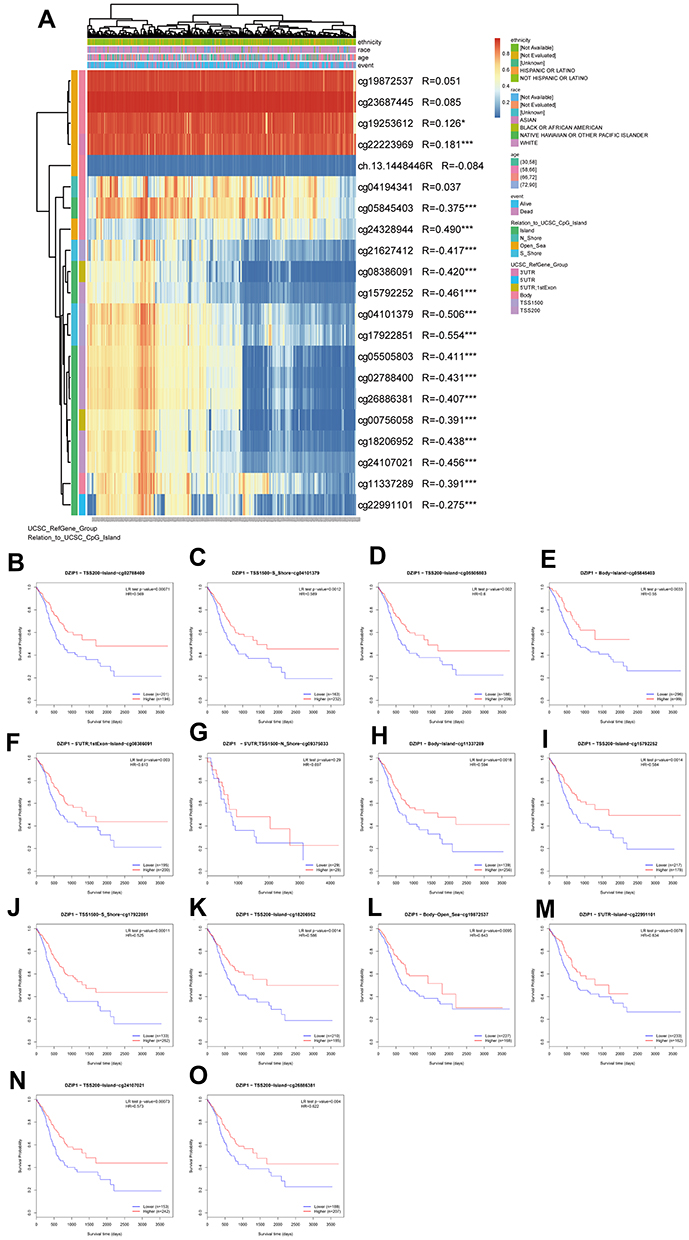 |
Figure 10 Analysis of DZIP1 methylation in gastric cancer. (A) Waterfall plot of the methylation level of the DZIP1 gene. The correlations between DZIP1 methylation and its expression were analyzed. (B–O) Survival analysis based on methylation at multiple sites; P < 0.05 was considered statistically significant. *P < 0.05, ***P < 0.001. |
Subsequently, we performed a functional enrichment analysis for all DZIP1 methylation probes. The probes were found to be enriched for “cilium assembly”, “nucleic acid binding”, “centriole”, “ciliary basal body”, “smoothened signaling pathway”, “establishment of protein localization”, “germ cell development”, “regulation of protein binding”, “protein localization to cilium”, “ciliary transition fiber”, “cytoplasmic sequestering of protein”, and “positive regulation of cilium assembly” (Figure 11A). Then, we tested whether DZIP1 promoter methylation correlates with DZIP1 expression. As shown in Figure 11B and C, DZIP1 promoter methylation level was negatively correlated with DZIP1 expression. Survival curves demonstrated a significant relationship between DZIP1 promoter hypomethylation and worse OS and PFS (P < 0.05) (Figure 11D–F).
 |
Figure 11 Association between DZIP1 expression levels and the methylation levels of the DZIP1 promoter. (A) Gene ontology enrichment based on methylation at multiple sites. (B and C) Pearson’s correlation coefficient (B) and Spearman correlation coefficient (C) for the relationship between DZIP1 promoter methylation levels and DZIP1 expression levels. (D–F) Association of DZIP1 promoter methylation levels with (D) disease-free interval (DFI), (E) progression-free interval (PFI), and (F) overall survival (OS) in patients with gastric cancer. |
Discussion
The involvement of DZIPs in GC has so far remained unclear. In our study, we provided an insight into the expression levels of DZIPs in GC along with the potential regulators of these levels. Using bioinformatics, we explored the expression of DZIPs at both the mRNA and protein levels. Our results demonstrated significant DZIP1 and DZIP3 upregulation in GC tissue, and we also observed a significant correlation between a poor GC prognosis and high levels of DZIPs. Using Cox regression analysis, we found that only DZIP1 was an independent prognosticator for both OS and PFS in GC. Further analysis of the clinical significance of DZIP1 suggested that in patients with GC, DZIP1 expression was associated with prognosis as well as 5-year survival.
Mutations are often closely associated with tumor development.32 Therefore, we analyzed the frequency of DZIP mutations and their specific types and loci. We then compared the differences in expression levels between wild-type and mutant forms of DZIPs and found that DZIP1 mutations lead to downregulated gene expression. This suggested that mutations in DZIP1 may be associated with reduced levels of DZIP1. Accordingly, we performed survival analysis and observed significantly higher survival rates among GC patients with the DZIP1 mutant gene than among those with the DZIP1 wild-type gene.
Taken together, our results suggested that DZIP1 may be the most valuable of the DZIPs from a GC perspective. PPI network analysis showed that DZIP1 interacts with multiple genes (including TNS2, LUC7L2, PRPF40A, MOS, PPP2R5A, and PPP1R18) that have previously been proven to show a strong association with tumor development.33–37 This specific intrinsic link between DZIP1 and its interacting genes may be crucial for their role in GC progression. To further explore the potential oncogenic mechanism of DZIP1 action, we identified the genes whose expression was positively associated with that of DZIP1 using TCGA-STAD. Further enrichment analysis indicated that DZIP1 may be involved in EMT-related pathways such as extracellular matrix organization, collagen binding, integrin binding, PI3K-Akt signaling, and focal adhesion. DZIP1 is known to regulate the intracellular distribution of Gli family members, which are important players in the EMT.38 Accordingly, we examined whether DZIP1 expression was correlated with the expression of the six classical EMT-related genes, and our results were consistent with our hypothesis. Additionally, we found that DZIP1 mutations may be involved in EMT-related mechanisms, and this warrants more in-depth investigation.
The tumor immune microenvironment is tightly linked to EMT.39 In the present study, the abundance of infiltration by multiple immune cells was found to correlate with the expression of DZIP1 and with DZIP1 mutations. Subsequently, we analyzed the correlation between DZIP1 expression levels and those of ICPs. We found that DZIP1 levels showed a positive correlation with those of CTLA4, TIGIT, HAVCR2, PDCD1, and PDCD1LG2, suggesting that DZIP1 can influence the response to immunotherapy in patients with GC.
DNA methylation is now considered to be one of the factors closely associated with tumor development.40 We found a correlation between hypomethylation at multiple sites and a poor prognosis in GC. Notably, methylation at different sites has varying effects on gene expression, and promoter methylation is currently best understood. In general, high levels of promoter methylation tend to reduce gene expression or silence the gene.41 In our study, we found that the degree of methylation in the DZIP1 promoter region was significantly and negatively correlated with the expression levels of DZIP1, consistent with previous reports. Moreover, patients with GC showing a highly methylated promoter region had a good prognosis. In addition, our enrichment analysis for all methylation probes showed that DZIP1 methylation may be associated with the smoothened signaling pathway, which has previously been reported to be a part of the hedgehog pathway, a signaling pathway regulated by smoothened. Notably, the hedgehog signaling pathway is also one of the promoters of the EMT.42,43
Conclusion
In conclusion, in our study, we found that DZIP1 is an independent prognostic predictor for GC and could be involved in GC progression. DZIP1 is involved in the activation of the EMT phenotype and correlates with the abundance of infiltration by multiple types of immune cells. In addition, DZIP1 mutations may be associated with a favorable prognosis in GC. Finally, DZIP1 DNA promoter methylation could serve as a target for GC treatment in the future. Our findings lay the foundation for the experimental confirmation of the role of DZIP1 in GC and could help in the prognostication and treatment of this malignancy in the future.
Data Sharing Statement
We declare that all the data in this article are authentic, valid, and available for use on reasonable request.
Ethical Standards
The study was approved by the Jiangsu Province Hospital of Chinese Medicine, Affiliated Hospital of Nanjing University of Chinese Medicine, Ethics and Research Committee (protocol number: 2019NL-166-02).
Acknowledgments
We are grateful to all the participants of the present study.
The present study was supported by the Youth Science and Technology Project of Suzhou (No. KJXW2019059); the Suzhou Science and Technology Development Plan (No. SYSD2019006); Foundation of A Project Funded by the Priority Academic Program Development of Jiangsu Higher Education Institutions (PAPD) (no. [2018] 87), the Open Projects of the Discipline of Chinese Medicine of Nanjing University of Chinese Medicine supported by the Subject of Academic Priority Discipline of Jiangsu Higher Education Institutions, Science and Technology Program for Social Development of Jiangsu Province, China (BE2019771); the State Administration of Traditional Chinese Medicine of the People’s Republic of China (JDZX2015090); and the National Nature Science Foundation of China (81973782).
Author Contributions
All authors made a significant contribution to the work reported, whether that is in the conception, study design, execution, acquisition of data, analysis and interpretation, or in all these areas; took part in drafting, revising or critically reviewing the article; gave final approval of the version to be published; have agreed on the journal to which the article has been submitted; and agree to be accountable for all aspects of the work. Shen-lin Liu and Xi Zou are conjointly designated as corresponding authors.
Disclosure
The authors declare no conflicts of interest.
References
1. Smyth EC, Nilsson M, Grabsch HI, van Grieken NC, Lordick F. Gastric cancer. Lancet. 2020;396(10251):635–648. doi:10.1016/s0140-6736(20)31288-5
2. Drilon A, Siena S, Dziadziuszko R. Correction to Lancet Oncol. Lancet Oncol. 2020;21(6):e304. doi:10.1016/s1470-2045(20)30267-9
3. Bray F, Ferlay J, Soerjomataram I, et al. Erratum: global cancer statistics 2018: GLOBOCAN estimates of incidence and mortality worldwide for 36 cancers in 185 countries. CA Cancer J Clin. 2020;70(4):313. doi:10.3322/caac.21609
4. Latest global cancer data: cancer burden rises to 19.3 million new cases and 10.0 million cancer deaths in 2020. Available from: https://www.iarc.who.int/faq/latest-global-cancer-data-2020-qa/.
5. Moore FL, Jaruzelska J, Dorfman DM, Reijo-Pera RA. Identification of a novel gene, DZIP (DAZ-interacting protein), that encodes a protein that interacts with DAZ (deleted in azoospermia) and is expressed in embryonic stem cells and germ cells. Genomics. 2004;83(5):834–843. doi:10.1016/j.ygeno.2003.11.005
6. Shigunov P, Sotelo-Silveira J, Stimamiglio MA, et al. Ribonomic analysis of human DZIP1 reveals its involvement in ribonucleoprotein complexes and stress granules. BMC Mol Biol. 2014;15:12. doi:10.1186/1471-2199-15-12
7. Zhang B, Zhang T, Wang G, et al. GSK3β-Dzip1-Rab8 cascade regulates ciliogenesis after mitosis. PLoS Biol. 2015;13(4):e1002129. doi:10.1371/journal.pbio.1002129
8. Zhang B, Wang G, Xu X, et al. DAZ-interacting Protein 1 (Dzip1) Phosphorylation by Polo-like Kinase 1 (Plk1) Regulates the Centriolar Satellite Localization of the BBSome Protein during the Cell Cycle. J Biol Chem. 2017;292(4):1351–1360. doi:10.1074/jbc.M116.765438
9. Liang T, Zhou X, Li P, et al. DZIP3 is a key factor to stratify IDH1 wild-type lower-grade gliomas. Aging (Albany NY). 2020;12(24):24995–25004. doi:10.18632/aging.103817
10. Kolapalli SP, Sahu R, Chauhan NR, et al. RNA-Binding RING E3-Ligase DZIP3/hRUL138 Stabilizes Cyclin D1 to Drive Cell-Cycle and Cancer Progression. Cancer Res. 2021;81(2):315–331. doi:10.1158/0008-5472.Can-20-1871
11. Rhodes DR, Yu J, Shanker K, et al. ONCOMINE: a cancer microarray database and integrated data-mining platform. Neoplasia. 2004;6(1):1–6. doi:10.1016/s1476-5586(04)80047-2
12. Pan JH, Zhou H, Cooper L, et al. LAYN is a prognostic biomarker and correlated with immune infiltrates in gastric and colon cancers. Front Immunol. 2019;10:6. doi:10.3389/fimmu.2019.00006
13. GSE118916. Available from: https://www.ncbi.nlm.nih.gov/geo/query/acc.cgi?acc=GSE118919.
14. GSE13861. Available from: https://www.ncbi.nlm.nih.gov/geo/query/acc.cgi.
15. GSE29272. Available from: https://www.ncbi.nlm.nih.gov/geo/query/acc.cgi?acc=GSE29272.
16. Coletta S, Salvi V, Della Bella C, et al. The immune receptor CD300e negatively regulates T cell activation by impairing the STAT1-dependent antigen presentation. Sci Rep. 2020;10(1):16501. doi:10.1038/s41598-020-73552-9
17. Edge SB, Compton CC. The American Joint Committee on Cancer: the 7th edition of the AJCC cancer staging manual and the future of TNM. Ann Surg Oncol. 2010;17(6):1471–1474. doi:10.1245/s10434-010-0985-4
18. Yu B, Zhang Y, Wu K, et al. CD147 promotes progression of head and neck squamous cell carcinoma via NF-kappa B signaling. J Cell Mol Med. 2019;23(2):954–966. doi:10.1111/jcmm.13996
19. Yuan Y, Liao H, Pu Q, et al. miR-410 induces both epithelial-mesenchymal transition and radioresistance through activation of the PI3K/mTOR pathway in non-small cell lung cancer. Signal Transduct Target Ther. 2020;5(1):85. doi:10.1038/s41392-020-0182-2
20. Tang Z, Li C, Kang B, Gao G, Li C, Zhang Z. GEPIA: a web server for cancer and normal gene expression profiling and interactive analyses. Nucleic Acids Res. 2017;45(W1):W98–w102. doi:10.1093/nar/gkx247
21. Sun CC, Li SJ, Hu W, et al. Comprehensive analysis of the expression and prognosis for E2Fs in human breast cancer. Mol Ther. 2019;27(6):1153–1165. doi:10.1016/j.ymthe.2019.03.019
22. Wang Z, Jensen MA, Zenklusen JC. A practical guide to the cancer genome atlas (TCGA). Methods Mol Biol. 2016;1418:111–141. doi:10.1007/978-1-4939-3578-9_6
23. Chandrashekar DS, Bashel B, Balasubramanya SAH, et al. UALCAN: a portal for facilitating tumor subgroup gene expression and survival analyses. Neoplasia. 2017;19(8):649–658. doi:10.1016/j.neo.2017.05.002
24. Gao J, Aksoy BA, Dogrusoz U, et al. Integrative analysis of complex cancer genomics and clinical profiles using the cBioPortal. Sci Signal. 2013;6(269):pl1. doi:10.1126/scisignal.2004088
25. Del-Toro N, Duesbury M, Koch M, et al. Capturing variation impact on molecular interactions in the IMEx Consortium mutations data set. Nat Commun. 2019;10(1):10. doi:10.1038/s41467-018-07709-6
26. Xia J, Gill EE, Hancock RE. NetworkAnalyst for statistical, visual and network-based meta-analysis of gene expression data. Nat Protoc. 2015;10(6):823–844. doi:10.1038/nprot.2015.052
27. Zhou Y, Zhou B, Pache L, et al. Metascape provides a biologist-oriented resource for the analysis of systems-level datasets. Nat Commun. 2019;10(1):1523. doi:10.1038/s41467-019-09234-6
28. Subramanian A, Tamayo P, Mootha VK, et al. Gene set enrichment analysis: a knowledge-based approach for interpreting genome-wide expression profiles. Proc Natl Acad Sci U S A. 2005;102(43):15545–15550. doi:10.1073/pnas.0506580102
29. Koch A, Jeschke J, Van Criekinge W, van Engeland M, De Meyer T. MEXPRESS update 2019. Nucleic Acids Res. 2019;47(W1):W561–w565. doi:10.1093/nar/gkz445
30. Modhukur V, Iljasenko T, Metsalu T, Lokk K, Laisk-Podar T, Vilo J. MethSurv: a web tool to perform multivariable survival analysis using DNA methylation data. Epigenomics. 2018;10(3):277–288. doi:10.2217/epi-2017-0118
31. Li M, Zou D, Li Z, et al. EWAS Atlas: a curated knowledgebase of epigenome-wide association studies. Nucleic Acids Res. 2019;47(D1):D983–d988. doi:10.1093/nar/gky1027
32. Prior IA, Hood FE, Hartley JL. The frequency of ras mutations in cancer. Cancer Res. 2020;80(14):2969–2974. doi:10.1158/0008-5472.Can-19-3682
33. Nizioł M, Zińczuk J, Zaręba K, Guzińska-Ustymowicz K, Pryczynicz A. Immunohistochemical analysis of the expression of adhesion proteins: TNS1, TNS2 and TNS3 in correlation with clinicopathological parameters in gastric cancer. Biomolecules. 2021;11(5):640. doi:10.3390/biom11050640
34. Singh H, Lane AA, Correll M, et al. Putative RNA-splicing gene LUC7L2 on 7q34 represents a candidate gene in pathogenesis of myeloid malignancies. Blood Cancer J. 2013;3(5):e117. doi:10.1038/bcj.2013.16
35. Oleksiewicz U, Liloglou T, Tasopoulou KM, et al. COL1A1, PRPF40A, and UCP2 correlate with hypoxia markers in non-small cell lung cancer. J Cancer Res Clin Oncol. 2017;143(7):1133–1141. doi:10.1007/s00432-017-2381-y
36. Mao Z, Liu C, Lin X, Sun B, Su C. PPP2R5A: a multirole protein phosphatase subunit in regulating cancer development. Cancer Lett. 2018;414:222–229. doi:10.1016/j.canlet.2017.11.024
37. Meng L, Wang M, Du Z, et al. Cell signaling pathway in 12-O-tetradecanoylphorbol-13-acetate-induced LCN2 gene transcription in esophageal squamous cell carcinoma. Biomed Res Int. 2017;2107:9592501. doi:10.1155/2017/9592501.
38. Arnold CR, Lamont RE, Walker JT, et al. Comparative analysis of genes regulated by Dzip1/iguana and hedgehog in zebrafish. Dev Dyn. 2015;244(2):211–223. doi:10.1002/dvdy.24237
39. Erin N, Grahovac J, Brozovic A, Efferth T. Tumor microenvironment and epithelial mesenchymal transition as targets to overcome tumor multidrug resistance. Drug Resist Updat. 2020;53(100715). doi:10.1016/j.drup.2020.100715
40. Morgan AE, Davies TJ, Mc Auley MT. The role of DNA methylation in ageing and cancer. Proc Nutr Soc. 2018;77(4):412–422. doi:10.1017/s0029665118000150
41. Jones PA. Functions of DNA methylation: islands, start sites, gene bodies and beyond. Nat Rev Genet. 2012;13(7):484–492. doi:10.1038/nrg3230
42. Gonzalez DM, Medici D. Signaling mechanisms of the epithelial-mesenchymal transition. Sci Signal. 2014;7(344):re8. doi:10.1126/scisignal.2005189
43. Hu A, Song BL. The interplay of Patched, Smoothened and cholesterol in Hedgehog signaling. Curr Opin Cell Biol. 2019;61:31–38. doi:10.1016/j.ceb.2019.06.008
 © 2021 The Author(s). This work is published and licensed by Dove Medical Press Limited. The
full terms of this license are available at https://www.dovepress.com/terms
and incorporate the Creative Commons Attribution
- Non Commercial (unported, 3.0) License.
By accessing the work you hereby accept the Terms. Non-commercial uses of the work are permitted
without any further permission from Dove Medical Press Limited, provided the work is properly
attributed. For permission for commercial use of this work, please see paragraphs 4.2 and 5 of our Terms.
© 2021 The Author(s). This work is published and licensed by Dove Medical Press Limited. The
full terms of this license are available at https://www.dovepress.com/terms
and incorporate the Creative Commons Attribution
- Non Commercial (unported, 3.0) License.
By accessing the work you hereby accept the Terms. Non-commercial uses of the work are permitted
without any further permission from Dove Medical Press Limited, provided the work is properly
attributed. For permission for commercial use of this work, please see paragraphs 4.2 and 5 of our Terms.